Review
. 2017 Dec;22(12):1-28.
doi: 10.1117/1.JBO.22.12.121720.

Optical coherence elastography in ophthalmology

Affiliations
Review

Optical coherence elastography in ophthalmology

Mitchell A Kirby et al. J Biomed Opt. 2017 Dec.

Abstract

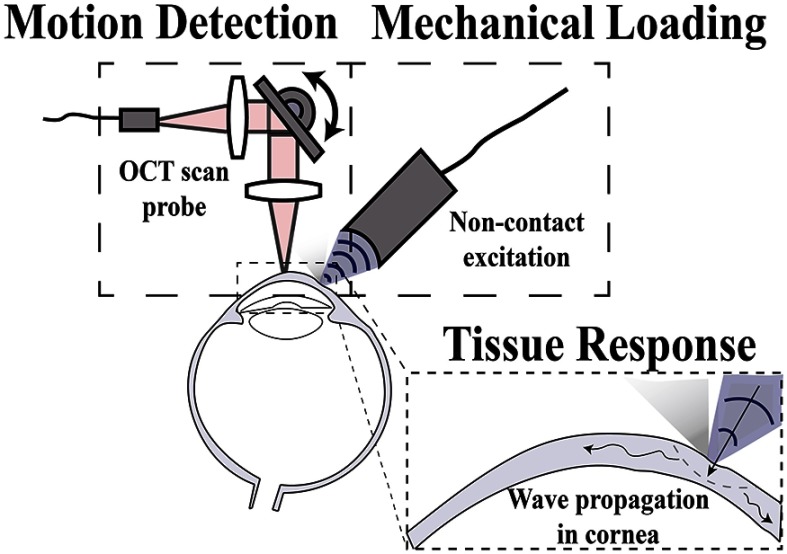
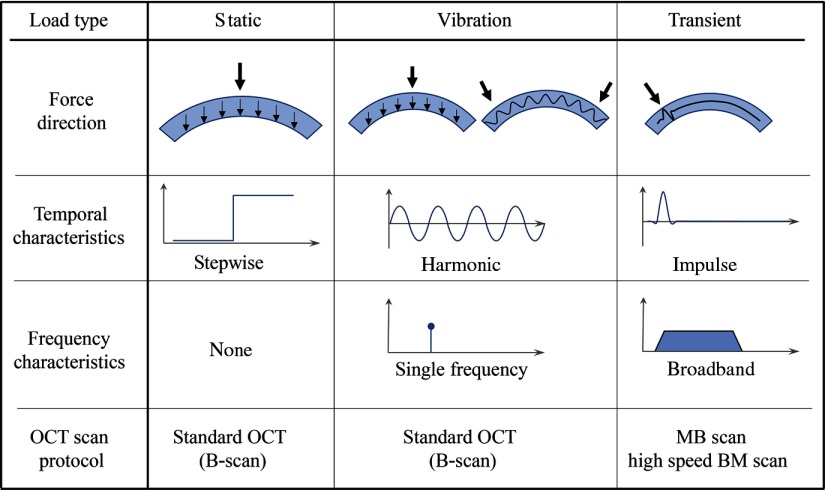
Optical coherence elastography (OCE) can provide clinically valuable information based on local measurements of tissue stiffness. Improved light sources and scanning methods in optical coherence tomography (OCT) have led to rapid growth in systems for high-resolution, quantitative elastography using imaged displacements and strains within soft tissue to infer local mechanical properties. We describe in some detail the physical processes underlying tissue mechanical response based on static and dynamic displacement methods. Namely, the assumptions commonly used to interpret displacement and strain measurements in terms of tissue elasticity for static OCE and propagating wave modes in dynamic OCE are discussed with the ultimate focus on OCT system design for ophthalmic applications. Practical OCT motion-tracking methods used to map tissue elasticity are also presented to fully describe technical developments in OCE, particularly noting those focused on the anterior segment of the eye. Clinical issues and future directions are discussed in the hope that OCE techniques will rapidly move forward to translational studies and clinical applications.

Keywords: air-coupled ultrasound; mechanical wave imaging; ocular biomechanics; optical coherence elastography, acoustic radiation force; optical coherence tomography; phase-sensitive optical coherence tomography; speckle tracking; tissue elasticity.


Figures

Fig. 1
Fig. 1
Schematic demonstrating the main components of OCE.
Fig. 2
Fig. 2
Typical loading schemes in OCE.
Fig. 3
Fig. 3
Mean stress–strain curves measured in porcine cornea under tensile loading. The region between O and A is described as the region of crimped collagen fibers; A to B is the ‘linear region’ of aligned collagen fibers; and B to C is nonlinear as damage begins. (Figure reproduced from Ref. .)
Fig. 4
Fig. 4
Differences in the load and unload pattern define hysteresis. The time for a deformed tissue to return to its original position is the relaxation time. (Figure reproduced from Ref. 69).
Fig. 5
Fig. 5
Rayleigh mechanical waves propagate along the air/tissue interface.
Fig. 6
Fig. 6
Scholte mechanical waves propagate along the liquid/tissue interface.
Fig. 7
Fig. 7
Guided mechanical waves propagate in a thin tissue layer bounded from one side by air and the other by liquid.
Fig. 8
Fig. 8
Phase velocity dispersion for propagating guided waves in a thin tissue layer loaded from one side by a liquid and the other side by air.
Fig. 9
Fig. 9
Schematic representation of Kelvin–Voigt model where E is the storage modulus and ζ is the viscosity.
Fig. 10
Fig. 10
Frequency dependent (a) wave speed and (b) attenuation in the Kelvin–Voigt model. Parameters μ1=25  kPa and ζ=1 and 4 Pa*s were used.
Fig. 11
Fig. 11
Schematic representation of Maxwell model.
Fig. 12
Fig. 12
Schematic of shear wave excitation with ARF.
Fig. 13
Fig. 13
Diagram of shear waves excitation with a noncontact air-puff source. (Figure reproduced from Ref.  © Astro Ltd. Reproduced by permission of IOP Publishing. All rights reserved.)
Fig. 14
Fig. 14
All-optical excitation and detection arrangement based on pulsed UV excitation.
Fig. 15
Fig. 15
Air-coupled ARF (or AμT) for mechanical wave excitation in tissue.
Fig. 16
Fig. 16
Wave characteristics from different push profiles on the same medium assuming the excitation time always satisfies Eq. (45).
Fig. 17
Fig. 17
Schematic of OCE systems based on OCT implementation in the optical frequency domain: (a) SD-OCT and (b) SS-OCT.
Fig. 18
Fig. 18
The OPL of incident light must account for changes in refractive index that delay the measured signal. The surface ripple, (i) for example, would result in error in displacements measured at a specific depth. (ii) Dynamic displacements within a phantom are shown without (a1–a4) and with (b1–b4) motion. (Figure reproduced from Ref. .)
Fig. 19
Fig. 19
Schematics demonstrating static compression OCE, where displacement and strain maps are generated from (a) (i) unloaded and (ii) preloaded sample. The resulting OCT image in the (b) unloaded and (c) preloaded case with the corresponding schematic. The known stress–strain curve of the stress sensor used to quantify E is shown in (d). The displacement map is shown in (e) and the strain map in (f). (Figure reproduced from Ref. .)
Fig. 20
Fig. 20
(a) M-B scan protocol. (Figure reproduced from Ref. 47) (b) Timing schematic of scanning protocol (Figure reproduced from Ref. .)
Fig. 21
Fig. 21
Modulus estimation based on shear wave propagation using M-B scan protocol. (a)–(d) demonstrate propagating mechanical waves at different time frames. The structural OCT image (e) shows the boundary of a stiff phantom inclusion and the paths used to calculate wave speed. Map of the coarse estimation of modulus is shown in (f) and the wave speed measurements shown in (g). (Figure reproduced from Ref. .)
Fig. 22
Fig. 22
FDML system demonstrating the ability to spatially and temporally capture a propagating mechanical wave in porcine cornea. (Figure adapted from Ref. —see movies related to these measurements in the same publication.)
Fig. 23
Fig. 23
Summary of common scan protocols reported in OCE.
Fig. 24
Fig. 24
(a) Schematic demonstrating noncontact system using AμT to analyze corneal biomechanics. (b) 3-D renderings of group velocity within the cornea demonstrate different elasticity at different IOP—top 10 mm Hg and bottom 40 mm Hg. (Figure reproduced from Ref. .)
Fig. 25
Fig. 25
(a) Phase velocity as a function of frequency measured with OCE in a region of pig cornea for different values of the IOP. (b) Surface displacement of the cornea in the same cornea regions for a known mechanical force delivered with AμT at different IOP. (Figure reproduced from Ref. .)

Similar articles

Cited by

References

    1. Schmitt J., “OCT elastography: imaging microscopic deformation and strain of tissue,” Opt. Express 3, 199–211 (1998).OPEXFF10.1364/OE.3.000199 - DOI - PubMed
    1. Kotecha A., “What biomechanical properties of the cornea are relevant for the clinician?” Surv. Ophthalmol. 52, S109–S114 (2007).SUOPAD10.1016/j.survophthal.2007.08.004 - DOI - PubMed
    1. Girard M. J. A., et al. , “Translating ocular biomechanics into clinical practice: current state and future prospects,” Curr. Eye Res. 40, 1–18 (2015).10.3109/02713683.2014.914543 - DOI - PMC - PubMed
    1. Kling S., Hafezi F., “Corneal biomechanics: a review,” Ophthalmic Physiol. Opt. 37, 240–252 (2017).OPOPD510.1111/opo.12345 - DOI - PubMed
    1. Ahearne M., et al. , “An indentation technique to characterize the mechanical and viscoelastic properties of human and porcine corneas,” Ann. Biomed. Eng. 35, 1608–1616 (2007).ABMECF10.1007/s10439-007-9323-9 - DOI - PubMed

Publication types