. 2018 Jan 25;172(3):500-516.e16.
doi: 10.1016/j.cell.2017.11.042. Epub 2017 Dec 21.

Microbiome Influences Prenatal and Adult Microglia in a Sex-Specific Manner

Affiliations

Microbiome Influences Prenatal and Adult Microglia in a Sex-Specific Manner

Morgane Sonia Thion et al. Cell. .

Abstract

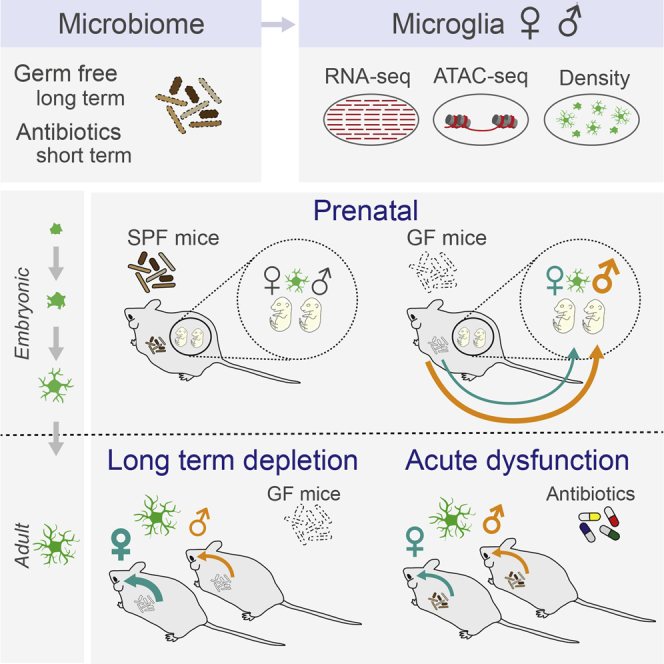
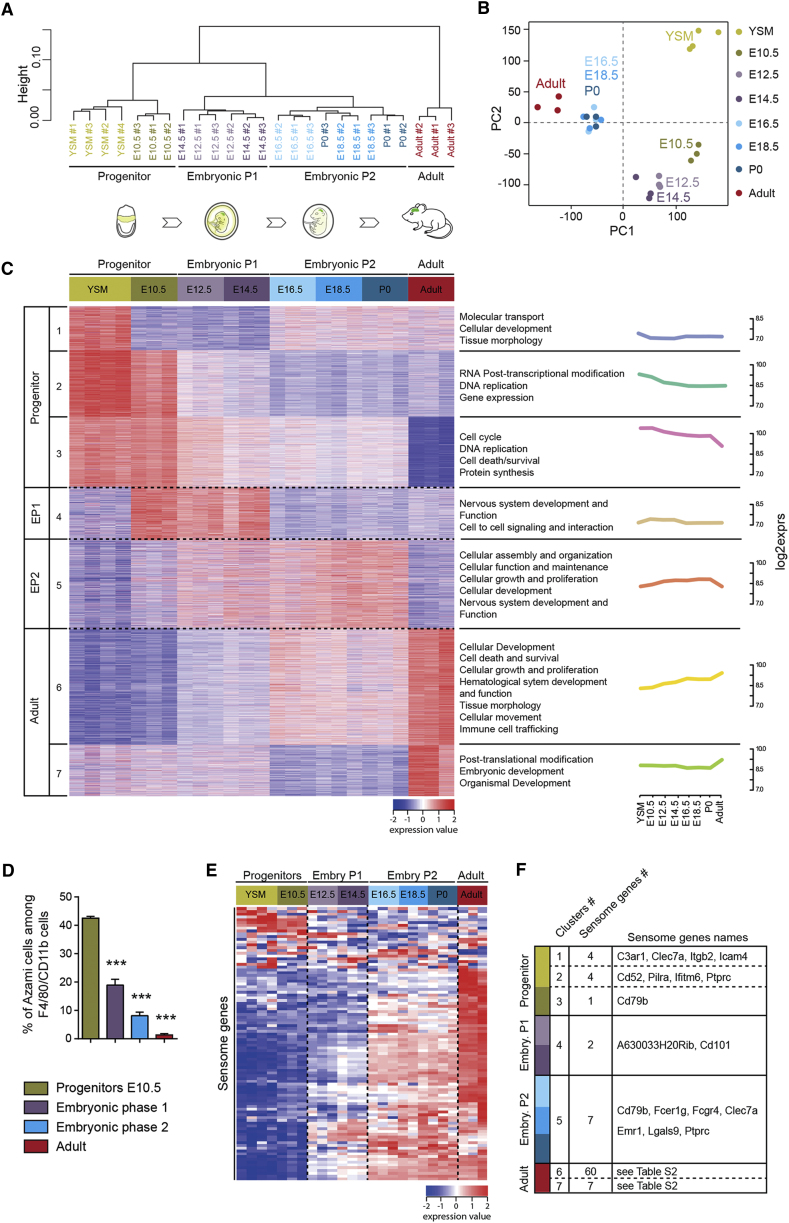
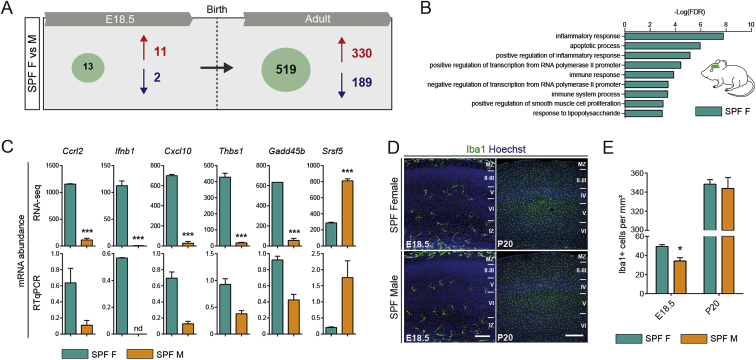
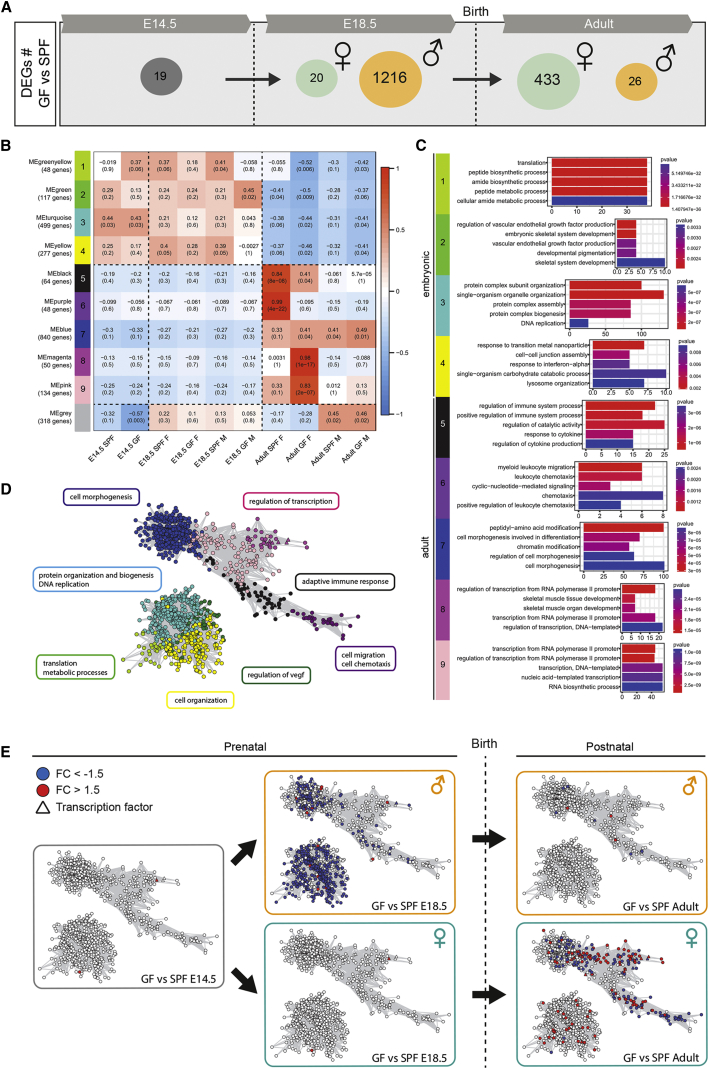
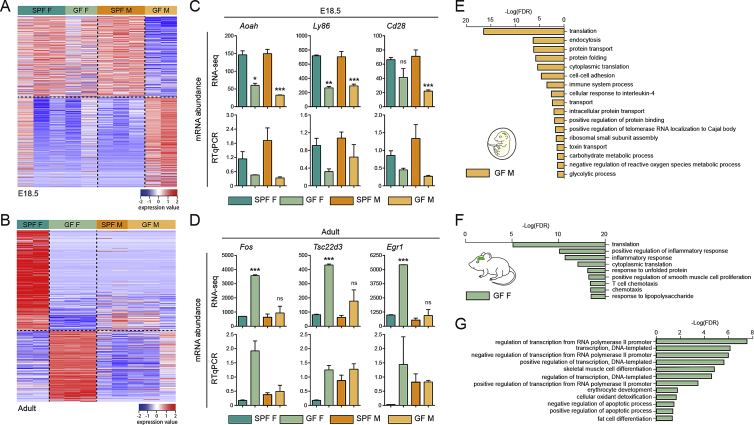
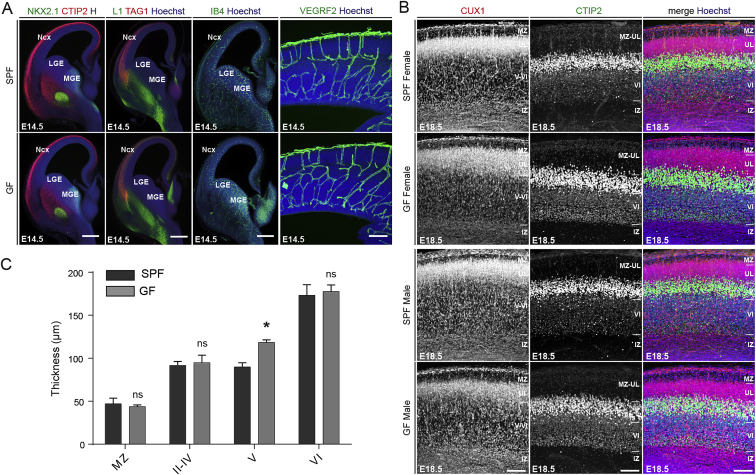
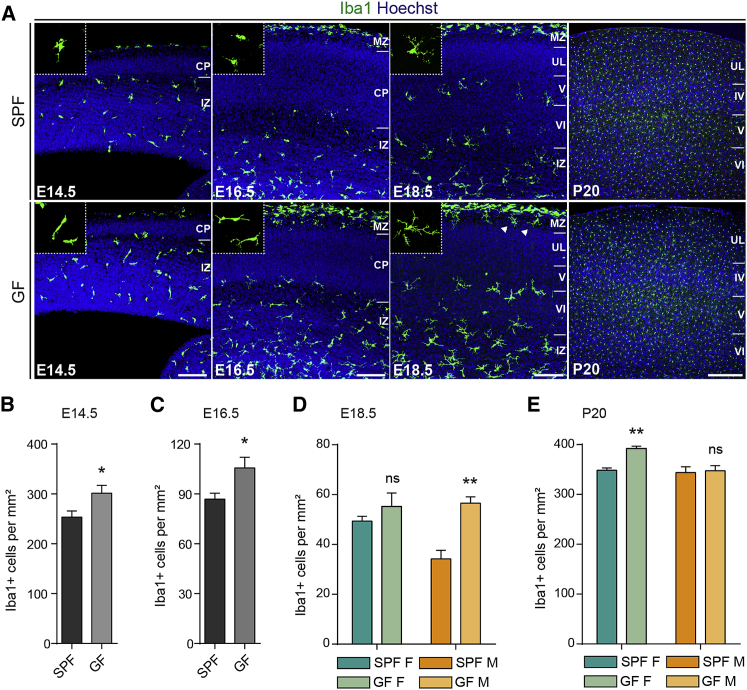
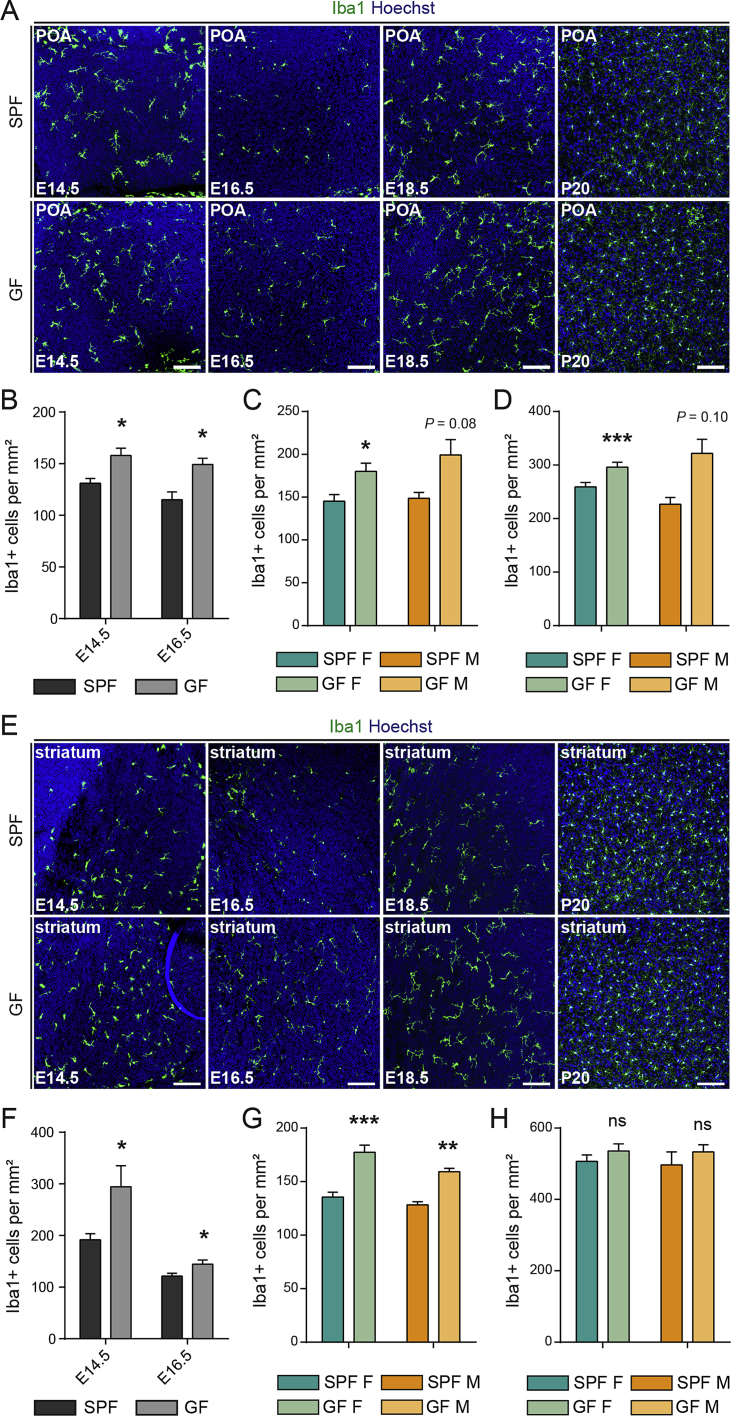
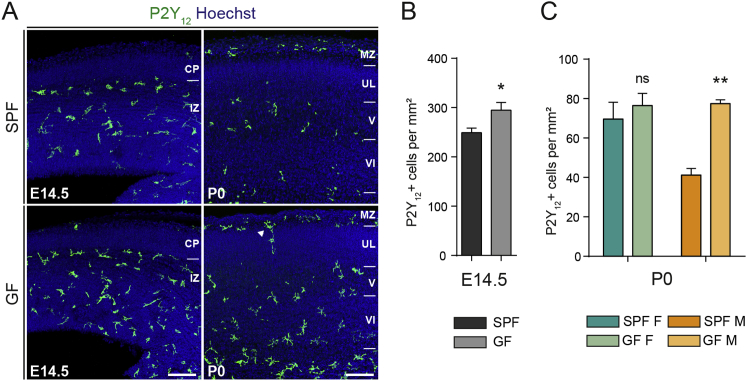
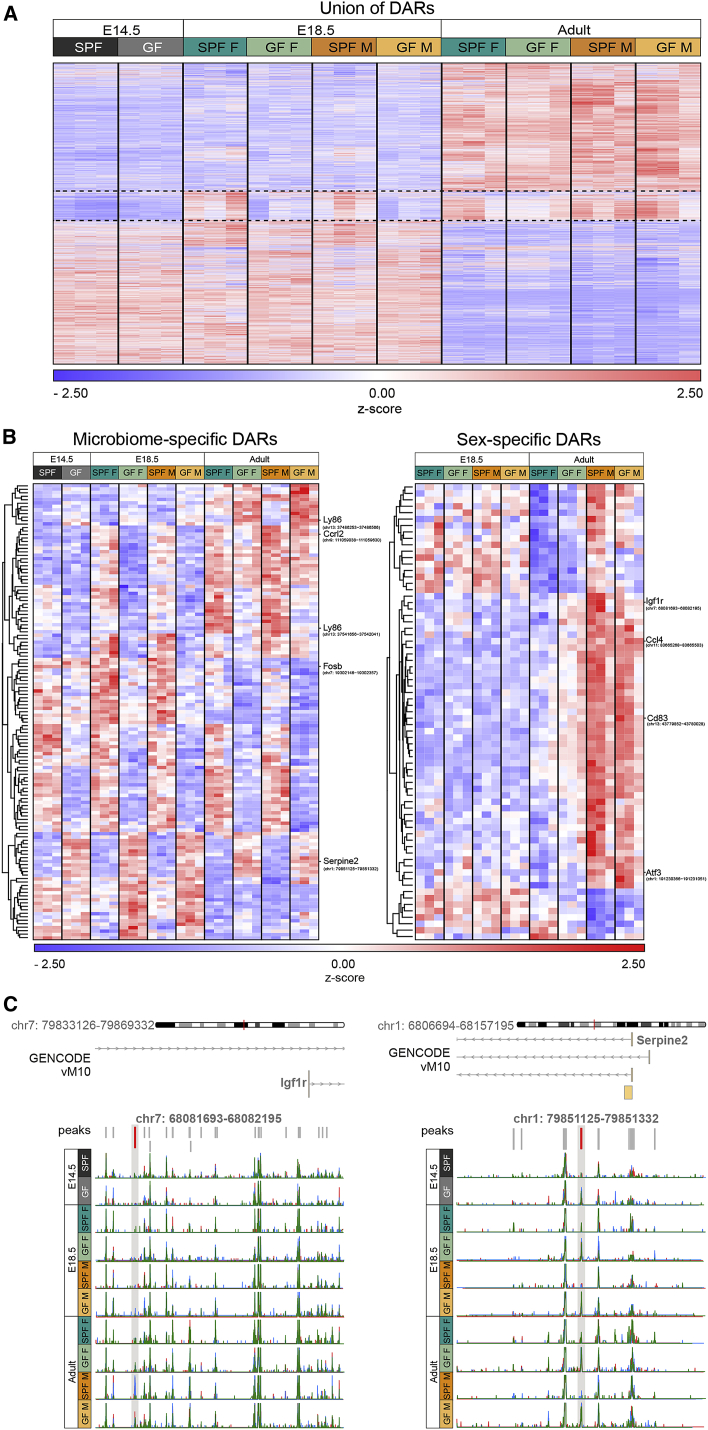
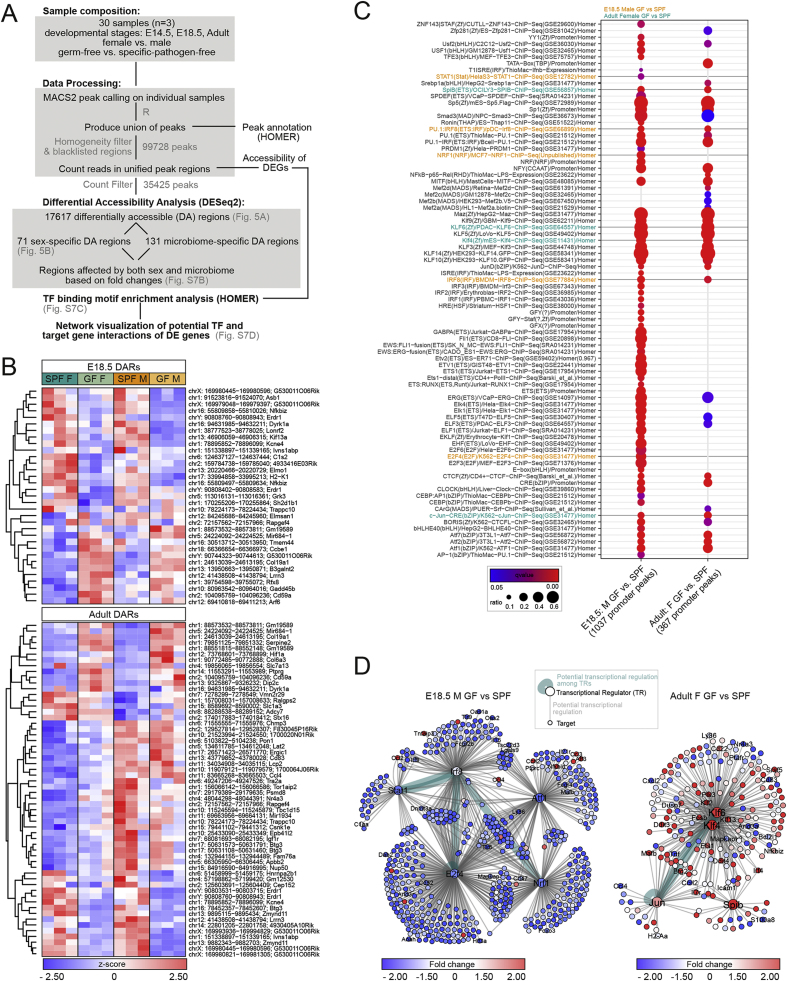
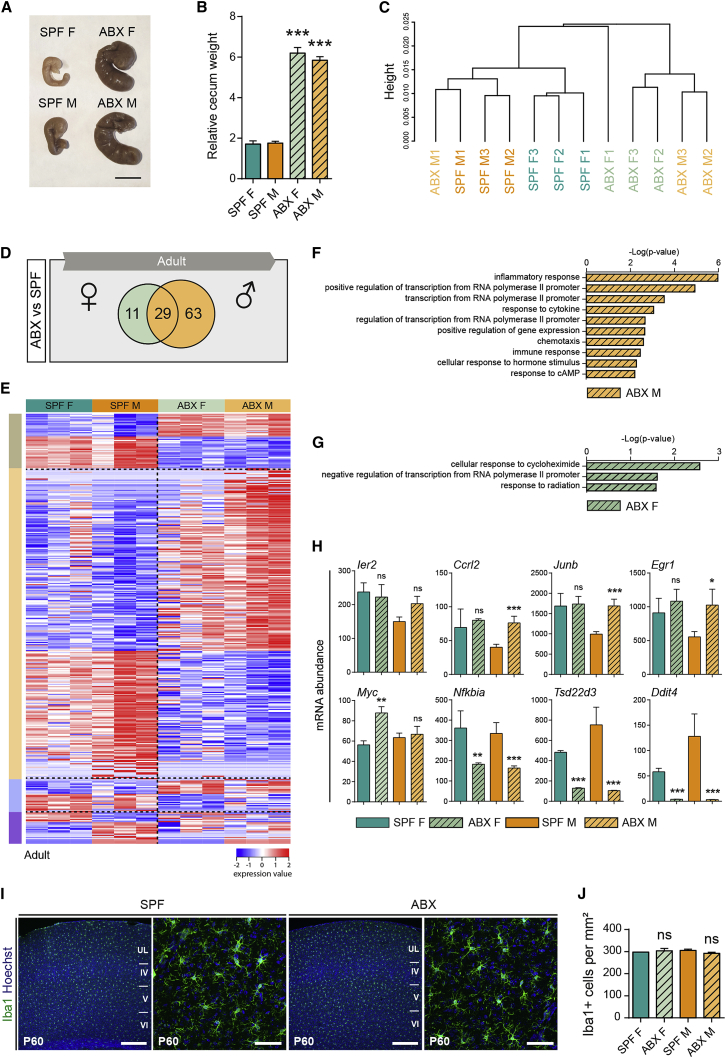
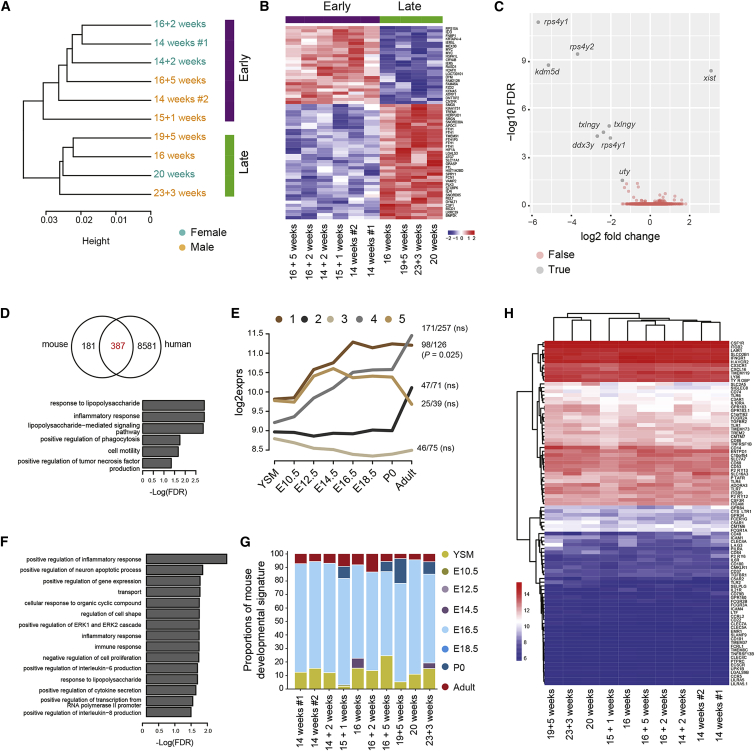
Microglia are embryonically seeded macrophages that contribute to brain development, homeostasis, and pathologies. It is thus essential to decipher how microglial properties are temporally regulated by intrinsic and extrinsic factors, such as sexual identity and the microbiome. Here, we found that microglia undergo differentiation phases, discernable by transcriptomic signatures and chromatin accessibility landscapes, which can diverge in adult males and females. Remarkably, the absence of microbiome in germ-free mice had a time and sexually dimorphic impact both prenatally and postnatally: microglia were more profoundly perturbed in male embryos and female adults. Antibiotic treatment of adult mice triggered sexually biased microglial responses revealing both acute and long-term effects of microbiota depletion. Finally, human fetal microglia exhibited significant overlap with the murine transcriptomic signature. Our study shows that microglia respond to environmental challenges in a sex- and time-dependent manner from prenatal stages, with major implications for our understanding of microglial contributions to health and disease.

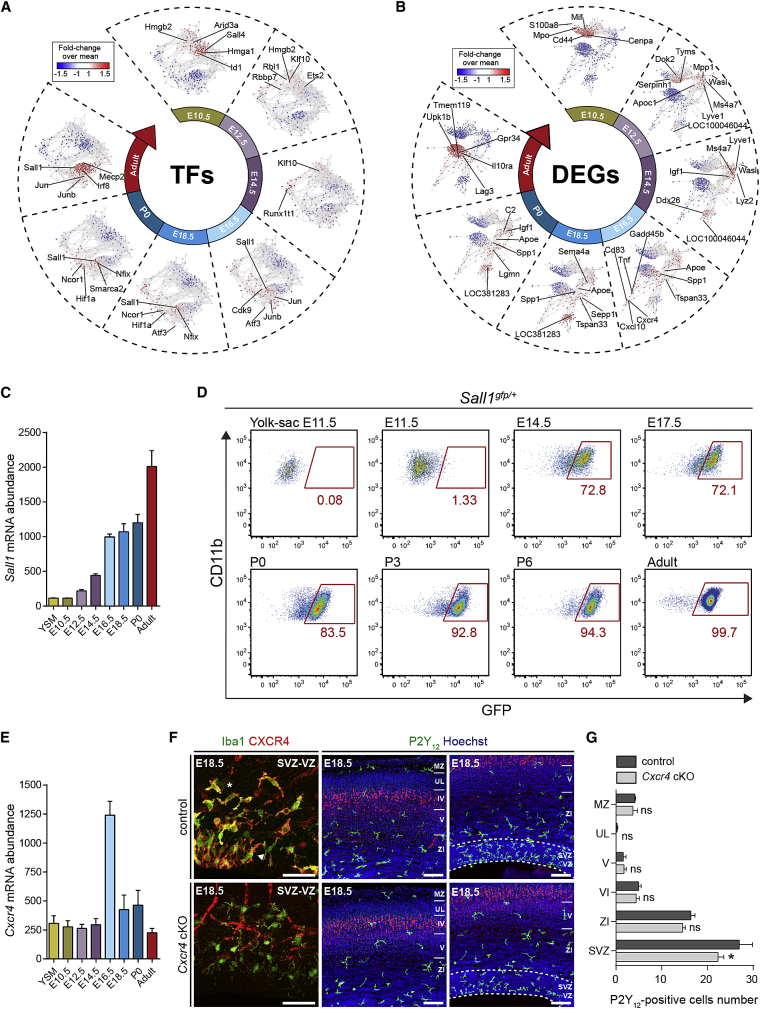
Keywords: CXCR4; antibiotics; embryogenesis; germ-free; microbiome; microglia; neurodevelopmental disorders; neuroinflammation; prenatal; sex.


Figures

None
Graphical abstract
Figure 1
Figure 1
Microglia Undergo Distinct Developmental Phases (A and B) Dendrogram (A) and PCA (B) on transcriptomes of murine YS progenitors and microglia at different developmental stages. n = 3–4 replicates per stage, with each replicate obtained by pooling microglia sorted from several female and male brains. PC, principal component. (C) Heatmap of the DEGs with clusters (left), associated signaling pathways (right), and corresponding expression plots. Each row is a biological replicate. (D) Percentages of Azami green+ cells (S/G2/M cell-cycle phases) among F4/80/CD11b-positive cells from brains of FUCCI mice. Data are represented as means ± SEM; n = 3–5 per stage; one-way ANOVA with Tukey post hoc test was used to assess differences; ∗∗∗p < 0.001. (E) Heatmap of the expression level of microglia sensome genes. (F) Microglial sensome gene expression in the different developmental clusters. Embryo P, embryonic phase. See also Figures 2, S1, and Table S1.
Figure S1
Figure S1
Microglial Changes during Development, Related to Figure 1 (A) Gating strategy for flow cytometry purification of CD45low, CD11b+, F4/80+, CD64+, Ly6C- yolk-sac progenitors and microglia. (B) Gating strategy of flow cytometric analysis of cells from FUCCI mice showing CD45low, CD11b+, F4/80+, and Azami green+ cells. (C) The seven clusters characterizing the different developmental phases of microglia. The plots show the expression of the corresponding genes that are associated with these functions during development. Clusters 1, 2 and 3 are related to the progenitor phase, cluster 4 to embryonic phase 1, cluster 5 to embryonic phase 2 and clusters 6 and 7 to the adult stage. See also Table S1.
Figure 2
Figure 2
Regulation of Microglial Gene Expression during Development and the Impact of CXCR4 on Microglial Brain Colonization (A and B) Visualization of co-expression networks analysis (CENA) based on the expression of 431 transcription factors (TFs) (A) and on the expression of DEGs (B) (n = 3–4 biological replicates per stage; −1.5 < fold-change < 1.5 and false discovery rate [FDR]-corrected p value < 0.05). Expression differences relative to the overall mean are shown by node color on the CENA network. (C) Sall1 mRNA levels abundance from microarray dataset. (D) Flow cytometry analysis of GFP+ cells in Sall1gfp/+ mice within microglia (CD45+Ly6CLy6GF4/80+CD11b+). n = 6–11 per stage. (E) Cxcr4 mRNA levels abundance from microarray dataset. (F) E18.5 coronal sections of the somatosensory neocortex showing Iba1 expression, P2Y12 and CTIP2 immunostainings in controls, and CXCR4 downregulation in Cxcr4 cKO mice. Scale bars, 50 μm (left) or 100 μm (right). (G) Number of P2Y12-positive cells in the somatosensory cortex of control and cxcr4 cKO mice. n = 3–4 mice per condition. Data are represented as means ± SEM; two-way ANOVA with Sidak post hoc test was performed to assess differences at each stage. p < 0.05. See also Figures 1, S1, and Table S1.
Figure S2
Figure S2
Microglia Progressively Acquire a Sex-Linked Transcriptomic Signature, Related to Figure 3 (A) Number of genes showing at least a 1.5-fold difference in expression level between microglia from SPF female and SPF male mice at E18.5 or in adults. n = 2-3 per stage and condition. (B) Signaling pathways analysis of the DEGs showing at least 1.5-fold greater expression in microglia from SPF females compared to SPF males at E18.5. FDR, False Discovery Rate. (C) RNA-seq and RTqPCR validation of expression data for six DEGs showing at least 1.5-fold difference in expression level in microglia from adult SPF females and SPF males. n = 2-3 per condition. (D) Coronal sections of the somatosensory cortex from E18.5 and adult mice showing Iba1 expressing microglia in SPF female and SPF male (representative of 6 samples per condition). Scale bar E18.5 = 100 μm; scale bar P20 = 300 μm. (E) Microglial density in the somatosensory cortex of male and female mice at E18.5 and in adults. Two-sided unpaired Mann-Whitney test was performed to assess differences at each stage. n = 6 per condition. For all panels, data are represented as means ± SEM. ∗∗∗ p < 0.001, p < 0.05, nd, not determined. Similar to Figures 4D and 4E. See also Tables S2 and S3.
Figure 3
Figure 3
Absence of Microbiota Has a Sex- and Time-Specific Impact on Microglial Transcriptomic Profiles (A) Number of DEGs showing a 1.5-fold difference in expression level between microglia from SPF and GF mice at E18.5 and in adults. n = 2–3 replicates per condition and stage, with embryonic replicate obtained by pooling microglia from 3–7 brains. (B) Module-trait correlation analysis. Each row represents a module eigengene (ME) and each column a trait. Corresponding correlation (top) and p values (bottom) are indicated for each cell. (C) GO terms associated with each module, ranked by p value with top 5 processes listed. (D) Graphic representation (Cytoscape) of the co-expression network is based on all genes in weighted gene co-expression network analysis (WGCNA) having a topological overlap with at least one other gene of at least 0.3. Clusters with fewer than 5 nodes were excluded. Nodes are colored according to module membership. (E) Differential gene expression levels of microglia from GF and SPF brains within the gene co-expression network. Blue and red nodes represent DEGs with a fold-change (FC) <1.5 or >1.5, respectively. See also Figures S2, S3, and Table S2.
Figure S3
Figure S3
Absence of Microbiota Has Sex- and Stage-Specific Impacts on the Microglial Transcriptome, Related to Figure 3 (A) Heatmap of differentially-expressed genes (DEGs) in microglia between E18.5 GF male and SPF male mice. SPF female and GF female microglial gene expression is also depicted. Each row represents a biological replicate; n = 2-3 replicates per condition. (B) Heatmap of DEGs in between microglia from adult GF females and SPF females. Gene expression in microglia from SPF males and GF males is also depicted. Each row represents a biological replicate; n = 2-3 replicates per condition. (C) RNA-seq and RTqPCR validation of expression data for three DEGs showing a 1.5-fold difference in expression between microglia from E18.5 GF males versus SPF males, or E18.5 GF females versus SPF females. n = 2-3 replicates per condition. (D) RNA-seq and RTqPCR validation of expression data for three DEGs showing a 1.5-fold greater level of expression in microglia from adult GF females compared to SPF females. n = 2-3 replicates per condition. (E) Signaling pathways analysis of the DEGs showing at least 1.5-fold lower expression in microglia from GF male compared to SPF male at E18.5. FDR, False Discovery Rate. (F) Signaling pathways analysis of the DEGs showing at least 1.5-fold lower expression level in microglia from adult GF females compared to SPF females. FDR, False Discovery Rate. (G) Signaling pathways analysis of the DEGs showing at least 1.5-fold higher expression level in microglia from adult GF females compared to SPF females. FDR, False Discovery Rate. For all panels, data are represented as means ± SEM; p < 0.05, ∗∗∗p < 0.001; ns, not significant. See also Tables S2 and S3.
Figure S4
Figure S4
Brain Patterning and Cortical Layering in GF Mice, Related to Figure 4 (A) Coronal sections of brains from SPF and GF mice showing NKX2.1, CTIP2, L1, IB4, VEGFR and TAG1 immunofluorescences at E14.5. Scale bars low magnification = 500 μm; scale bar high magnification = 100 μm. n = 3-4 replicates by conditions. (B) Coronal sections of the somatosensory cortex of brains from SPF and GF male and female mice, showing CUX1-positive layer II-III-IV and CTIP2-positive layer V immunofluorescence at E18.5. Scale bars = 100 μm. (C) Measurement of cortical layer thickness at E18.5 in brains from SPF and GF mice. n = 4 replicates by conditions and sex. Data are represented as means ± SEM; Two-way ANOVA with Sidak post hoc test was performed to assess differences at each stage; p < 0.05, ns, not significant.
Figure 4
Figure 4
The Absence of Microbiota Has a Sex- and Time-Specific Impact on Microglial Colonization of the Neocortex (A) Coronal sections of the somatosensory neocortex of SPF and GF mice showing Iba1+ cells. Scale bars 100 μm for E14.5–E18.5 and 300 μm for adults. (B–E) Density of Iba1+ cells in the somatosensory neocortex of SPF and GF mice at (B) E14.5 (n = 7–8), (C) E16.5 (n = 7–10), (D) E18.5 (n = 4–5), and (E) P20 (n = 3–6). Data are represented as means ± SEM. Two-sided unpaired Mann-Whitney test was performed to assess differences at E14.5 and E16.5, and two-way ANOVA with Sidak post hoc test was performed to assess differences at E18.5 and P20. p < 0.05, ∗∗p < 0.01, ns, not significant. Same SPF samples as in Figure S2. See also Figures S4, S5, and S6.
Figure S5
Figure S5
Colonization of Microglia in the Preoptic Area and Striatum of Brains of GF Mice, Related to Figure 4 (A) Coronal sections of the preoptic area (POA) of brains from SPF and GF mice at different stages of development (E14.5, E16.5, E18.5 and P20) showing Iba1 immunohistochemistry. Scale bars = 100 μm. (B) Density of Iba1-positive cells in the POA of brains from SPF and GF mice at E14.5 and E16.5. n = 7-11 per stage and condition. (C) Density of Iba1-positive cells in the POA of brains from female and male mice under SPF or GF conditions at E18.5. n = 4-5 per stage and condition. (D) Density of Iba1-positive cells in the POA of brains from female and male mice under SPF or GF conditions at P20. n = 3-7 per stage and condition. (E) Iba1 labeling of coronal sections of the striatum of brains from SPF and GF mice at different stages of development (E14.5, E16.5, E18.5 and P20). Scale bars = 100 μm. (F) Density of Iba1-positive cells in the striatum of brains from SPF and GF mice at E14.5 and E16.5. n = 7-11 per stage and condition. (G) Density of Iba1-positive cells in the striatum of brains from female and male mice under SPF or GF conditions at E18.5. n = 4-5 per stage and condition. (H) Density of Iba1-positive cells in the striatum of brains from female and male mice under SPF or GF conditions at P20. n = 3-6 per stage and condition. Data are represented as means ± SEM. Two-sided unpaired Mann-Whitney test was performed to assess differences at E14.5 and E16.5 and Two-way ANOVA with Sidak post hoc test was performed to assess differences at E18.5 and P20; p < 0.05, ∗∗p < 0.01, ∗∗∗p < 0.001, ns, not significant.
Figure S6
Figure S6
Absence of Microbiota Has a Sex-Specific Impact on Microglial Colonization of the Neocortex, Related to Figure 4 (A) Coronal sections of the somatosensory neocortex of SPF and GF mice at different stages of development (E14.5 and P0) showing P2Y12-positive microglia. Scale bars E14.5-E18.5 = 100 μm. (B) Density of P2Y12-positive cells in the somatosensory neocortex of SPF and GF mice at E14.5. n = 7-8 per condition. (C) Density of P2Y12-positive cells in the cortical plate of the somatosensory neocortex of female and male SPF and GF mice at P0. n = 4 per stage and condition. Data are represented as means ± SEM. Two-sided unpaired Mann-Whitney test was performed to assess differences at E14.5 and Two-way ANOVA with Sidak post hoc test was performed to assess differences at P0; p < 0.05, ∗∗p < 0.01, ns, not significant.
Figure 5
Figure 5
ATAC-Seq Reveals Temporal Changes in Chromatin Accessibility in the Absence of the Microbiome (A) Heatmap showing the hierarchical clustering of all DARs (FDR <0.1, #17,617) colored according to z-transformed read counts (cpm) from blue (low count) to red (high count), in microglia from SPF and GF mice. Each row is a biological replicate, with each replicate obtained by pooling microglia from 1–3 brains. (B) Heatmaps showing the hierarchical clustering of microbiome- or sex-specific DARs (FDR <0.1) colored as in (A). Each row is a biological replicate. (C) Normalized ATAC-seq read coverage of two representative loci. Displayed gene models are taken from the GENCODE vM10 annotation. The DAR of interest is highlighted in red. Blue, green, and red lines indicate the three samples from one group. See also Figure S7 and Table S4.
Figure S7
Figure S7
ATAC-Seq Reveals Temporal Changes in Chromatin Accessibility of Germ-Free Mice, Related to Figure 5 (A) Schema illustrating the workflow of the bioinformatics ATAC-seq analysis in microglia from SPF and GF mice at E14.5, E18.5 and in adult. (B) Heatmap showing the hierarchical clustering of the DARs (FDR < 0.1) affected by both sex and microbiome with a FC of at least 1.5 due to both factors, colored according to z-transformed read counts (cpm) from blue (low count) to red (high count) in microglia from SPF and GF mice at E18.5 and in adult. n = 3 replicates per condition and stage, with each replicate obtained by pooling microglia from 1 to 3 brains. (C) Dot plot showing significantly enriched transcription factor binding motifs (q-value < 0.05) in the ATAC-seq peak sequences found in promoter regions of the indicated sets of DEGs. Dot size indicates the ratio of sequences featuring the respective motif to the total number of tested sequences, and dot color illustrates the q-value of the enrichment. Green motifs correspond to transcription factors differentially expressed between GF and SPF male microglia at E18.5 and orange motifs to transcription factors differentially expressed between GF and SPF female adult microglia. (D) Network visualization of differentially-expressed transcription factors corresponding to enriched binding motifs and their potential target genes among the DEGs between E18.5 male GF and SPF (left panel) and adult female GF and SPF (right panel). Grey edges indicate a potential regulation of the target gene by the transcription factor and turquoise edges present potential regulation between transcription factors. Nodes are colored according to their FC of the indicated comparison. See also Tables S4 and S5.
Figure 6
Figure 6
Acute Antibiotic Treatment Induces Mild Sexually Biased Transcriptomic Modifications (A and B) Representative images of cecum from control and ABX adult mice (A) and their weight (adjusted for body weight) (B). One-way ANOVA with Tukey post hoc test was used to assess differences. ∗∗∗p < 0.001. n = 12 mice per condition and sex. (C) Dendrogram illustrating hierarchical clustering of microglial transcriptomes from control and ABX adult mice. n = 3 biological replicates per condition and sex, each replicate containing microglia from 3 brains. (D) Number of genes showing at least a 1.5-fold difference in expression level between microglia from females and males of control and ABX mice. n = 3 biological replicates per condition and sex. (E) Heatmap of DEGs in adult microglia from ABX and SPF males. Color codes on the left highlight DEGs different across conditions (brown SPF/ABX; beige males SPF/ABX; blue females SPF/ABX; purple SPF female/male). Each row is a biological replicate, n = 3 replicates per condition and sex. (F and G) Signaling pathways analysis of the DEGs showing at least 1.5-fold lower expression level in microglia from males ABX versus male controls (F) and from females ABX versus female controls (G). (H) mRNA levels abundance for some representative DEGs from RNA-seq dataset. n = 3 per condition and sex. (I and J) Coronal sections of the somatosensory neocortex of P60 control and ABX-treated mice showing Iba1+ microglia (I) and quantification of their density in the cortical plate (J). Scale bars low magnification, 300 μm; scale bars high magnification, 50 μm. n = 3 mice per stage and condition. Two-sided unpaired Mann-Whitney test was performed to assess differences. ns, not significant. Data are represented as means ± SEM. See also Table S6.
Figure 7
Figure 7
Human Mid-gestation Fetal Microglia Share Features of Murine Fetal Microglia (A) Dendrogram illustrating hierarchical clustering of human fetal microglia transcriptomes. n = 10. (B) Heatmap of DEGs between microglia from early and late mid-gestation fetal clusters. Each row is a biological replicate. (C) Volcano plot of DEGs between microglia from male and female fetuses. n = 10. (D) Venn diagram of murine microglial core genes and genes expressed in all human samples with GO enrichment of the 387 common DEGs. FDR, false discovery rate. (E) Enrichment of mouse-human common signature genes in the five clusters of mouse core signatures. (F) GO enrichment by cluster 1 of mouse core signature. FDR, false discovery rate. (G) CIBERSORT analysis of human microglia with mouse developmental signatures. (H) Heatmap of the expression of sensome genes in human fetal microglia. Each row is a biological replicate; n = 10. See also Table S7.

Comment in

  • Sex, Gut, and Microglia.
    Louveau A, Kipnis J. Louveau A, et al. Dev Cell. 2018 Jan 22;44(2):137-138. doi: 10.1016/j.devcel.2018.01.003. Dev Cell. 2018. PMID: 29401417

References

    1. Arnò B., Grassivaro F., Rossi C., Bergamaschi A., Castiglioni V., Furlan R., Greter M., Favaro R., Comi G., Becher B. Neural progenitor cells orchestrate microglia migration and positioning into the developing cortex. Nat. Commun. 2014;5:5611. - PubMed
    1. Beaume M., Hernandez D., Docquier M., Delucinge-Vivier C., Descombes P., François P. Orientation and expression of methicillin-resistant Staphylococcus aureus small RNAs by direct multiplexed measurements using the nCounter of NanoString technology. J. Microbiol. Methods. 2011;84:327–334. - PubMed
    1. Bibikova M., Barnes B., Tsan C., Ho V., Klotzle B., Le J.M., Delano D., Zhang L., Schroth G.P., Gunderson K.L. High density DNA methylation array with single CpG site resolution. Genomics. 2011;98:288–295. - PubMed
    1. Braniste V., Al-Asmakh M., Kowal C., Anuar F., Abbaspour A., Tóth M., Korecka A., Bakocevic N., Ng L.G., Kundu P. The gut microbiota influences blood-brain barrier permeability in mice. Sci. Transl. Med. 2014;6:263ra158. - PMC - PubMed
    1. Buenrostro J.D., Giresi P.G., Zaba L.C., Chang H.Y., Greenleaf W.J. Transposition of native chromatin for fast and sensitive epigenomic profiling of open chromatin, DNA-binding proteins and nucleosome position. Nat. Methods. 2013;10:1213–1218. - PMC - PubMed

Publication types