. 2018 Jan 25;172(3):549-563.e16.
doi: 10.1016/j.cell.2017.11.043. Epub 2017 Dec 21.

Antigen Identification for Orphan T Cell Receptors Expressed on Tumor-Infiltrating Lymphocytes

Affiliations

Antigen Identification for Orphan T Cell Receptors Expressed on Tumor-Infiltrating Lymphocytes

Marvin H Gee et al. Cell. .

Abstract

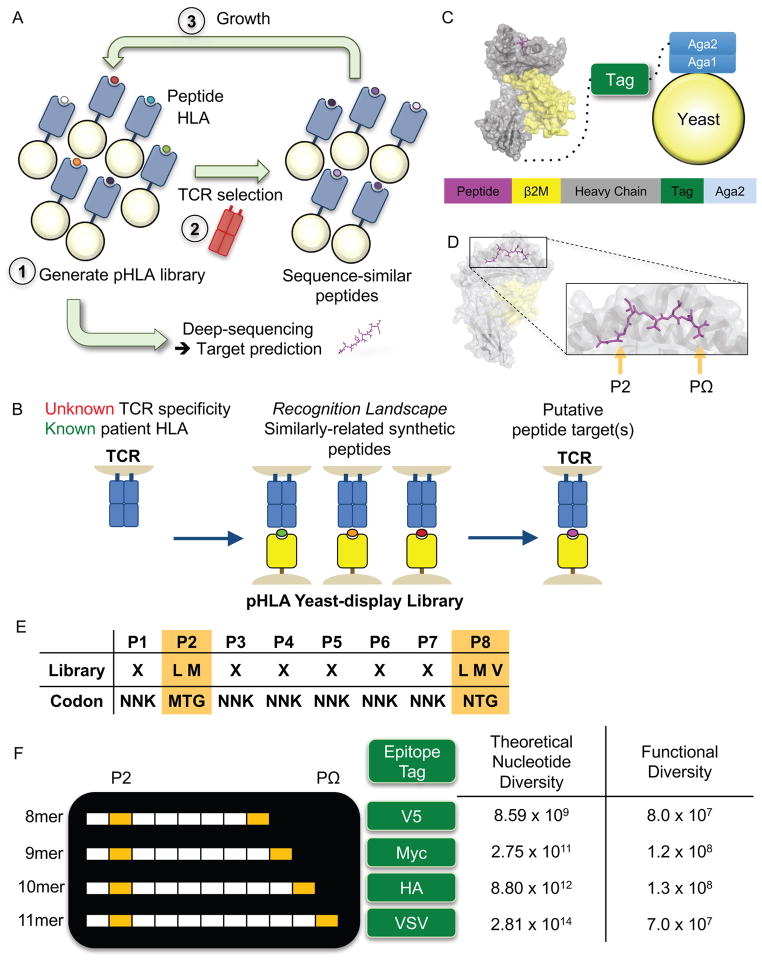
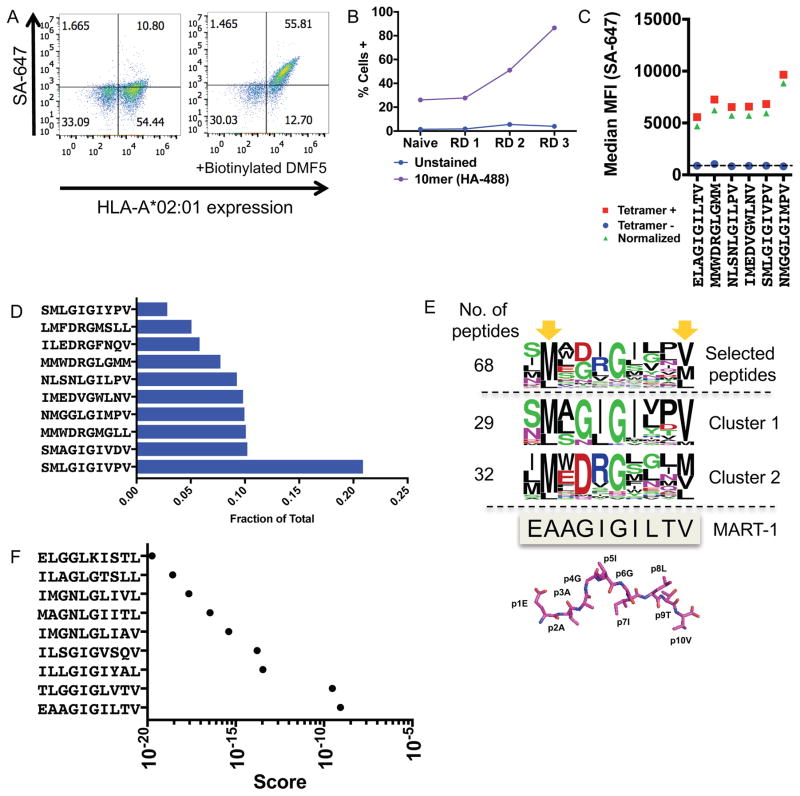
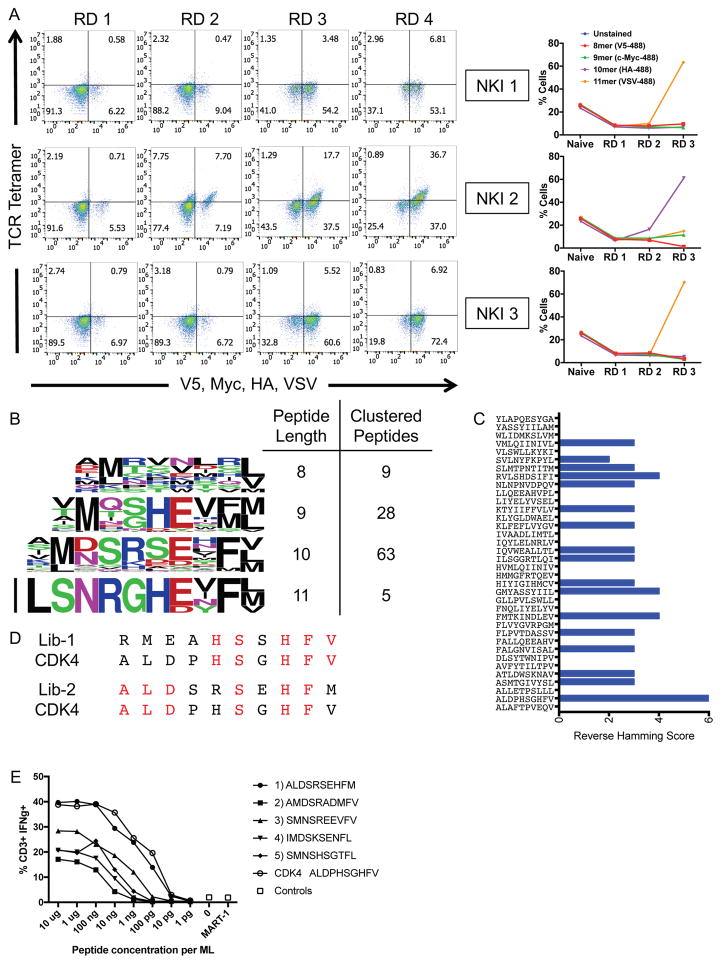
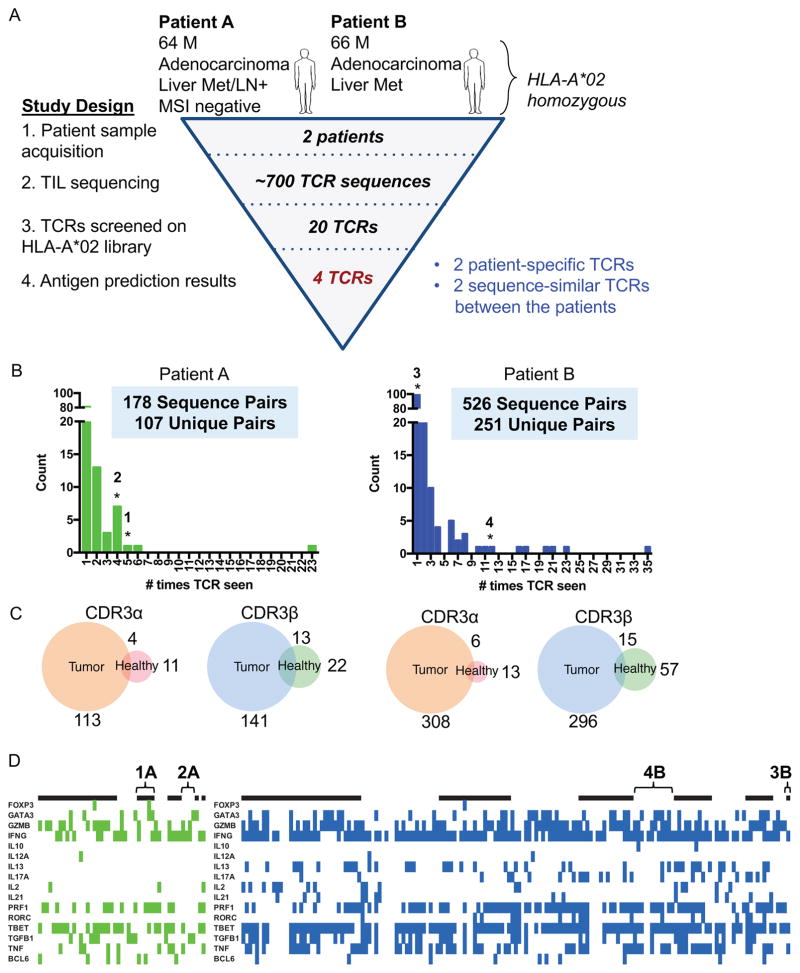
The immune system can mount T cell responses against tumors; however, the antigen specificities of tumor-infiltrating lymphocytes (TILs) are not well understood. We used yeast-display libraries of peptide-human leukocyte antigen (pHLA) to screen for antigens of "orphan" T cell receptors (TCRs) expressed on TILs from human colorectal adenocarcinoma. Four TIL-derived TCRs exhibited strong selection for peptides presented in a highly diverse pHLA-A02:01 library. Three of the TIL TCRs were specific for non-mutated self-antigens, two of which were present in separate patient tumors, and shared specificity for a non-mutated self-antigen derived from U2AF2. These results show that the exposed recognition surface of MHC-bound peptides accessible to the TCR contains sufficient structural information to enable the reconstruction of sequences of peptide targets for pathogenic TCRs of unknown specificity. This finding underscores the surprising specificity of TCRs for their cognate antigens and enables the facile indentification of tumor antigens through unbiased screening.

Keywords: T cell; T cell receptor; antigens; cancer; combinatorial biology; human leukocyte antigen; ligand identification; peptide library; peptides; single-cell sequencing.


Figures

Figure 1
Figure 1
Design of the peptide-HLA-A*02:01 yeast-display library. (A) Methodology for selecting a yeast-display library of pHLA. Each yeast displays a unique peptide that is genetically encoded. A typical library contains ~108 unique peptides, which is selected by a TCR of interest. Yeast are enriched in an affinity-based selection using bead-multimerized TCR and grown for iterative rounds of selection. Peptides are successively enriched and all yeast DNA is deep-sequenced. These synthetic peptide sequences are used to generate a model to make predictions for TCR ligands derived from the human proteome and/or patient-specific exome. (B) The goal of the study is to use the yeast-display selection to de-orphanize a TCR of unknown antigen specificity. The peptides selected by a TCR from the yeast-display selection generates a recognition landscape for a particular TCR, which is then used to make predictions of antigen specificity for orphan TCRs. Predicted targets can be validated in a T cell stimulation assay. (C) The construct utilizes a single-chain design to display the pHLA-A*02:01 complex tethered to an epitope tag and Aga2p, which binds to the native Aga1 protein on yeast. Each component is connected covalently by a Gly-Ser linker. The epitope tag is introduced to monitor expression of the library. (D) The MART-1/HLA-A*02 complex structure (PDB 4L3E) highlighting the two peptide anchors with orange arrows. These peptide positions at P2 and PΩ of the peptide allow for peptide binding to HLA-A*02. (E) An example 8mer peptide library shows the anchor preferences for the HLA-A*02:01 library and the remaining positions that are randomized to any of the twenty amino acids (X = twenty amino acids and stop codon). Nucleotide abbreviations for codon usage are listed according to the IUPAC nucleotide code. (F) A multi-length library designed to capture the most common length peptides presented by HLA-A*02:01. Each peptide length is placed in a construct using a unique epitope tag for selection monitoring. The libraries have theoretical nucleotide diversities dictated by the peptide length and library composition. The functional diversity represents the true capacity of the physical libraries based on yeast colony counting after limiting dilution of the library.
Figure 2
Figure 2
Validation of the HLA-A*02:01 library with the DMF5 TCR (A) The DMF5 TCR stains yeast displaying the MART-1 peptide (ELAGIGILTV) in complex with HLA-A*02:01 on the surface of yeast. Streptavidin-647 (SA-647) was used to tetramerize and fluorescently label the DMF5 TCR. (B) Enrichment of the 10mer length HLA-A*02:01 yeast-display library by the DMF5 TCR as measured by anti-HA epitope tag staining by flow cytometry. Three of four rounds of selection shown. (C) Highly-enriched peptides sequenced from the 10mer selection by the DMF5 TCR are stained by the DMF5 TCR tetramer and measured by flow cytometry. (D) The fraction of total sequencing read counts of the top 10 peptides according to deep sequencing of round 3 of the 10mer HLA-A*02:01 library selections by the DMF5 TCR. (E) Unique peptides from round 3 of selection fall into two major clusters that appear similar to the wildtype MART-1 peptide sequence. Clusters are determined by first calculating reverse hamming distance between all peptides present in round 3 of the selection and then clustered by score. The MART-1 decamer structure (PDB: 4L3E) is aligned to the selected peptides. (F) A substitution matrix (2014PWM) using cluster 1 peptides predicts the MART-1 peptide as the most probable peptide to bind the DMF5 TCR among eight other predicted peptides. See also Figure S1 and Table S1.
Figure 3
Figure 3
Blinded validation of the HLA-A*02:01 library by neoantigen-specific TCRs. (A) Three TCRs of blinded specificity separately enrich the HLA-A*02:01 library for a specific peptide length according to epitope tag staining over the rounds of selection. The left panels indicate tetramer and epitope staining after all 4 rounds of selection have completed and the right panels indicate epitope staining through the course of selections. (B) Unique peptides selected by NKI 2 in round 3 of the selection are parsed by peptide length and clustered by reverse hamming distance. The number of peptides identified in the cluster are shown on the right along with the respective peptide lengths. (C) The maximum reverse hamming distance computed between every 10mer of the selected peptides by NKI 2 at round 3 and each 10mer neoantigen peptide from the list of 127 total neoantigens. (D) Two peptides Lib-1 and Lib-2 from the selected library closely resemble the 10mer neoantigen peptide ALDPHSGHFV derived from CDK4. Identical amino acids with the neoantigen are colored in red. (E) The top 5 peptides of length 10 selected by the NKI 2 TCR were used to stimulate peripheral blood lymphocytes transduced with NKI2 TCR, which is specific for the CDK4 neoantigen ALDPHSGHFV. Transduced lymphocytes were mixed 1:1 with JY cells pulsed with peptide, control peptide, or no peptide, and IFNγ production as measured by intracellular antibody staining was assessed using flow cytometry. Related to Table S2.
Figure 4
Figure 4
Profiling TCRs identified in two HLA-A*02 patients with colorectal adenocarcinoma (A) Study design to de-orphanize patient-derived TCRs on the HLA-A*02:01 library with summarized results. (B) Bar graph of abundances of unique paired αβ TCR sequences from TILs. * = TCRs that enriched peptides from the library. (C) Venn diagrams representing the overlap of individual unique CDR3α or CDR3β chain sequences between tumor and healthy tissues for each patient. The number indicates the amount of CDR3 sequences in the nearest section of the Venn diagram. (D) Heatmaps identifying the binary measurement of transcription factors using sequencing of amplified and barcoded transcripts. The alternating black and white panels indicate boundaries of single T cell clones with the same receptor sequences, with the most abundance clones beginning from the left most side. The left panel identifies those T cells with TCRs chosen from Patient A to be screened and green denoting the presence of transcript. The right panel identifies those T cells with TCRs chosen from Patient B to be screened and blue denoting the presence of transcript. White indicates lack of transcript detected. TCRs 1A, 2A, 3B, and 4B are labeled. See also Figure S2, Table S3, and Table S4.
Figure 5
Figure 5
Four TIL-derived TCRs enrich the HLA-A*02:01 library for peptides. (A) TCR sequences of the four orphan TCRs that selected peptides from the HLA-A*02:01 library. The TCR gene segments variable and joining are shown along with the corresponding CDR3 sequence. The abundance represents the amount of times a single cell was found to have the exact TCR sequence in tumor/healthy tissue. (B) Nucleotide sequences of the two sequence-similar TCRs isolated from patients A and B. Non-encoded nucleotides are highlighted in red. (C) HLA enrichment and tetramer staining per round of selection by the four orphan TCRs as measured by flow cytometry. The left panels indicate tetramer and epitope staining after all 4 rounds of selection have completed and the right panels indicate epitope staining through the course of selections.
Figure 6
Figure 6
Deep-sequencing of the yeast selections by the four TIL TCRs. (A) Word logos display the unique round 3 selected peptides for each TCR not accounting for deep sequencing read count abundance. The size of the amino acid letter represents its proportional abundance at the given position among the unique peptides. (B) Heatmap plots showing the amino acid composition per position of the peptide accounting for peptide enrichment at round 3 of the selection. Darker colors indicate greater abundance of a given amino acid at a given position. Anchor residues are outlined in black. (C) TCRs 2A and 3B select an overlapping set of 11 peptides in round 3 of the selection shown as a fraction of total reads in round 3.
Figure 7
Figure 7
Activation of TIL-derived TCRs with predicted human targets and peptide mimotopes. TCRs are retrovirally infected into CD8+ SKW-3 cells and sorted for stable TCR (IP26) and CD3 (UCHT1) co-expression. T2 antigen-presenting cells are pulsed with 100 μM peptide for 3 hours, co-incubated with the T cell lines for 18 hours and analyzed for CD69 expression by flow cytometry. (A) TCR1A, (C) TCR2A, (E) TCR3B, and (G) TCR4B are tested for CD69 activation by peptide stimulation in technical triplicate with standard deviation shown. A representative experiment is shown from biological triplicate. (B), (D), (F), (H) A dose-response curve for each stimulatory peptide is shown on the right plotted with means of biological triplicates with standard error of the mean. For both experiments, p-values are calculated using ordinary one-way ANOVA. For TCRs 2A and 3B, 17 non-stimulating peptides are removed for simplicity (Table S6). See also Figure S3, Table S5, Table S6, Table S7, and Table S8.

Comment in

References

    1. Aakre CD, Herrou J, Phung TN, Perchuk BS, Crosson S, Laub MT. Evolving new protein-protein interaction specificity through promiscuous intermediates. Cell. 2015;163:594–606. - PMC - PubMed
    1. Abelin JG, Keskin DB, Sarkizova S, Hartigan CR, Zhang W, Sidney J, Stevens J, Lane W, Zhang GL, Eisenhaure TM, et al. Mass Spectrometry Profiling of HLA-Associated Peptidomes in Mono-allelic Cells Enables More Accurate Epitope Prediction. Immunity. 2017;46:315–326. - PMC - PubMed
    1. Adams JJ, Narayanan S, Birnbaum ME, Sidhu SS, Blevins SJ, Gee MH, Sibener LV, Baker BM, Kranz DM, Garcia KC. Structural interplay between germline interactions and adaptive recognition determines the bandwidth of TCR-peptide-MHC cross-reactivity. Nat Immunol. 2016;17:87–94. - PMC - PubMed
    1. Adams JJ, Narayanan S, Liu B, Birnbaum ME, Kruse AC, Bowerman NA, Chen W, Levin AM, Connolly JM, Zhu C, et al. T cell receptor signaling is limited by docking geometry to peptide-major histocompatibility complex. Immunity. 2011;35:681–693. - PMC - PubMed
    1. Alexandrov LB, Nik-Zainal S, Wedge DC, Aparicio SA, Behjati S, Biankin AV, Bignell GR, Bolli N, Borg A, Borresen-Dale AL, et al. Signatures of mutational processes in human cancer. Nature. 2013;500:415–421. - PMC - PubMed

Publication types