. 2018 Jan 8;44(1):97-112.e7.
doi: 10.1016/j.devcel.2017.11.020. Epub 2017 Dec 21.

A Proximity Labeling Strategy Provides Insights into the Composition and Dynamics of Lipid Droplet Proteomes

Affiliations

A Proximity Labeling Strategy Provides Insights into the Composition and Dynamics of Lipid Droplet Proteomes

Kirill Bersuker et al. Dev Cell. .

Abstract

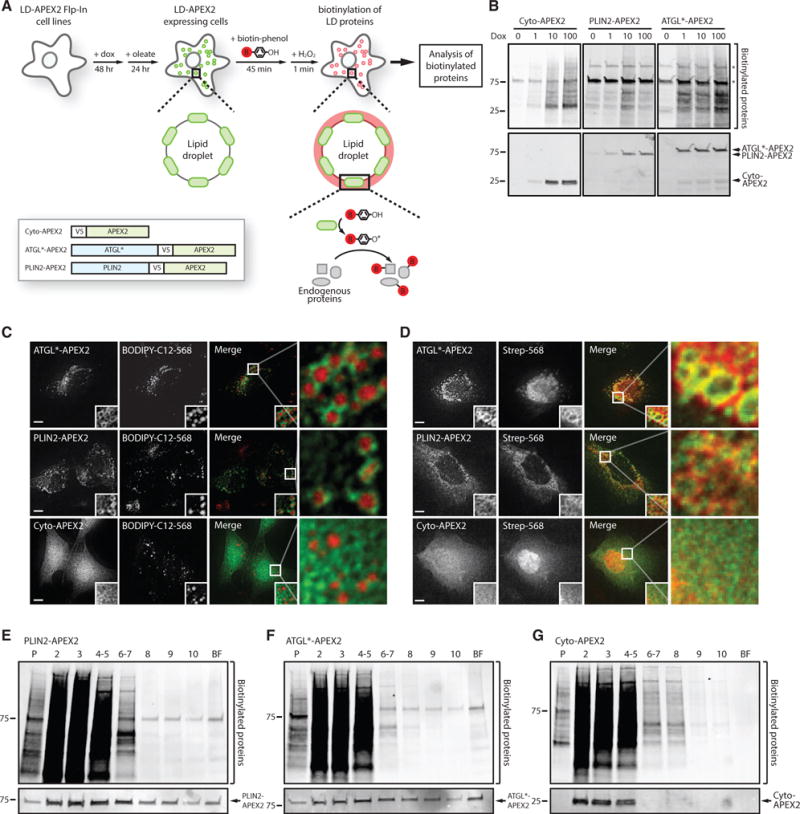
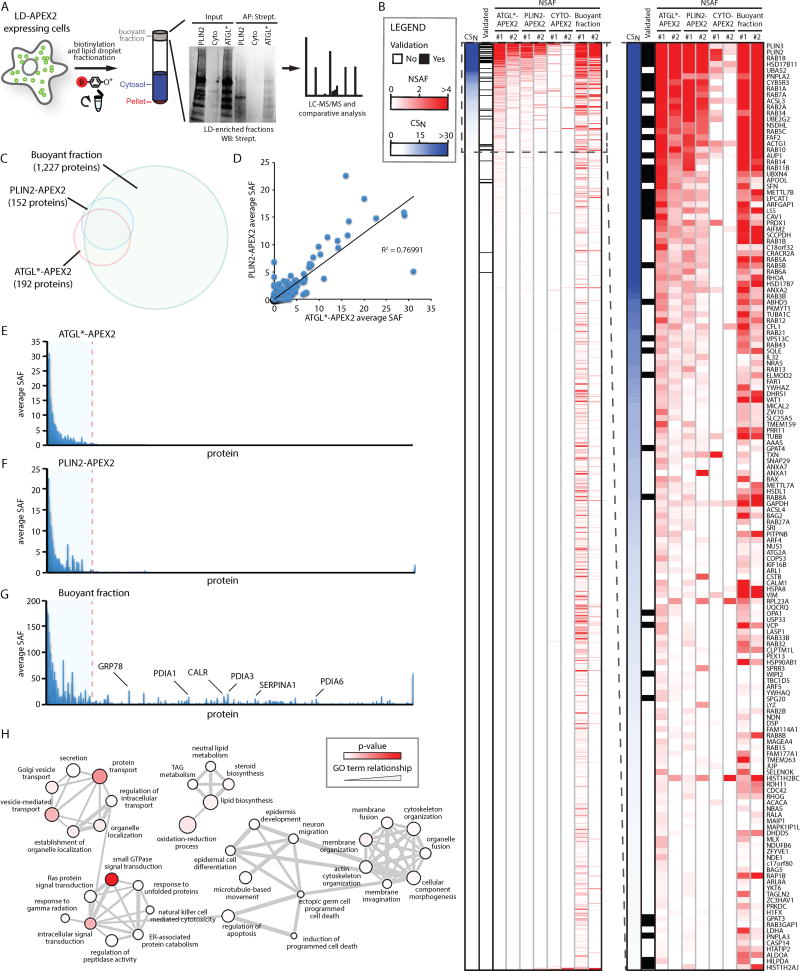
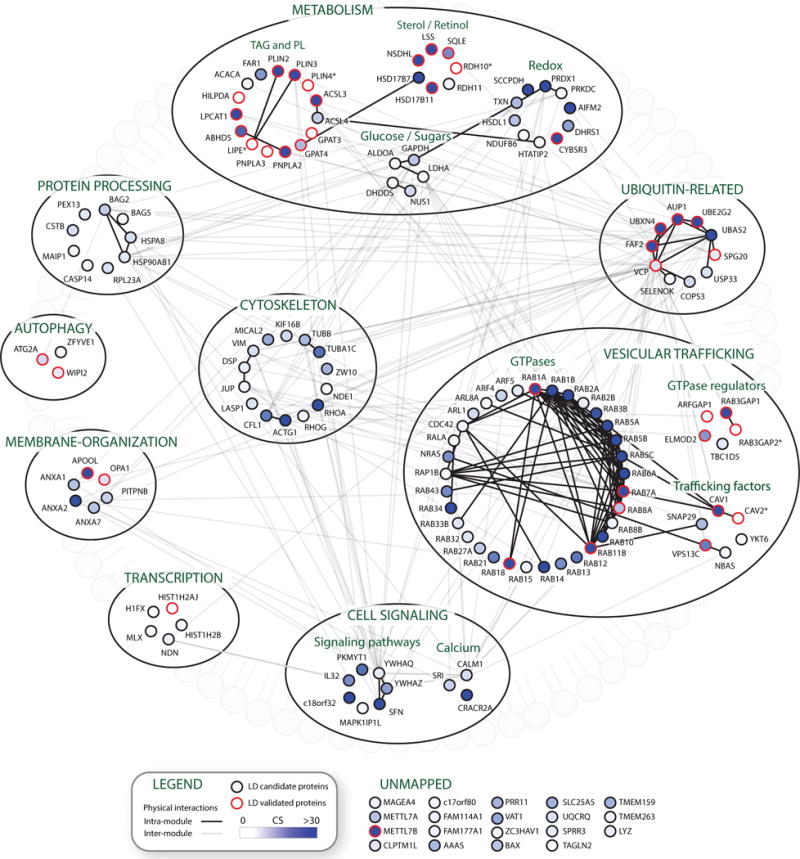
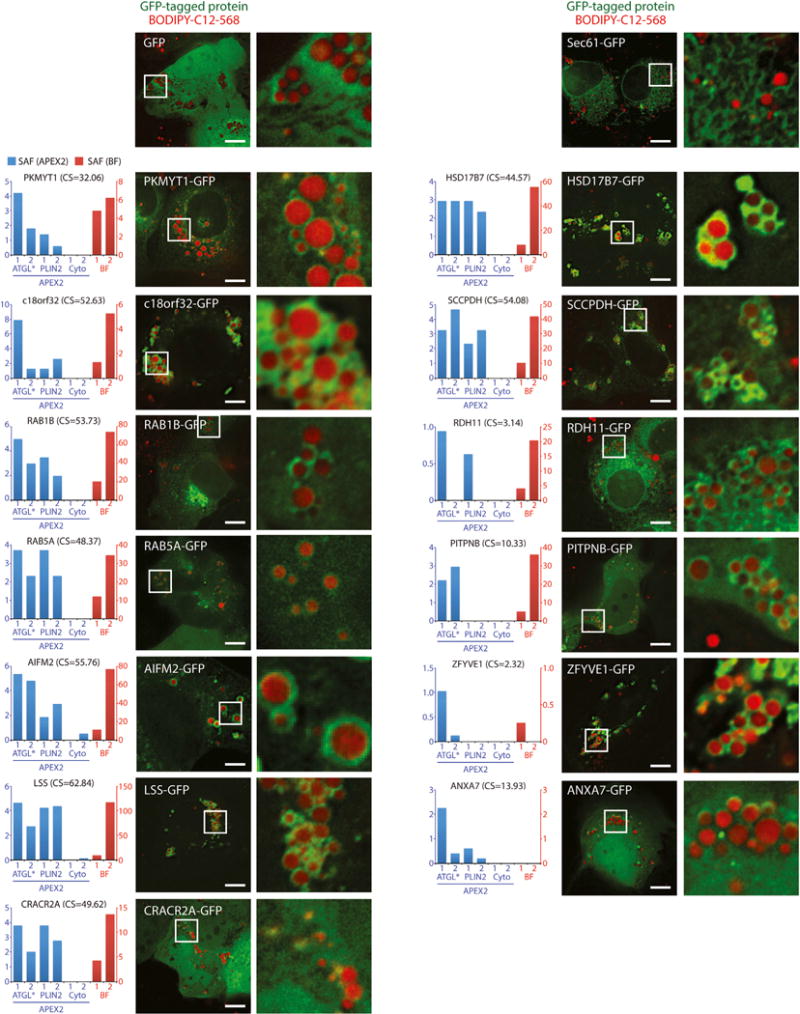
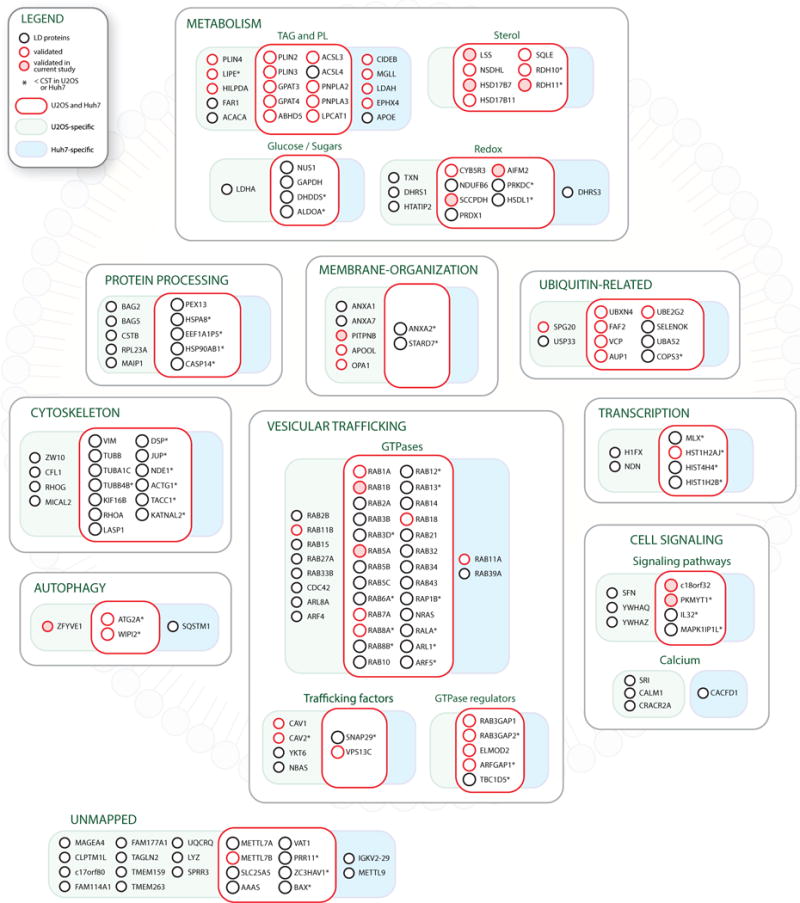
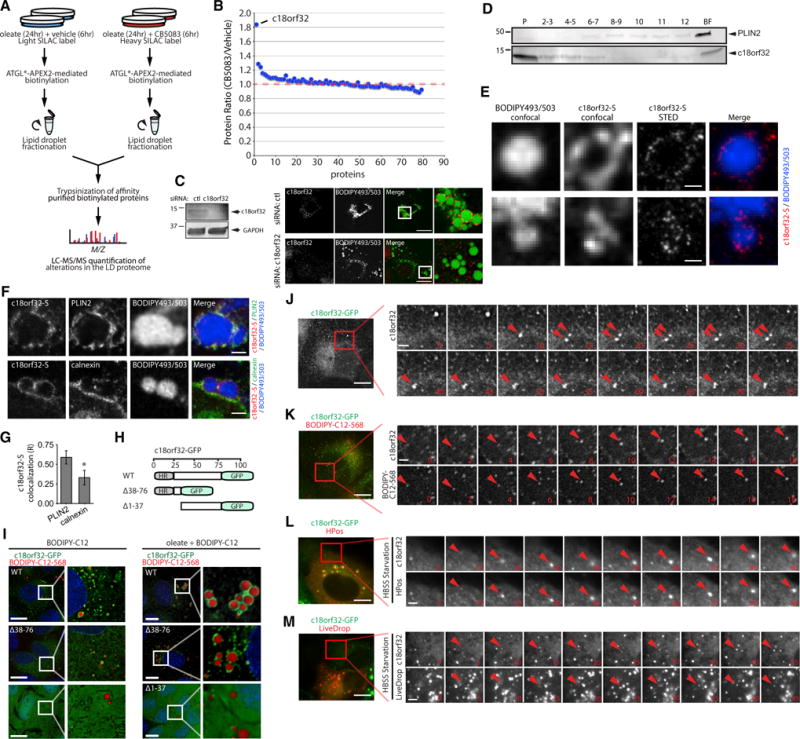
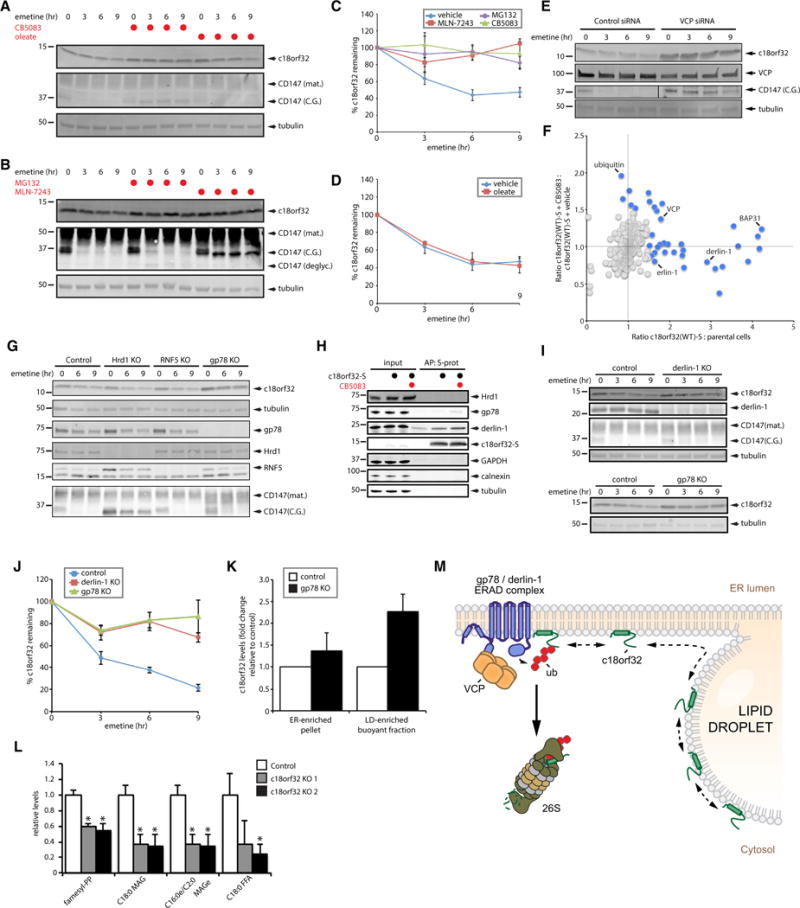
Lipid droplet (LD) functions are regulated by a complement of integral and peripheral proteins that associate with the bounding LD phospholipid monolayer. Defining the composition of the LD proteome has remained a challenge due to the presence of contaminating proteins in LD-enriched buoyant fractions. To overcome this limitation, we developed a proximity labeling strategy that exploits LD-targeted APEX2 to biotinylate LD proteins in living cells. Application of this approach to two different cell types identified the vast majority of previously validated LD proteins, excluded common contaminating proteins, and revealed new LD proteins. Moreover, quantitative analysis of LD proteome dynamics uncovered a role for endoplasmic reticulum-associated degradation in controlling the composition of the LD proteome. These data provide an important resource for future LD studies and demonstrate the utility of proximity labeling to study the regulation of LD proteomes.

Keywords: APEX; APEX2; ERAD; biotinylation; endoplasmic reticulum; lipid droplet; proteasome; proteome; proximity labeling; ubiquitin.


Figures

Figure 1
Figure 1. Lipid Droplet-Targeted APEX2 Biotinylates Proteins on Lipid Droplets
(A) Illustration of the proximity labeling strategy to identify lipid droplets (LD) proteins. Cells stably expressing ATGL*-V5-APEX2, PLIN2-V5-APEX2, or Cyto-V5-APEX2 are treated with doxycycline (dox) for 48 hr to induce expression of LD-targeted or cytosolic APEX2 proteins, and then treated with oleate for 24 hr to induce formation of LDs. LD-targeted APEX2 covalently modifies proximal LD proteins with biotin upon addition of biotin-phenol and hydrogen peroxide (H2O2). Biotinylated proteins are subsequently affinity purified and identified by mass spectrometry. (B) U2OS cells stably expressing cytosolic or LD-targeted APEX2 were treated with 0–100 ng/mL dox for 48 hr and biotin-phenol/H2O2. Total proteins from lysed cells were separated by SDS-PAGE and analyzed by blotting with fluorescently labeled streptavidin and antibodies against the V5 epitope tag. (C) U2OS cells stably expressing cytosolic or LD-targeted APEX2 were treated with 200 μM oleate and 1 μM BODIPY-C12-568 for 24 hr to induce formation of BODIPY-C12-568-positive LDs (red). Cells were imaged by fluorescence microscopy and the APEX2 fusion proteins were detected using antibodies against the V5 epitope tag (green). Magnified insets show cellular regions with LDs. Scale bars represent 10 μm. (D) U2OS cells stably expressing cytosolic or LD-targeted APEX2 incubated with 200 μM oleate for 24 hr were treated with biotin-phenol/H2O2 and imaged by fluorescence microscopy using fluorescent streptavidin-568 (red) and antibodies against the V5-epitope tag (green). Scale bars represent 10 μm. (E–G) Lysates from U2OS cells stably expressing LD-targeted or cytosolic APEX2 were fractionated by sucrose gradient centrifugation. Proteins in individual fractions were separated by SDS-PAGE and analyzed by blotting with fluorescent streptavidin-568 and antibodies against the V5 epitope tag. See also Figure S1; Table S1.
Figure 2
Figure 2. Proteomic Analysis of Biotinylated LD Proteins
(A) Illustration depicting the two-step strategy to identify biotinylated LD proteins. Following the induction of biotinylation in cells stably expressing cytosolic or LD-targeted APEX2, LD-enriched buoyant fractions are isolated by sucrose gradient centrifugation. Biotinylated proteins are then affinity purified from buoyant fractions using streptavidin-conjugated beads and identified by mass spectrometry. (B) Proteins identified in total buoyant fraction and in streptavidin affinity purifications from the indicated APEX2 cell lines were ranked by descending LD confidence score (CSN). Data from two independent experimental replicates for each sample are shown. The intensity of the blue color represents the CSN value and the intensity of the red color represents the normalized spectral abundance factor (NSAF) value. The heatmap scale is linear. A black box indicates if a protein was previously validated as an LD protein by microscopy. The boxed inset shows the high-confidence LD proteins (CSN > 1). (C) Venn diagram illustrating the overlap between proteomes identified in the LD-targeted APEX2 cell lines and in the buoyant fraction. (D) Comparison of average spectral abundance factors (SAF) for proteins identified in the affinity purifications from ATGL*-V5-APEX2 and PLIN2-V5-APEX2 cells. Each symbol corresponds to an LD protein identified in both cell lines. The R2 coefficient for the linear regression line is indicated. (E–G) The average SAF for proteins identified in the affinity purifications from the ATGL*-V5-APEX2 (E) or PLIN2-V5-APEX2 (F) cells or in the total buoyant fractions isolated from parental cells (G). (H) Selected enriched gene ontology (GO)-term categories for high-confidence LD proteins. See also Figures S1 and S2; Tables S2 and S3.
Figure 3
Figure 3. Illustration of the High-Confidence LD Proteome
High-confidence LD proteins are grouped into functional modules based on GO analysis and UNIPROT functional annotations. Solid lines represent physical interactions within functional modules and transparent lines represent interactions between proteins in distinct modules, as annotated in Bio-GRID. The intensity of the blue color in a node indicates the confidence score. Nodes outlined in red represent proteins that have been previously validated to localize to LDs by microscopy.
Figure 4
Figure 4. Validation of High-Confidence LD Proteins
Cells transiently transfected with selected high-confidence LD proteins C-terminally fused to GFP were treated with 200 μM oleate and 1 μM BODIPY-C12-568 for 24 hr and imaged using fluorescence microscopy. Magnified insets show regions with LDs. The graphs to the left show the SAF in affinity purifications from APEX2 cell lines (blue) and in the buoyant fraction (BF) (red). Control cells were transfected with GFP or Sec61β-mCherry to label the cytosol and ER, respectively. Scale bars represent 10 μm. CS, confidence score.
Figure 5
Figure 5. Combined High-Confidence LD Proteomes from U2OS and Huh7 Cells
Composite illustration of high-confidence LD proteins identified in U2OS and Huh7 cells. Proteins are grouped into functional modules. Boxes indicate U2OS-specific proteins (green), Huh7-specific proteins (blue), and shared proteins (red). Microscopic validation of individual nodes at LDs in previous studies (red circle) and in this study (shaded red circle) is also indicated. Asterisk indicates that the protein was identified, but was below the high-confidence threshold (CSN < 1) in one or both cell lines. See also Figures S3–S6; Tables S2, S3, and S4.
Figure 6
Figure 6. VCP Regulates the Levels of c18orf32 on LDs
(A) SILAC strategy to identify VCP-regulated LD proteins. ATGL*-V5-APEX2 cells were cultured in light or heavy lysine-containing SILAC medium and incubated with 200 μM oleate for 24 hr. U2OS cells were subsequently treated with vehicle (light) or 5 μM VCP inhibitor CB5083 (heavy) for 6 hr. Cells were incubated with biotin-phenol/H2O2, biotinylated buoyant fractions from light- and heavy-labeled cells were combined, and light/heavy-labeled biotinylated proteins were affinity purified for identification by mass spectrometry. (B) The heavy-to-light fold change ratio of biotinylated proteins purified from cells treated with CB5083 and vehicle as depicted in (A). (C) U2OS cells were transfected with control or c18orf32-targeting small interfering RNA (siRNA) for 48 hr, incubated with 200 μM oleate for 24 hr, and analyzed by SDS-PAGE or fluorescence microscopy using antibodies against c18orf32 (red) and the neutral lipid dye BODIPY 493/503 (green) to stain LDs. Magnified insets show cellular regions with LDs. Scale bars represent 10 μm. (D) U2OS cells were incubated with 200 μM oleate for 24 hr. Cellular homogenates were fractionated by sucrose gradient centrifugation, and proteins in individual fractions were separated by SDS-PAGE and immunoblotted with antibodies against c18orf32 and PLIN2. P, pellet; BF, buoyant fraction. (E) U2OS cells stably expressing c18orf32-S were incubated with 200 μM oleate and fixed cells were sequentially imaged by confocal and STED microscopy using the neutral lipid dye BODIPY 493/503 and antibody against S-tag. In both examples shown, LDs were only visualized using confocal microscopy. Scale bars represent 500 nm. (F) U2OS cells stably expressing c18orf32-S were incubated with 200 μM oleate and fixed cells were sequentially imaged by confocal microscopy to visualize BODIPY 493/503-positive LDs and STED microscopy to visualize c18orf32-S and PLIN2 or calnexin. Scale bars represent 1 μm. (G) The degree of colocalization between c18orf32-S and PLIN2 or calnexin in (F) was assessed by recording the Pearson’s correlation coefficient across multiple regions (n = 16) per condition. Values represent mean ± SD. Asterisk indicates a significant difference (*p < 0.001). (H) Illustration of c18orf32-GFP truncation mutants lacking the N-terminal hydrophobic region (HR) (Δ1-37) or the C-terminal region (Δ38-76). (I) U2OS cells stably expressing full-length c18orf32-GFP or truncation mutants c18orf32(Δ38-76)-GFP and c18orf32(Δ1-37)-GFP were treated with dox for 48 hr and incubated in the presence and absence of 200 μM oleate supplemented with 1 μM BODIPY-C12-568 for 24 hr. Cells incubated in the absence of oleate were treated with 0.5 μM BODIPY-C12-568 to label LDs. Live cells were imaged by fluorescence microscopy. Magnified insets show cellular regions with LDs. Scale bars represent 10 μm. (J) U2OS cells stably expressing c18orf32-GFP were treated with dox for 48 hr and imaged by time-lapse fluorescence microscopy. C18orf32-GFP puncta are indicated by arrowheads. Time stamp indicates elapsed time in seconds after start of imaging. Scale bars represent 2.5 μm in the montage. (K) U2OS cells stably expressing c18orf32-GFP were treated with dox for 48 hr and subsequently treated with 1 μM BODIPY-C12-568. Colocalized c18orf32-GFP and BODIPY-C12-568 puncta are indicated by arrowheads. Time stamp indicates elapsed time in minutes after addition of BODIPY-C12-568. Scale bars represent 2.5 μm in the montage. (L and M) U2OS cells stably expressing c18orf32-GFP were transiently transfected with HPos-mOrange or LiveDrop for 48 hr and treated with dox for 24 hr. Cells were subsequently incubated in HBSS medium and imaged by time-lapse fluorescence microscopy. Colocalized c18orf32-GFP and HPos-mOrange (L) or LiveDrop (M) puncta are indicated by arrowheads. Time stamp indicates time elapsed in minutes after addition of HBSS. Scale bars represent 2.5 μm in the montage. See also Figure S7; Table S5.
Figure 7
Figure 7. C18orf32 Is Degraded by a gp78 and derlin-1-dependent ERAD Pathway
(A) U2OS cells were treated with 75 μM emetine and vehicle or 5 μM CB5083 as indicated. A separate series of cells was pretreated with 200 μM oleate for 24 hr prior to addition of emetine. Proteins from cell lysates were separated by SDS-PAGE and analyzed by blotting with antibodies against c18orf32, CD147, and tubulin. C.G., core-glycosylated; mat., mature. (B) U2OS cells were treated with 75 μM emetine and vehicle, 10 μM MG132, or 10 μM MLN-7243 as indicated. Proteins from cell lysates were separated by SDS-PAGE and analyzed by blotting with antibodies against c18orf32, CD147, and tubulin. C.G., core-glycosylated; deglyc., deglycosylated; mat., mature. (C and D) The percentage of c18orf32 remaining (relative to time = 0 hr) was quantified by densitometry analysis of immunoblots in (A and B). Data points represent mean ± SEM (n ≥ 3 independent experiments). (E) U2OS cells were transfected with scrambled control siRNA or siRNA targeting VCP for 72 hr and subsequently treated with emetine as indicated. Proteins from cell lysates were separated by SDS-PAGE and analyzed by blotting with antibodies against c18orf32, VCP, tubulin, and CD147. (F) U2OS cells stably expressing c18orf32(WT)-S or parental cells were cultured in SILAC medium and treated with dox for 48 hr. c18orf32(WT)-S cells were subsequently treated with vehicle or 5 μM CB5083 for 6 hr. Proteins from cell lysates were combined in equal ratios, c18orf32(WT)-S was affinity purified using S-protein-conjugated agarose beads, and interacting proteins were identified by mass spectrometry. For each identified protein, the x axis represents fold change abundance ratio of proteins associated with c18orf32(WT)-S relative to parental cells, and the y axis represent fold change abundance ratio of proteins associated with c18orf32(WT)-S in cells treated with CB5083 relative to cells treated with vehicle. Background proteins are indicated as gray data points and interactors (above a SILAC ratio of 1.5) are indicated as blue data points. (G) Control HEK293 cells or cells lacking Hrd1, RNF5, or gp78 were treated with emetine as indicated. Proteins from whole-cell lysates were separated by SDS-PAGE and analyzed by blotting with antibodies against c18orf32, tubulin, CD147, Hrd1, RNF5, and gp78. (H) Control cells or U2OS cells stably expressing c18orf32-S were treated with vehicle or 5 μM CB5083 for 6 hr as indicated. C18orf32-S was affinity purified, and the cell lysates (input, 0.2%, w/w) and eluted proteins (AP) were analyzed by immunoblotting with antibodies against gp78, derlin-1, Hrd1, and c18orf32-S. Antibodies against GAPDH, calnexin, and tubulin were included to control for loading and affinity purification. (I) Control HEK293 cells or cells lacking derlin-1 (upper panel) or gp78 (lower panel) were treated with emetine as indicated. Proteins from whole-cell lysates were separated by SDS-PAGE and analyzed by immunoblotting with antibodies against c18orf32, derlin-1, CD147, and tubulin. (J) The percentage of c18orf32 remaining (relative to time = 0 hr) was quantified by densitometry analysis of immunoblots in (I). Data points represent mean ± SEM (n ≥ 3 independent experiments). (K) Control HEK293 cells or cells lacking gp78 were treated with 200 μM oleate for 24 hr and pellet and buoyant fractions were purified by density gradient centrifugation. Levels of c18orf32 in pellet and buoyant fractions were determined by SDS-PAGE/immunoblot and normalized to the levels of calnexin and UBXD8, respectively. Data points represent mean ± SEM (n ≥ 3 independent experiments). (L) Lipids from buoyant fractions (n = 4) isolated from clonal, c18orf32-null cells or cas9-expressing control cells were extracted and analyzed by mass spectrometry. Levels of all lipid species were compared with those present in control cells. Significantly altered lipids are shown. Asterisk indicates a significant difference (*p < 0.001). (M) Model depicting the c18orf32 degradation pathway. C18orf32 traffics between the ER membrane and LDs. Levels of c18orf32 on LDs are controlled by an ERAD pathway that includes derlin-1, gp78, and the AAA ATPase VCP. See also Figure S7; Tables S6 and S7.

Comment in

References

    1. Anderson DJ, Le Moigne R, Djakovic S, Kumar B, Rice J, Wong S, Wang J, Yao B, Valle E, Kiss von Soly S, et al. Targeting the AAA ATPase p97 as an approach to treat cancer through disruption of protein homeostasis. Cancer Cell. 2015;28:653–665. - PMC - PubMed
    1. Bartz R, Zehmer JK, Zhu M, Chen Y, Serrero G, Zhao Y, Liu P. Dynamic activity of lipid droplets: protein phosphorylation and GTP-mediated protein translocation. J Proteome Res. 2007;6:3256–3265. - PubMed
    1. Bendayan M. Tech.Sight Worth its weight in gold. Science. 2001;291:1363–1365. - PubMed
    1. Benjamin DI, Cozzo A, Ji X, Roberts LS, Louie SM, Mulvihill MM, Luo K, Nomura DK. Ether lipid generating enzyme AGPS alters the balance of structural and signaling lipids to fuel cancer pathogenicity. Proc Natl Acad Sci USA. 2013;110:14912–14917. - PMC - PubMed
    1. Bersuker K, Olzmann JA. Establishing the lipid droplet proteome: mechanisms of lipid droplet protein targeting and degradation. Biochim Biophys Acta. 2017;1862:1166–1177. - PMC - PubMed

Publication types

MeSH terms