. 2018 Jan 3;97(1):195-208.e6.
doi: 10.1016/j.neuron.2017.11.040. Epub 2017 Dec 21.

Drd3 Signaling in the Lateral Septum Mediates Early Life Stress-Induced Social Dysfunction

Affiliations

Drd3 Signaling in the Lateral Septum Mediates Early Life Stress-Induced Social Dysfunction

Sora Shin et al. Neuron. .

Abstract

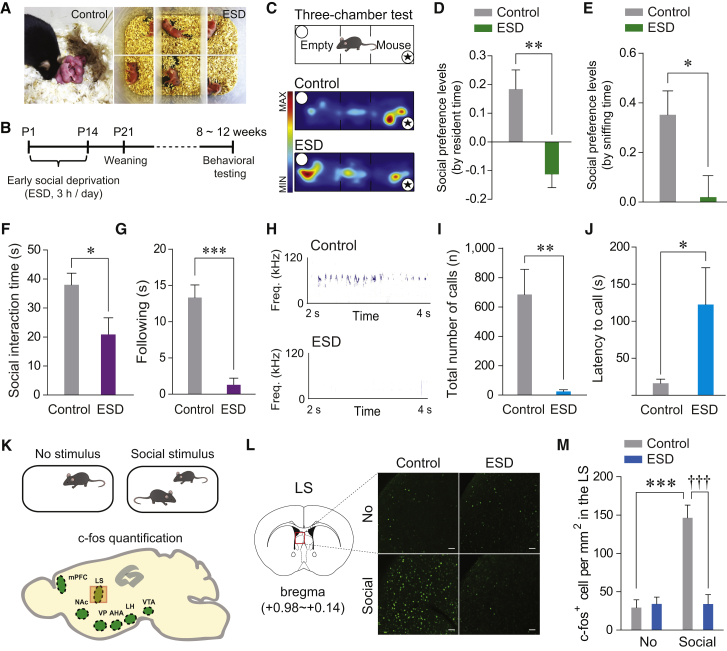
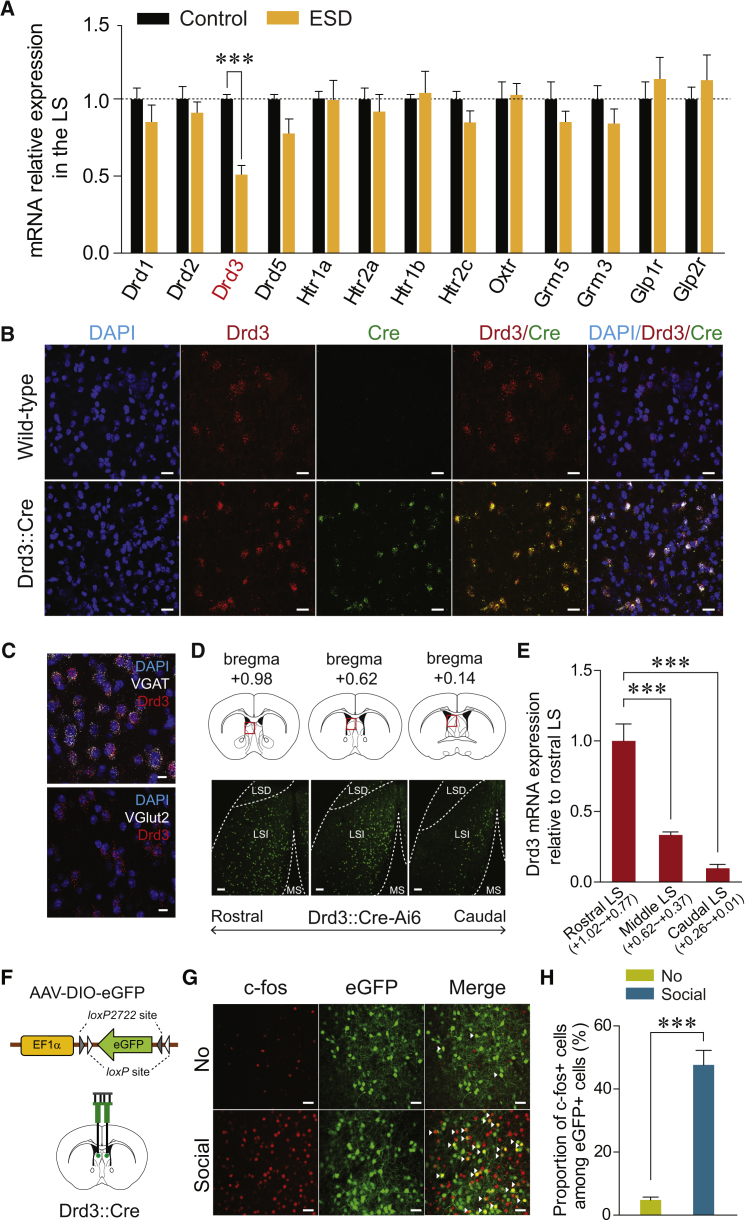
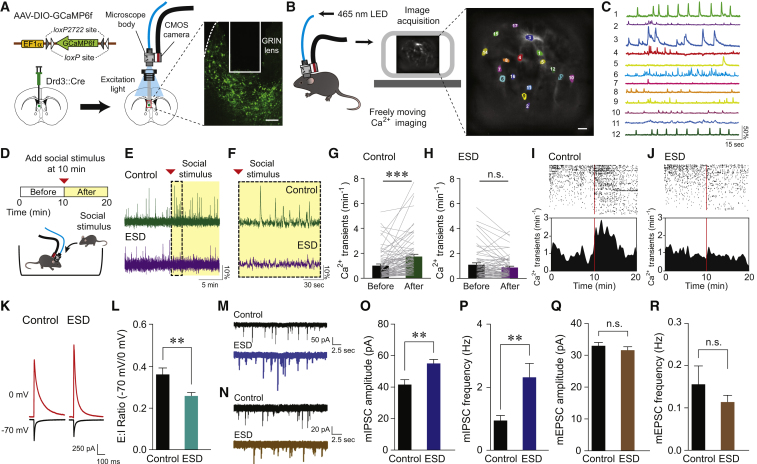
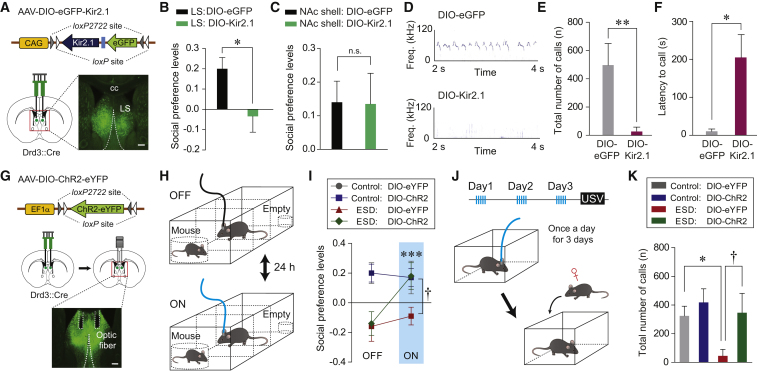
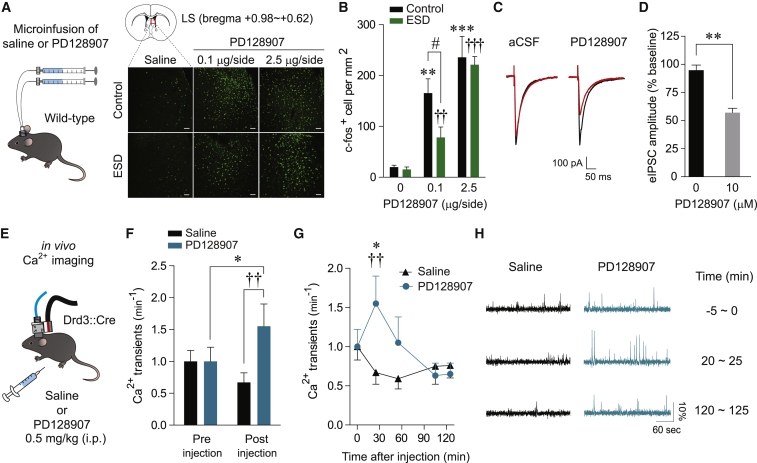
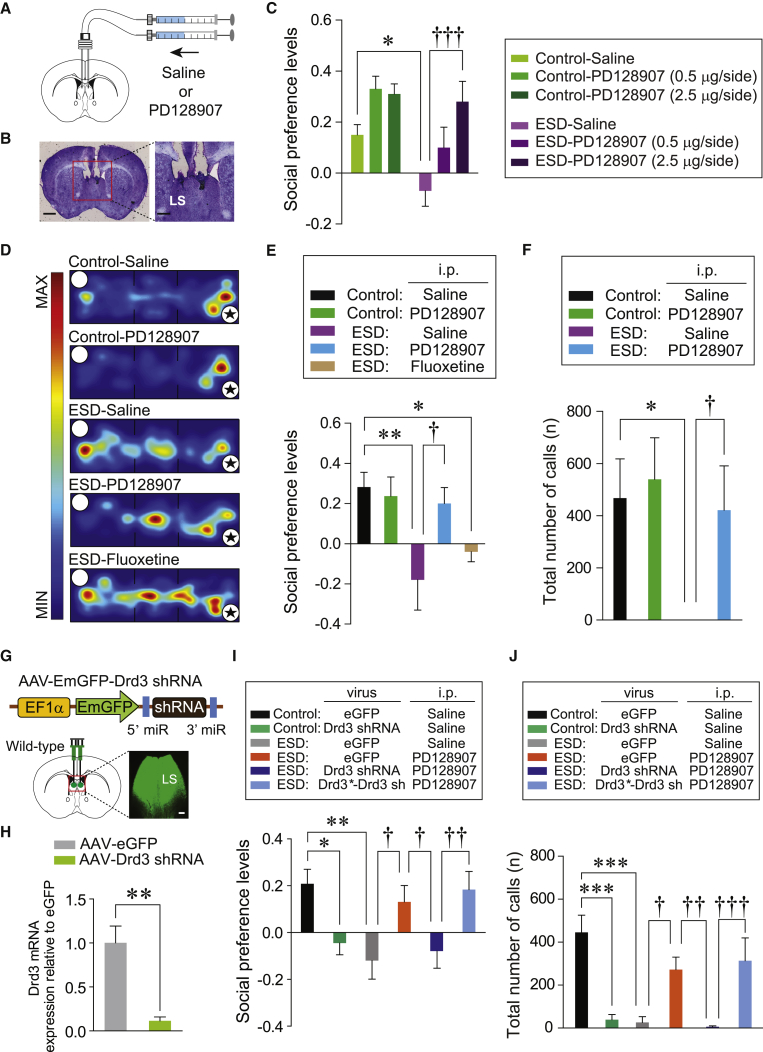
Early life stress (ELS) in the form of child abuse/neglect is associated with an increased risk of developing social dysfunction in adulthood. Little is known, however, about the neural substrates or the neuromodulatory signaling that govern ELS-induced social dysfunction. Here, we show that ELS-induced downregulation of dopamine receptor 3 (Drd3) signaling and its corresponding effects on neural activity in the lateral septum (LS) are both necessary and sufficient to cause social abnormalities in adulthood. Using in vivo Ca2+ imaging, we found that Drd3-expressing-LS (Drd3LS) neurons in animals exposed to ELS show blunted activity in response to social stimuli. In addition, optogenetic activation of Drd3LS neurons rescues ELS-induced social impairments. Furthermore, pharmacological treatment with a Drd3 agonist, which increases Drd3LS neuronal activity, normalizes the social dysfunctions of ELS mice. Thus, we identify Drd3 in the LS as a critical mediator and potential therapeutic target for the social abnormalities caused by ELS.

Keywords: Drd3; PD128907; early life stress; early social deprivation; lateral septum; social dysfunction.


Figures

Figure 1
Figure 1
ESD Mice Exhibit Impaired Social Behaviors and Reduced c-fos Expression in the LS in Response to Social Stimuli (A) Control pups remained with their dam (left), but ESD pups were removed and separated both from their dam and littermates (right). (B) The experimental timeline for the ESD stress procedure. (C) Schematic illustrating the three-chamber social preference test (top) and representative heatmap images during the test session for control (middle) and ESD (bottom) mice. Asterisks indicate the presence of a conspecific stranger. (D and E) Social preference levels based on resident time (D) and sniffing time (E) in the three-chamber test. ESD mice showed significantly reduced preference for exploring a stranger mouse (n = 7, 11 mice per group). (F and G) Reciprocal social interaction tests. ESD mice exhibited reduced total duration of direct contacts with a freely moving stranger mouse, as measured by amount of time spent in social interactions (i.e., sniffing, following, mounting, and nose to nose contacts) (F), and in following only (G) (n = 6 mice per group). (H) Representative images of USVs produced by a control (top) and ESD (bottom) male mouse encountering a female mouse. (I and J) ESD mice emitted significantly fewer USVs (I) and showed delayed latency to the first USV call (J) compared to controls (n = 12, 7 mice per group). (K) c-fos expression was examined at baseline (no stimulus) or after social interactions (top). Brain schematic illustrating the target areas analyzed for c-fos quantification (bottom). mPFC, medial prefrontal cortex; NAc, nucleus accumbens; VP, ventral pallidum; AHA, anterior hypothalamus; LH, lateral hypothalamus; VTA, ventral tegmental area. (L) Representative images of the LS showing c-fos staining in control versus ESD mice following exposure to a social stimulus. Scale bars, 50 μm. (M) Quantification of c-fos-positive cells in the LS. Social stimuli elicited robust increases in c-fos expression within the LS of control, but not ESD mice (n = 6 mice for each no stimulus group and n = 7 mice for each social stimulus group). Significance for multiple comparisons: unpaired t test (D–G), Mann-Whitney U test (I and J), and two-way ANOVA, post hoc, Bonferroni (M), p < 0.05; ∗∗p < 0.01; ∗∗∗p < 0.001; †††p < 0.001. Data are expressed as mean ± SEM. See also Figures S1 and S2.
Figure 2
Figure 2
Reduced Drd3 mRNA in the LS of ESD Mice and Characterization of Drd3LS Neurons (A) Quantitative real-time PCR analysis of mRNA expression of several neuromodulator receptors in the LS. ESD mice showed significantly reduced Drd3 mRNA expression in the LS, but no changes in the other dopamine receptor subtypes (Drd1, Drd2, or Drd5), the serotonin receptors (Htr1a, Htr2a, Htr1b, Htr2c), an oxytocin receptor (Oxtr), metabotropic glutamate receptors (Grm3, Grm5), or glucagon receptors (Glp1r, Glp2r) (n = 5, 9 mice per group). (B) Representative images of fluorescent in situ hybridizations of Drd3 mRNA (red) and Cre mRNA (green) expression in the LS of wild-type (top) or Drd3::Cre mice (bottom). Scale bars, 20 μm. (C) Representative images of fluorescent in situ hybridizations of VGAT or VGlut2 mRNA (white) and Drd3 mRNA (red) in the LS of wild-type mice. Drd3 is expressed primarily in GABAergic neurons of the LS. Scale bars, 10 μm. (D) Drd3 expression in the LS of Drd3::Cre-Ai6 mice. Coronal diagrams depicting the region analyzed (squared in red; top) and confocal images showing the Drd3 expression pattern in the LS along the rostral-caudal axis (bottom). Scale bars, 100 μm. LSD, lateral septal dorsal part; LSI, lateral septal intermediate part; MS, medial septum. (E) The rostral, middle, and caudal LS was dissected at the indicated thickness, and Drd3 mRNA expression was measured by quantitative real-time PCR. Drd3 is expressed broadly across the LS, with the highest levels appearing in the rostral LS (n = 3 mice per group). (F) Schematic for the bilateral injection of AAV expressing a Cre-dependent eGFP into the LS of control Drd3::Cre mice. (G) Representative images showing c-fos immunoreactivity (red) and eGFP fluorescence (green) in the LS of control Drd3::Cre mice injected with AAV-DIO-eGFP following exposure to a social stimulus. White arrowheads indicate the co-localization of c-fos immunostaining with Drd3 expression. Scale bars, 40 μm. (H) Quantification of the proportion of c-fos-positive cells among Drd3LS neurons of control Drd3::Cre mice. Social stimuli elicited a robust increase of c-fos expression in Drd3LS neurons (n = 4 mice per group). Significance for multiple comparisons: unpaired t test (A and H), one-way ANOVA, post hoc, Fisher least significant difference (LSD) (E), ∗∗p < 0.01 ∗∗∗p < 0.001. Data are presented as mean ± SEM. See also Figure S3.
Figure 3
Figure 3
Drd3LS Neurons of ESD Mice Display Reduced Activity in Response to Social Stimulus and Altered Synaptic Excitatory/Inhibitory Balance (A) Schematic for the injection of AAV expressing GCaMP6f in a Cre-dependent manner into the LS of Drd3::Cre mice (left). Confocal image showing GRIN lens placement on the GCaMP6f-expressing Drd3LS neurons. Scale bar, 200 μm (right). (B) Illustration of in vivo Ca2+ imaging setup (left). Sample image of GCaMP6f-expressing Drd3LS neurons and the color-coded regions of interest (ROIs) used for image analysis. Scale bar, 25 μm (right). (C) Sample Ca2+ activity traces of ΔF/F0 from individual neurons in (B). (D) Schematic for the experimental setup to record Ca2+ activity in GCaMP6f-expressing Drd3LS neurons. (E) Representative Ca2+ activity traces from Drd3LS neurons of control (top, green) and ESD (bottom, purple) Drd3::Cre mice, with the yellow-shaded area indicating the presence of a social stimulus. (F) Magnified view of the dotted box from (E). (G and H) Average Ca2+ transients per minute in Drd3LS neurons of control (G) and ESD (H) Drd3::Cre mice before and after the presentation of a social stimulus (n = 76 cells from 6 control mice, n = 66 cells from 5 ESD mice). (I and J) Raster plots (top) and peristimulus time histograms (bottom) showing Drd3LS neuronal activity of control (I) and ESD (J) Drd3::Cre mice (n = 76 cells from 6 control mice, n = 66 cells from 5 ESD mice). The rows and ticks in the raster plots represent individual cells and single Ca2+ transient events, respectively. Vertical red bars mark the time the social stimulus was introduced. (K and L) Representative traces (K) and quantification (L) of synaptic E:I ratio recorded from Drd3LS neurons of control and ESD Drd3::Cre mice (n = 19 cells from 3 control mice, n = 17 cells from 3 ESD mice). (M and N) Representative traces of mIPSCs (M) and mEPSCs (N) from Drd3LS neurons of control (top, black) and ESD Drd3::Cre mice (bottom, blue or brown). (O and P) The Drd3LS neurons of ESD Drd3::Cre mice showed enhanced mIPSC amplitude (O) and frequency (P) (n = 11 cells from 2 control mice, n = 13 cells from 3 ESD mice). (Q and R) mEPSC amplitude (Q) and frequency (R) did not differ between control and ESD Drd3::Cre mice (n = 10 cells from 2 control mice, n = 14 cells from 3 ESD mice). Significance for multiple comparisons: Paired t test (G), Mann-Whitney U test (L, O, and P), ∗∗p < 0.01; ∗∗∗p < 0.001; n.s., not significant. Data are presented as mean ± SEM. See also Figure S4.
Figure 4
Figure 4
Modulation of Drd3LS Neuronal Activity Influences Abnormal Social Behavior (A) Schematic depicting the injection of AAV expressing a Cre-dependent Kir2.1 into the LS of Drd3::Cre mice. Scale bar, 250 μm. cc, corpus callosum. (B and C) Social preference based on resident time in the three-chamber test. Viral-mediated Kir2.1 expression in Drd3LS neurons reduced social preference (B, n = 8 mice per group), while similar silencing of Drd3NAc shell neurons did not affect social preference (C, n = 4 mice per group). (D) Representative images of USVs emitted by control Drd3::Cre male mice injected with eGFP-expressing virus (top) or Kir2.1-expressing virus (bottom) in the LS, upon encountering a female mouse. (E and F) Control Drd3::Cre mice expressing Kir2.1 in Drd3LS neurons produced significantly fewer USVs (E) and showed increased latency to make the first USV call (F) (n = 6 mice per group). (G) Schematic depicting the injection of AAV-DIO-ChR2-eYFP, followed by implantation of optic fibers above the virus injection site within the LS of Drd3::Cre mice (top and middle). Confocal image showing optic fiber placement in the LS (bottom). Scale bar, 250 μm. (H) The experimental design of the three-chamber test with optical stimulation. Testing sessions were conducted twice and counterbalanced for order with a 24-hr interval between laser ON and laser OFF condition. (I) Photostimulation of Drd3LS neurons restored social preference in ESD Drd3::Cre mice (n = 6, 9 mice for each control group and n = 8, 11 mice for each ESD group; ∗∗∗p < 0.001 compared with ESD mice expressing DIO-ChR2 during the OFF state; p < 0.05 compared with ESD mice expressing DIO-eYFP during the ON state). (J) The experimental design of the USV tests after repeated delivery of optical stimulation (once a day for 3 days) (top). After the last stimulation, a female mouse was placed for recording USVs produced by male mice (bottom). (K) Photoactivation of Drd3LS neurons rescued the number of USVs emitted by ESD Drd3::Cre mice to the levels of controls (n = 7, 8 mice for each control group and n = 7, 6 mice for each ESD group). Significance for multiple comparisons: unpaired t test (B), Mann-Whitney U test (E and F), two-way repeated-measures (RM) ANOVA; post hoc, Fisher LSD (I), and two-way ANOVA; post hoc, Bonferroni (K), p < 0.05; ∗∗p < 0.01; ∗∗∗p < 0.001; p < 0.05; n.s., not significant. Data are presented as mean ± SEM. See also Figure S5.
Figure 5
Figure 5
Administration of the Drd3 Agonist PD128907 Increases Drd3LS Neuronal Activity (A) Schematic for the microinjection of saline or PD128907 into the LS of control and ESD mice (left). Representative images of c-fos staining in the LS of control and ESD mice following microinfusion of saline or PD128907 (0.1 or 2.5 μg/side). Scale bars, 50 μm (right). (B) Quantification of c-fos-positive cells in the LS of control or ESD mice 1 hr after saline or PD128907 microinfusion. PD128907 activated the LS neurons both in control and ESD mice (n = 6, 6, and 8 mice for each control group and n = 6, 8, and 6 mice for each ESD group; ∗∗p < 0.01, ∗∗∗p < 0.001 compared with control mice infused with saline; ††p < 0.01, †††p < 0.001 compared with ESD mice infused with saline; #p < 0.05 compared with ESD mice infused with 0.1 μg/side of PD128907). (C) Representative traces of electrically evoked IPSCs (eIPSCs) recorded from Drd3LS neurons of control Drd3::Cre mice prior to (black) and after (red) bath application of artificial cerebrospinal fluid (aCSF) or PD128907 (10 μM). (D) The amplitude of eIPSCs showed a significant reduction following a 20-min exposure to 10 μM PD128907 (n = 5, 7 cells per group). (E) Schematic for recording the activity from GCaMP6f-expressing Drd3LS neurons of control Drd3::Cre mice treated with saline or PD128907 (0.5 mg/kg, i.p.). (F) Average Ca2+ transients per minute before and 20 min after saline or PD128907 injections (n = 28 cells from 3 mice treated with saline, n = 21 cells from 3 mice treated with PD129907). (G) Time course of changes in Ca2+ transients per minute was measured during a 5-min window of pre-injection (at −5 min) and post-injection (at 20, 50, 100, 120 min). PD128907 administration induced a significant increase in GCaMP6f activity of Drd3LS neurons, which then gradually returned to baseline levels (n = 28 cells from 3 mice treated with saline, n = 21 cells from 3 mice treated with PD129907; p < 0.05 compared with PD128907-treated mice before injection; ††p < 0.01 compared with saline-treated mice at 20 min after injection). (H) Representative Ca2+ activity traces from Drd3LS neurons of control Drd3::Cre mice at each 5-min window of pre-injection and post-injection. Significance for multiple comparisons: two-way ANOVA; post hoc, Bonferroni (B), Mann-Whitney U test (D), and two-way RM ANOVA; post hoc, Fisher LSD (F and G), #p < 0.05; p < 0.05; ∗∗p < 0.01; ††p < 0.01. Data are presented as mean ± SEM. See also Figure S5.
Figure 6
Figure 6
Pharmacological Activation of Drd3 Signaling in the LS Prevents Social Impairments of ESD Mice (A) Schematic for the microinjection of saline or PD128907 into the LS of control and ESD mice. (B) Image shows the location of the cannula tips in the LS. Scale bars, 1 mm (left) and 250 μm (right). (C) Microinjection of PD128907 into the LS produced a dose-dependent increase in the social preference of ESD mice in the three-chamber test (n = 5, 5, and 4 mice for each control group; n = 9, 5, and 6 mice for each ESD group). (D) Representative heatmap images during three-chamber tests for control or ESD mice treated with saline, PD128907 (0.5 mg/kg, i.p.), or fluoxetine (20 mg/kg, i.p.). Asterisks indicate the presence of a conspecific stranger. (E) Social preference levels based on resident time in the three-chamber test. PD128907 (0.5 mg/kg, i.p.) administration increased social preference in ESD mice to the level of control mice, whereas chronic injection of fluoxetine (20 mg/kg, i.p.) did not (n = 6, 5 mice for each control group, n = 6, 6, and 5 mice for each ESD group). (F) PD128907 (0.5 mg/kg, i.p.) administration restored the total number of USVs in ESD mice (n = 5, 6 mice for each control group, n = 6, 6 mice for each ESD group). (G) Schematic depicting the injection of AAV expressing Drd3 shRNA into the LS of wild-type mice. Scale bar, 250 μm. (H) Quantitative real-time PCR analysis of Drd3 mRNA expression from the LS of mice injected with eGFP- or Drd3 shRNA-expressing AAV (n = 4 mice per group). (I and J) Knockdown of Drd3 by injection of AAV-Drd3 shRNA into the LS attenuated social preference (I) and total number of USVs (J) in control mice and blocked the PD128907-induced rescue of impaired social preference (I) and communication deficits (J) in ESD mice. However, the expression of shRNA-resistant Drd3 (Drd3, the mutant form is indicated by an asterisk) together with the shRNA against Drd3 (AAV-Drd3-Drd3 sh) did not block the PD128907-induced rescue of the social dysfunctions in ESD mice. (I, n = 11, 10 mice for each control group, n = 9, 10, 11, and 11 mice for each ESD group). (J, n = 8, 10 mice for each control group, n = 7, 8, 9, and 10 mice for each ESD group). Significance for multiple comparisons: two-way ANOVA; post hoc, Bonferroni (C and F), one-way ANOVA; post hoc, Fisher LSD (E, I, and J), and unpaired t test (H), p < 0.05; ∗∗p < 0.01; ∗∗∗p < 0.001; p < 0.05; ††p < 0.01; †††p < 0.001. Data are presented as mean ± SEM. See also Figures S6 and S7.

Similar articles

Cited by

References

    1. Agid O., Shapira B., Zislin J., Ritsner M., Hanin B., Murad H., Troudart T., Bloch M., Heresco-Levy U., Lerer B. Environment and vulnerability to major psychiatric illness: A case control study of early parental loss in major depression, bipolar disorder and schizophrenia. Mol. Psychiatry. 1999;4:163–172. - PubMed
    1. Anthony T.E., Dee N., Bernard A., Lerchner W., Heintz N., Anderson D.J. Control of stress-induced persistent anxiety by an extra-amygdala septohypothalamic circuit. Cell. 2014;156:522–536. - PMC - PubMed
    1. Bambini-Junior V., Zanatta G., Della Flora Nunes G., Mueller de Melo G., Michels M., Fontes-Dutra M., Nogueira Freire V., Riesgo R., Gottfried C. Resveratrol prevents social deficits in animal model of autism induced by valproic acid. Neurosci. Lett. 2014;583:176–181. - PubMed
    1. Bandelow B., Charimo Torrente A., Wedekind D., Broocks A., Hajak G., Rüther E. Early traumatic life events, parental rearing styles, family history of mental disorders, and birth risk factors in patients with social anxiety disorder. Eur. Arch. Psychiatry Clin. Neurosci. 2004;254:397–405. - PubMed
    1. Bolger K.E., Patterson C.J. Developmental pathways from child maltreatment to peer rejection. Child Dev. 2001;72:549–568. - PubMed

Publication types