. 2018 Jan 3;97(1):231-247.e7.
doi: 10.1016/j.neuron.2017.11.039. Epub 2017 Dec 21.

Morphometric Similarity Networks Detect Microscale Cortical Organization and Predict Inter-Individual Cognitive Variation

Affiliations

Morphometric Similarity Networks Detect Microscale Cortical Organization and Predict Inter-Individual Cognitive Variation

Jakob Seidlitz et al. Neuron. .

Abstract

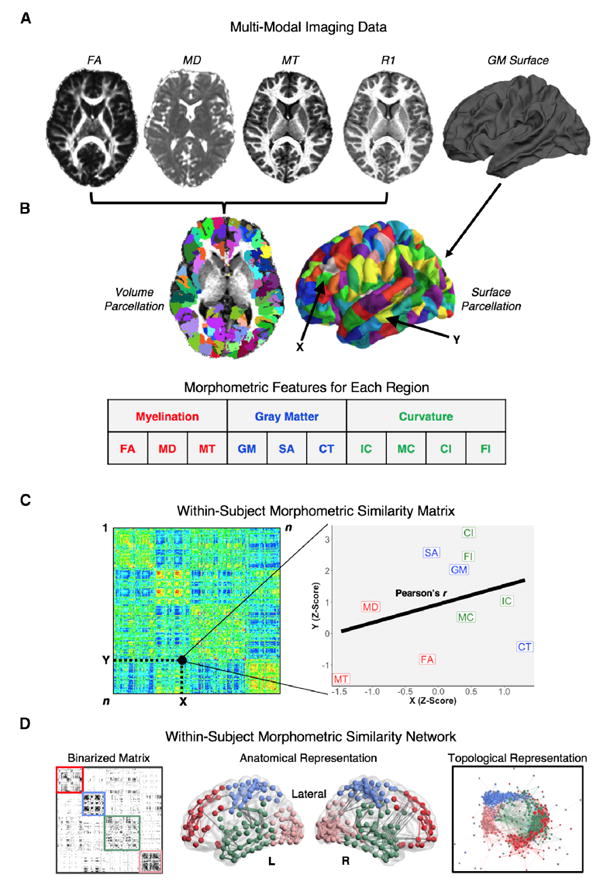
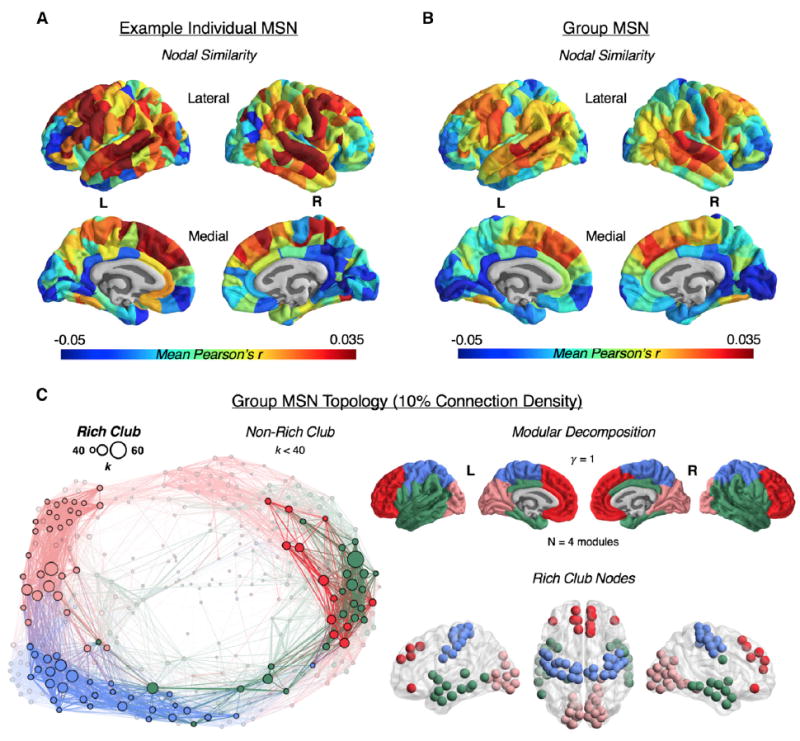
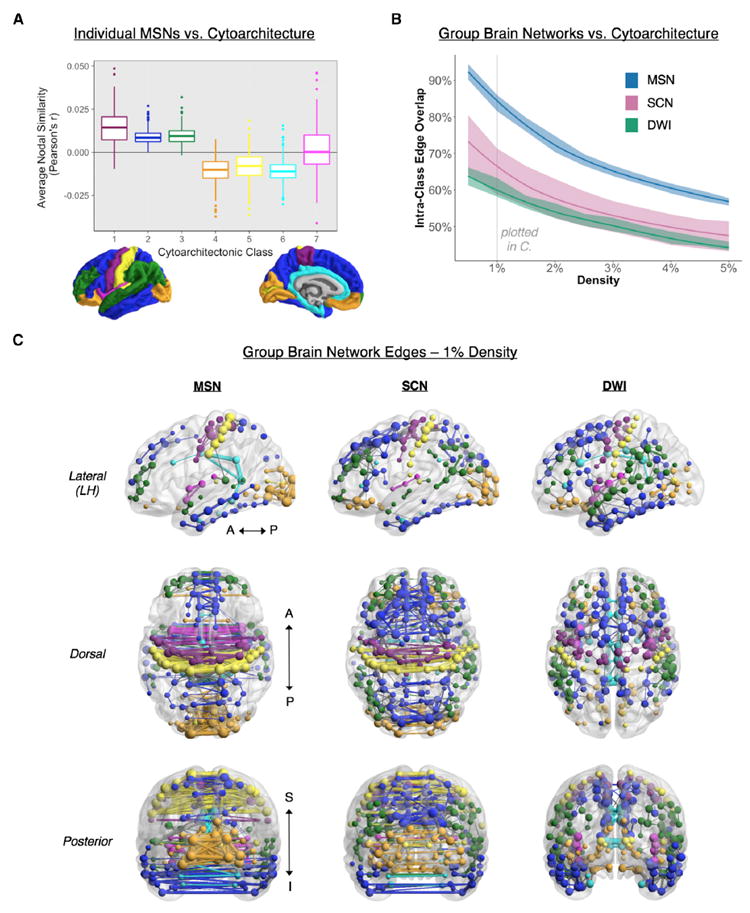
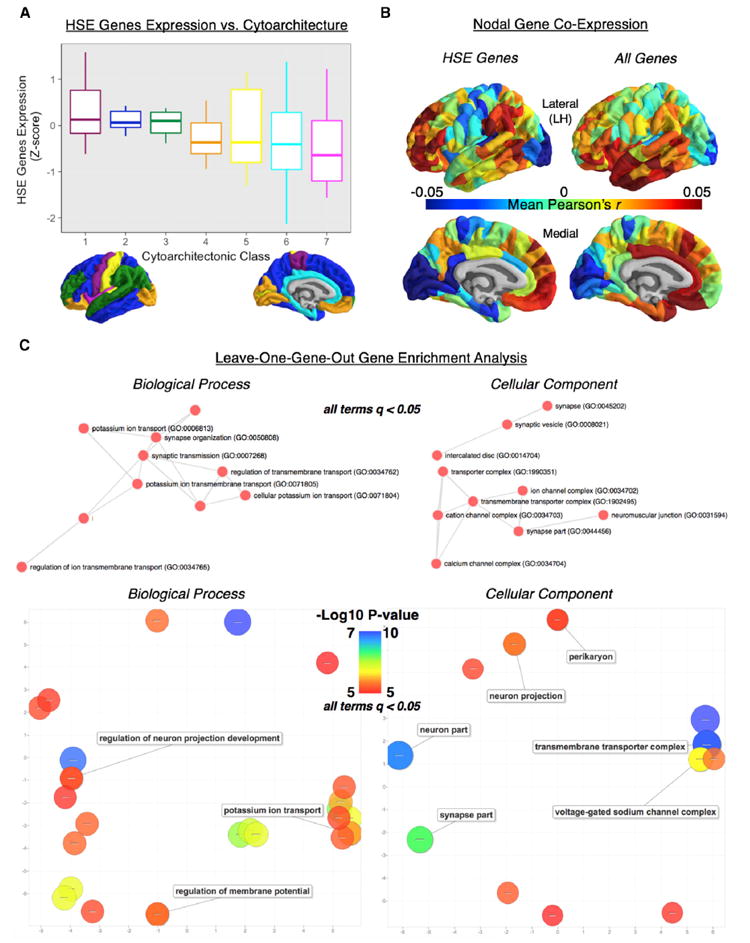
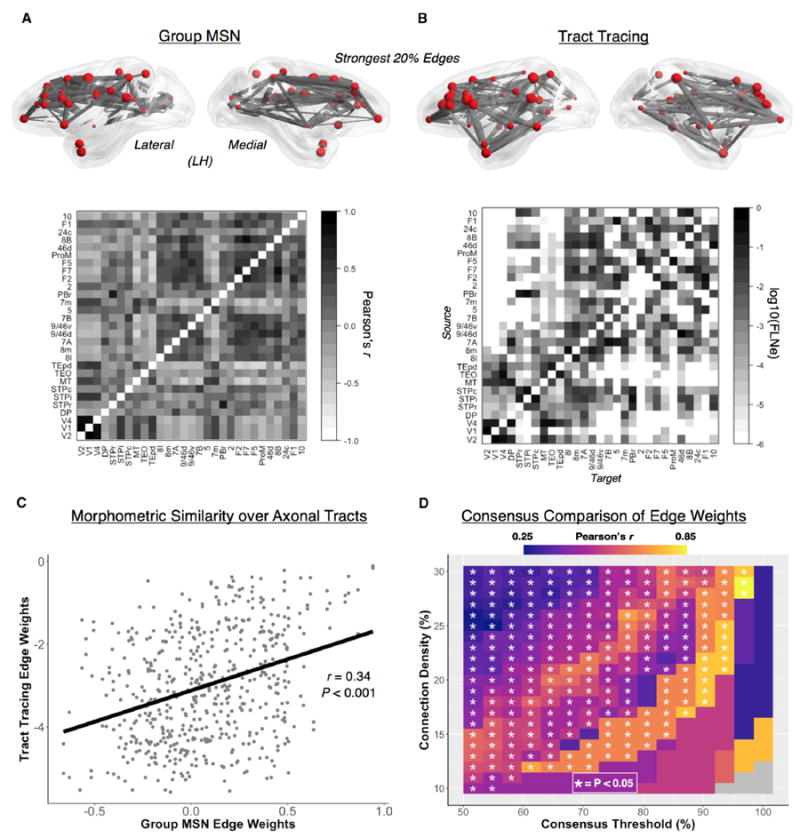
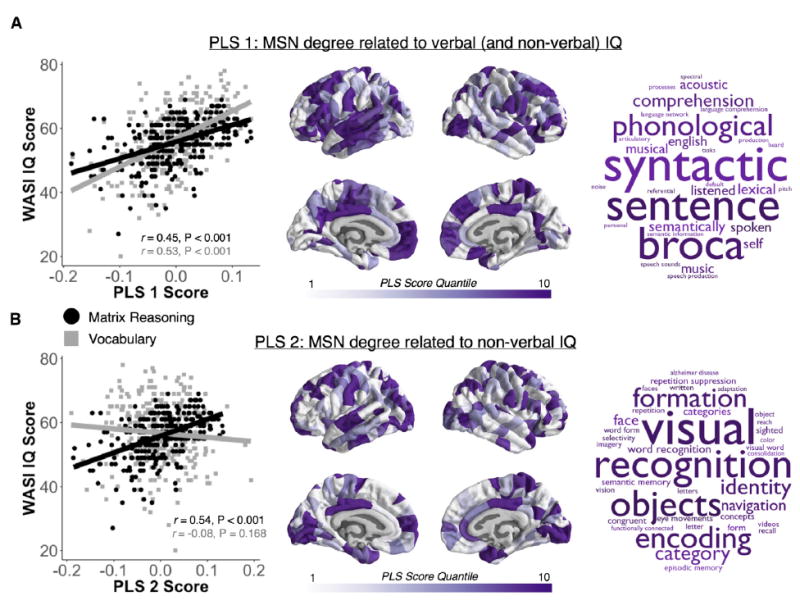
Macroscopic cortical networks are important for cognitive function, but it remains challenging to construct anatomically plausible individual structural connectomes from human neuroimaging. We introduce a new technique for cortical network mapping based on inter-regional similarity of multiple morphometric parameters measured using multimodal MRI. In three cohorts (two human, one macaque), we find that the resulting morphometric similarity networks (MSNs) have a complex topological organization comprising modules and high-degree hubs. Human MSN modules recapitulate known cortical cytoarchitectonic divisions, and greater inter-regional morphometric similarity was associated with stronger inter-regional co-expression of genes enriched for neuronal terms. Comparing macaque MSNs with tract-tracing data confirmed that morphometric similarity was related to axonal connectivity. Finally, variation in the degree of human MSN nodes accounted for about 40% of between-subject variability in IQ. Morphometric similarity mapping provides a novel, robust, and biologically plausible approach to understanding how human cortical networks underpin individual differences in psychological functions.

Keywords: IQ; MRI; connectome; cross-species; cytoarchitecture; gene expression; macaque; morphology; multi-modal.


Conflict of interest statement

DECLARATION OF INTERESTS

E.T.B. is employed half-time by the University of Cambridge and half-time by GlaxoSmithKline; he holds stock in GlaxoSmithKline. I.M.G. consults to Lundbeck.

Figures

Figure 1
Figure 1. The MSN Processing Pipeline
(A) Multiple MRI parameters were available from MRI and DWI data on each subject. (B) All MRI data were mapped to the same cortical parcellation template, which comprised 308 subregions of the Desikan-Killiany atlas with approximately equal surface areas. 10 regional morphometric features were estimated and normalized to produce a 10 × 308 feature matrix for each subject. (C) The morphometric similarity between each possible pair of regions was estimated by the Pearson’s correlation between their morphometric feature vectors to produce a 308 × 308 morphometric similarity matrix. (D) MSNs are binary graphs constructed by thresholding the morphometric similarity matrix so that the strongest (supra-threshold) edges are set equal to 1 (and all others are set equal to 0). The organization of MSNs can be visualized (from left to right) in matrix format, in anatomical space, or in a topological representation, where nodes are located close to each other if they are connected by an edge. FA, fractional anisotropy; MD, mean diffusivity; MT, magnetization transfer; GM, gray matter volume; SA, surface area; CT, cortical thickness; IC, intrinsic (Gaussian) curvature; MC, mean curvature; CI, curved index; FI, folding index.
Figure 2
Figure 2. Morphometric Similarity Matrices and Networks
(A and B) Spatial patterning of an individual (A) and group average (B) morphometric similarity matrix. For the individual and group matrix, the row means are plotted on the cortical surface of the template brain, representing the average morphometric similarity (Pearson’s r) of each node. The color scale represents the mean nodal similarity. (C) Right, top: modular partitioning of the group average morphometric similarity network (MSN), thresholded at 10% connection density, using the Louvain modularity algorithm. The γ resolution parameter dictates the number of detected modules; γ = 1 yielded four distinct spatially contiguous modules that approximately correspond to the lobes of the brain. Left: topological representation of the group MSN, thresholded at 10% connection density, highlighting the rich club of densely inter-connected hub nodes (opaque). The size of the nodes is scaled according to degree, and the thickness of the edges is scaled according to edge weight. Right, bottom: the rich club nodes are shown in their anatomical location and colored according to modular affiliation. See also Figures S1–S3.
Figure 3
Figure 3. Comparison of MSNs and Other MRI Networks to a Cytoarchitectonic Classification of the Cortex
(A) Average nodal similarity scores for individual MSNs within each of the cortical classes of von Economo and Koskinas (1925): 1 (agranular cortex, primary motor), 2 (association cortex), 3 (association cortex), 4 (secondary sensory cortex), 5 (primary sensory cortex), 6 (limbic regions), and 7 (insular cortex). The highest nodal similarity was consistently found in classes 1–3 (motor and association cortex)—areas with the most pyramidal neurons in supragranular layers of the cortex. (B) Proportion (percentage) of intra-class edges in the group MSN as a function of connection density (0.5%–10%, 0.5% intervals). The MSN has a higher percentage of intra-class edges compared with the SCN and DWI networks at all densities, demonstrating the high correspondence of MSN topology with cortical cytoarchitectonics. Shading represents results of intra-class overlap calculated in 1,000 bootstraps of our participant pool. (C) Graphs of each of the MRI networks, thresholded at1%density, with nodes and intra-class edges colored according to cytoarchitectonic class and inter-class edges drawn in gray. The MSN shows the greatest connectivity between bilaterally symmetric cortical regions relative to the SCN and DWI networks. Lower and upper bounds of the boxplots represent the 1st (25%) and 3rd (75%) quartiles, respectively. LH, left hemisphere; A, anterior; P, posterior; S, superior; I, inferior.
Figure 4
Figure 4. Topography of Regional HSE Gene Expression and Co-expression and Gene Enrichment Results from the Leave-One-Out Analysis with the Group Average MSN (NSPN)
(A) Average expression values for each of the 19 human supragranular enriched (HSE) genes within each of the seven classes of cytoarchitecture. Average expression was highest in classes 1–3, similar to the distribution of nodal similarity for each of the individual 10-feature NSPN MSNs (Figure 3). (B) Left hemisphere topography of nodal gene co-expression, calculated as the average co-expression (Pearson’s r) values, of the whole-genome and HSE-only gene co-expression networks. The pattern of nodal similarity of the group average 10-feature NSPN MSN was similar to that of nodal co-expression of both the whole-genome (r = 0.41, p < 0.001) and HSE-only networks (r = 0.48, p < 0.001). (C) Gene enrichment of the list of genes ranked by contribution to the edgewise relationship between the whole-genome gene co-expression network and the group average 10-feature NSPN MSN (r = 0.33, p < 0.001). Contribution for a gene was calculated as the difference between this empirical correlation (r = 0.33) and the correlation when using a gene co-expression network without that given gene. This ranked list was enriched for genes related to potassium ion transport and synaptic transmission (biological process) as well as neuron and synapse morphology (cellular component). The median rank of the 19 HSE genes within this list was 1,889/20,737 and was significantly greater than the median rank of 10,000 random subsets of 19 genes (p < 0.0001). These results demonstrate a link between regional gene expression (and co-expression) and morphometric similarity and further show that this relationship is driven by genes related to cortical cytoarchitecture and neural structure and communication. Lower and upper bounds of the boxplots represent the 1st (25%) and 3rd (75%) quartiles, respectively.
Figure 5
Figure 5. Comparison of Morphometric Similarity with Axonal Tract Tracing in the Macaque
(A and B) Top: the left hemisphere edges of the group average multimodal macaque MSN (A) and axonal tract tracing network (B), each thresholded at 20% connection density. Nodes in both networks are sized according to degree, calculated as the average nodal degree across MSNs (at 66% connection density) and, because of the effects of directionality, averaged nodal degree across both efferent and afferent connections in the tract-tracing network. Center: the 29 × 29 group average multimodal macaque MSN (A) and the connections of the tract tracing matrix (B). The 29 × 29 tract-tracing connectivity matrix is based on retrograde injections in 29 regions of the macaque cerebral cortex (Markov et al., 2012) and is 66% dense. Connection weights are based on the extrinsic fraction of labeled neurons (FLNe) and are plotted on a base 10 logarithmic scale. Diagonals in both networks are whited out. (C) For the overlapping edges in the two matrices in (B), there was a significant positive correlation between the edges of the group macaque MSN and the edge weights of the tract-tracing network (r = 0.34, p < 0.001). (D) The correspondence between the edge weights of the group MSN and those of the tract tracing network. The group MSN was masked using a consensus approach that incorporated the most common edges of the individual MSNs at varying connection densities (10%–30%). At each connection density and consensus threshold (determined by the proportion of subjects at a connection density with supra-thresholded edges in common), the group MSN and tracttracing network were masked, and the edge weights were correlated. Generally, we observed a positive relationship in connectivity weights across MSN connection densities and consensus thresholds (median r = 0.58, range = 0.27–0.82), with the highest correlations found using the strongest and most consistent edges in the individual MSNs. Collectively, these results not only suggest a relationship between morphometric similarity (derived in vivo) and axonal tract weights (derived ex vivo) at the group level but also reveal a possible “core” set of associations (measured in individual MSNs) that closely approximate physical anatomical connectivity.
Figure 6
Figure 6. The Nodal Degree of MSNs Is Highly Predictive of Individual Differences in Intelligence
(A and B) The first two components (PLS1 and PLS2) of a partial least-squares regression using individual MSN degree (at 10% connection density) explained about 40% of the variance in vocabulary and matrix reasoning subscales of WASI IQ scores in 292 people. PLS1 was correlated with both vocabulary and matrix reasoning (left) and with the degree or hubness of nodes in left-lateralized temporal and bilateral frontal cortical areas (center), related to language functioning (right) (A). PLS2 was correlated specifically with matrix reasoning and degree or hubness of nodes in bilateral primary sensory cortical areas (center), specialized for visual and sensorimotor processing (B).

References

    1. Ad-Dab’bagh Y, Lyttelton O, Muehlboeck J, Lepage C, Einarson D, Mok K, Ivanov O, Vincent R, Lerch J, Fombonne E. In: Corbetta M, editor. The CIVET image-processing environment: a fully automated comprehensive pipeline for anatomical neuroimaging research; Proceedings of the 12th annual meeting of the Organization for Human Brain Mapping; Florence, Italy. 2006. 2266.
    1. Alexander-Bloch A, Giedd JN, Bullmore E. Imaging structural co-variance between human brain regions. Nat Rev Neurosci. 2013a;14:322–336. - PMC - PubMed
    1. Alexander-Bloch A, Raznahan A, Bullmore E, Giedd J. The convergence of maturational change and structural covariance in human cortical networks. J Neurosci. 2013b;33:2889–2899. - PMC - PubMed
    1. Avants BB, Tustison NJ, Song G, Cook PA, Klein A, Gee JC. A reproducible evaluation of ANTs similarity metric performance in brain image registration. Neuroimage. 2011;54:2033–2044. - PMC - PubMed
    1. Baars BJ. Spatial brain coherence during the establishment of a conscious event. Conscious Cogn. 1997;6:1–2. - PubMed

Publication types