. 2018 Jan 4;22(1):64-77.e6.
doi: 10.1016/j.stem.2017.11.006. Epub 2017 Dec 21.

Inhibition of Endosteal Vascular Niche Remodeling Rescues Hematopoietic Stem Cell Loss in AML

Affiliations

Inhibition of Endosteal Vascular Niche Remodeling Rescues Hematopoietic Stem Cell Loss in AML

Delfim Duarte et al. Cell Stem Cell. .

Abstract

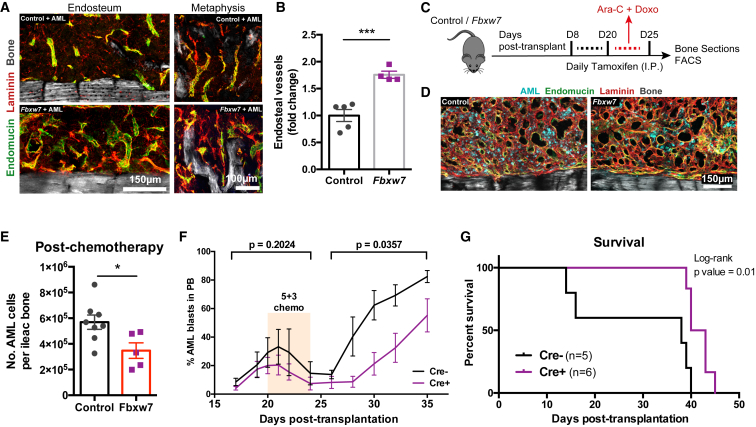
Bone marrow vascular niches sustain hematopoietic stem cells (HSCs) and are drastically remodeled in leukemia to support pathological functions. Acute myeloid leukemia (AML) cells produce angiogenic factors, which likely contribute to this remodeling, but anti-angiogenic therapies do not improve AML patient outcomes. Using intravital microscopy, we found that AML progression leads to differential remodeling of vasculature in central and endosteal bone marrow regions. Endosteal AML cells produce pro-inflammatory and anti-angiogenic cytokines and gradually degrade endosteal endothelium, stromal cells, and osteoblastic cells, whereas central marrow remains vascularized and splenic vascular niches expand. Remodeled endosteal regions have reduced capacity to support non-leukemic HSCs, correlating with loss of normal hematopoiesis. Preserving endosteal endothelium with the small molecule deferoxamine or a genetic approach rescues HSCs loss, promotes chemotherapeutic efficacy, and enhances survival. These findings suggest that preventing degradation of the endosteal vasculature may improve current paradigms for treating AML.

Keywords: acute myeloid leukemia; blood vessels; bone marrow; endosteum; hematopoietic stem cells; intravital microscopy; microenvironment; osteoblasts; transendothelial migration.


Figures

None
Graphical abstract
Figure 1
Figure 1
MLL-AF9-Driven Experimental AML Model and Intravital Microscopy (A) 100,000 primary mTomato (or YFP or non-labeled) and GFP double-positive AML cells are transplanted into non-irradiated secondary recipients, where they progressively infiltrate BM and spleen (n = 5 mice analyzed per time point). (B) AML blasts infiltrate and outcompete non-malignant, healthy BM cells over time. Data shown are from 5 leukemic mice per time point from 2 independent cohorts. Error bars represent mean ± SD. (C) Maximum projection of IVM tile scan image (composite of individual tiles) showing AML cells (mTomato+; red) interacting with non-malignant hematopoietic cells (YFP+; yellow) and the vascular microenvironment (Cy5-dextran+ blood vessels; cyan).
Figure 2
Figure 2
Intravital Imaging of the BM Reveals Blood Vessel Remodeling in AML (A) Flk1-GFP+ stromal cells (green) express high levels of CD31. (B) Representative maximum projection of a calvarial area showing Flk1-GFP+ ECs lining blood vessels highlighted by Cy-5-dextran. Blue, Cy-5-dextran; Green, Flk1-GFP+ cells. (C) Representative maximum projections and respective orthogonal views of Flk1-GFP+ vessels (green) in the BM, showing vessels from leukemic mice have reduced diameter and increased distance from bone (arrows). Gray, bone collagen second harmonic generation (SHG). (D) Representative 3D renderings of the surface of Flk1-GFP+ vessels (green) with the areas co-localizing with bone highlighted in pink. Dark blue in the background is bone. (E) The contact area between vessels and bone is significantly reduced in AML-infiltrated BM. Data in (B)–(E) are from 5 control and 4 AML mice. (F) Representative tile scan maximum projection (composite of individual tiles) of a Flk1-GFP mouse partially infiltrated with mTomato+ AML cells (red). Gray, bone collagen SHG. Time-lapse imaging shows steady and smooth vascular contours (red lines) in lightly infiltrated areas (P1). Instead, vessels in heavily infiltrated areas (P2) have irregular contours (red lines) and show active and inefficient sprouting (red arrows) over time. (G) Selected frames from representative time-lapse data from a heavily infiltrated area showing rapid vascular sprout formation (red arrows) and regression (full time-lapse: Movie S1). (H) VEGF-A levels in serum of control mice (C), mice with AML (AML), and mice with AML treated with combined cytarabine and doxorubicin (post-chemo). n = 4 mice per group. Error bars represent mean ± SEM.
Figure 3
Figure 3
Endosteal and Metaphyseal Vessels Are Decreased in AML (A) Representative maximum intensity projection of a tile scan (composite of individual tiles) of 20-μm-thick sections of undecalcified tibias from wild-type control (top) and fully infiltrated (bottom) mice. Vessels are labeled by laminin and endomucin (Emcn) immunostaining. dp, diaphysis; ed, endosteum; gp, growth plate; mp, metaphysis; soc, secondary ossification center. (B) Representative maximum intensity projections comparing vascular staining in the diaphysis, endosteum, and metaphysis of control (top row) and fully infiltrated (bottom row) mice. Blue, DAPI; gray, bone collagen SHG; green, endomucin+ vessels; red, laminin+ vessels and extracellular matrix. (C) Quantification of blood vessels in diaphysis, endosteum, and metaphysis at different stages of AML progression. Data were obtained from 11 mice with 0% infiltration (control), 3 mice with 0.2%–0.5% infiltration, 3 mice with 40%–50% infiltration, and 5–10 mice with 80%–95% infiltration from 2 independent cohorts. Error bars represent mean ± SD. (D) Representative images of BM trephine biopsies from control and AML patients stained with anti-von Willebrand factor antibody to mark blood vessels (brown). Yellow dotted lines delineate endosteal area within 20 μm from the bone. Yellow arrowheads point at endosteal vessels and black arrowheads at central marrow vessels. (E) Endosteal vessels are decreased in AML patients. Data were obtained from 6 control and 3 AML patients. Error bars represent mean ± SEM. (F) Central and endosteal AML cells were isolated and analyzed by RNA-seq. (G) Most of the variance in the data is explained by MDS dimensions 1 (60%) and 2 (21%). (H) Multi-dimensional scaling (MDS) plot of distances between gene expression profiles of AML cells and control GMPs. Each dot represents a sample. Data were obtained from 3 AML batches, 3 biological replicates per batch, and 9 control mice. (I) Heatmap of all the genes that are differentially regulated, with false detection rate (FDR) cutoff of 0.05. Gene expression is relative to GMP. (J and K) Gene set enrichment analysis (GSEA) comparing AML cells isolated from central and endosteal BM areas for genes involved in (J) inflammatory response and in (K) the TNF signaling pathway. (L) Volcano plot showing genes that are differentially expressed in endosteal and central AML cells. Red dots represent individual genes that are differentially expressed with a p value cutoff of 0.05. Cxcl2 is highlighted and is overexpressed in endosteal AML cells. (M) Expression of genes encoding cytokines known to inhibit angiogenesis. (N and O) CXCL2 (N) and TNF (O) levels in central and endosteal BM fluid fractions and in the serum of the same mice. Data were obtained from 9 control and 9 AML-burdened mice.
Figure 4
Figure 4
AML Remodels the Endosteal Niche and Outcompetes Normal Hematopoiesis (A) Representative tile scans (composite of individual tiles) of Col2.3-GFP mice transplanted with mTomato+ leukemia. Blue, Cy5-dextran+ blood vessels; green, Col2.3-GFP+ osteoblastic cells; red, mTomato+ AML. (B) Automated segmentation and volume calculation (voxels) of osteoblast loss (green line) and leukemia expansion (red line) over time. Data were obtained from 17 mice, from 2 independent cohorts. Error bars represent mean ± SEM. (C) Maximum intensity projection of a tile scan (composite of individual tiles) of a Col2.3-CFP recipient with mTomato+ healthy hematopoietic cells and YFP+GFP+ AML blasts. Leukemia cells (yellow) infiltrate the calvarium and deplete osteoblastic cells (cyan) and healthy hematopoietic cells (red) locally. (D) 2D slice from the area framed in (C) at a depth close to the calvarium surface, including the BM components from (C) and collagen bone SHG (gray). (C and D) Data were obtained from 6 mice. (E) IVM images of representative areas of the calvarium BM of control and AML-infiltrated Col2.3-CFP/Flk1-GFP double-transgenic mice. Cyan, Col2.3-GFP+ osteoblastic cells; gray, bone; green, Flk1-GFP+ ECs; red, mTomato+ AML cells. n = 3 mice. (F) Maximum intensity projection of a representative tile scan (composite of individual tiles) of undecalcified tibia sections from Col2.3-CFP recipients with mTomato+ healthy hematopoietic cells (red) and YFP+GFP+ AML (yellow) blasts. Blue, osteoblasts; cyan, vessels (endomucin+); gray, bone. Mice had intermediate levels of AML infiltration. Boxes in P1 and P2 higher magnification images illustrate examples of areas within the same bone with low, high, and intermediate levels of infiltration, used to quantify stroma remodeling. (G and H) Quantification of osteoblasts (G) and endosteal vessels (H). Data were obtained from 3 mice.
Figure 5
Figure 5
HSC Dynamics and Hematopoietic Cell Trafficking in BM and Spleen (A) Fold change in LKS cells and HSCs with increasing AML infiltration. HSCs are only lost at late time points, when endosteal remodeling is more dramatic. Data were obtained from 15 mice with 0%–25%, 5 mice with 25%–50%, 6 mice with 50%–75%, and 8 mice with 75%–100% AML infiltration, from 2 independent cohorts. Error bars represent mean ± SEM. (B) LKS cells are significantly decreased in both the diaphysis (Dp flushed) and in the trabecular bone-rich metaphysis (Mp crushed) of AML-burdened mice, with no differences between these two fractions. (C) HSCs are significantly lost in the metaphysis of AML-burdened mice. Data were obtained from 3 control and 4 leukemic mice. Error bars represent mean ± SD. (D) Paired analysis shows a negative correlation between HSC numbers in spleen and BM (1 femur, 2 tibias, and 2 ileac bones). (E) LKS cells and HSC numbers increase in the spleen during AML progression. Data were obtained from 7 mice with 0%–25%, 3 mice with 25%–50%, 2 mice with 50%–75%, and 3 mice with 75%–100% BM infiltration. Error bars represent mean ± SEM. (F) Mice burdened with AML have significantly increased absolute cell numbers of CD31+ ECs in the spleen. Data were obtained from 4 control and 5 leukemic mice. Error bars represent mean ± SEM. (G) Time-lapse in vivo imaging revealed that, in AML-burdened mice, residual healthy mTomato+ cells had increased adhesion to the luminal endothelial surface, particularly in leukemic spleens, when normalized by the frequency of surviving cells (e.g., once divided by 0.699 in a mouse with 30.1% blasts in the BM). (H) Examples of healthy tomato+ cells maintaining stable (static) or transient (crawling) adhesion to the splenic endothelium. (I) We observed a significant increase of healthy mTomato+ cells undergoing transendothelial migration (TEM) in the BM of AML-burdened mice, once normalized for the infiltration level. (J) Examples of cells migrating from the tissue to the vascular lumen (intravasation) and in the opposite direction (extravasation) are shown. (C and E) Blue, Cy5-dextran; green, Flk1-GFP+ ECs; red, mTomato+ healthy hematopoietic cells. Data were obtained from the analysis of 521 (BM) and 588 (spleen) tomato+ cells from 3 control and 3 leukemic mice. Error bars represent mean ± SEM.
Figure 6
Figure 6
The Endosteal Remodeling in AML Regulates HSC Numbers (A) 12,000 sort-purified HSCs were labeled with DiD and transplanted into irradiated control or AML-recipient mice. 2 days after transplantation, DiD+ HSCs resident in the BM were quantified by flow cytometry. (B) Homing of transplanted DiD+ HSCs was significantly impaired in the BM of AML-burdened mice. n = 3 control and 3 leukemic mice. (C) DFO treatment regimen. (D–F) DFO did not affect the total number of AML cells (D) but increased the number of endosteal vessels (E and F). Blue, AML cells; gray, collage bone SHG; green, endomucin+ vessels; red, laminin+ vessels and extracellular matrix. Each dot is a mouse. (G) AML-burdened mice treated with DFO had more HSCs remaining in the metaphysis in comparison to controls. (H) Quantification of flow cytometry analysis of DFO treated and control (PBS) mice, showing similar numbers of HSCs in the diaphysis (Dp flushed) but a significant increase of HSCs remaining in the metaphysis (Mp crushed). Data are representative of (G) and obtained from (H) 4 mice treated with PBS and 5 treated with DFO. (I) Mice transplanted with AML cells were treated with either PBS or DFO. At full infiltration, mice were lethally irradiated and transplanted with DiD-labeled HSCs that had not been exposed to DFO. (J) DFO improves the homing of transplanted DiD+ HSCs in the BM of AML-burdened mice. Data were obtained from 4 recipients treated with PBS and 4 recipients treated with DFO. In (B–J), error bars represent mean ± SEM.
Figure 7
Figure 7
Rescue of Endosteal Vessels Increases Induction Chemotherapy Efficiency (A) Immunofluorescence staining of endosteal areas showing a significant increase of blood vessels in Fbxw7iΔEC mutants infiltrated with AML. Gray, bone collagen SHG; green, endomucin+ vessels; red, laminin+ vessels and extracellular matrix. (B) Quantification of the results obtained from 5 control mice and 4 Fbxw7iΔEC mice. (C) Scheme of treatment regimen used to delete Fbxw7 in ECs. (D) Maximum projections of immunofluorescence staining of representative endosteal areas showing dilated blood vessels (green, endomucin; red, laminin) after therapy in both control and mutant animals, as well as surviving AML cells (cyan) scattered through the tissue. Data are representative of 3 control mice and 3 Fbxw7iΔEC mutants. (E) After chemotherapy, there was a significant decrease of surviving AML cells in Fbxw7iΔEC mutants, where the endosteal vessels had been rescued. Data were obtained from 8 control mice and 5 Fbxw7iΔEC mutants. (F) Although disease progression before chemotherapy is similar, relapse is delayed in Fbxw7iΔEC mutants. n = 3 Cre and 6 Cre+ mice. (G) Kaplan-Meyer curve showing improved survival in treated Fbxw7iΔEC mutants transplanted with AML. n = 5 Cre and 6 Cre+ mice. In (B–F), error bars represent mean ± SEM.

Comment in

References

    1. Aguayo A., Kantarjian H., Manshouri T., Gidel C., Estey E., Thomas D., Koller C., Estrov Z., O’Brien S., Keating M. Angiogenesis in acute and chronic leukemias and myelodysplastic syndromes. Blood. 2000;96:2240–2245. - PubMed
    1. Aster J.C., Xu L., Karnell F.G., Patriub V., Pui J.C., Pear W.S. Essential Roles for Ankyrin Repeat and Transactivation Domains in Induction of T-Cell Leukemia by Notch1. Mol. Cell. Biol. 2000;20:7505–7515. - PMC - PubMed
    1. Bixel M.G., Kusumbe A.P., Ramasamy S.K., Sivaraj K.K., Butz S., Vestweber D., Adams R.H. Flow dynamics and HSPC homing in bone marrow microvessels. Cell Rep. 2017;18:1804–1816. - PMC - PubMed
    1. Callens C., Coulon S., Naudin J., Radford-Weiss I., Boissel N., Raffoux E., Wang P.H., Agarwal S., Tamouza H., Paubelle E. Targeting iron homeostasis induces cellular differentiation and synergizes with differentiating agents in acute myeloid leukemia. J. Exp. Med. 2010;207:731–750. - PMC - PubMed
    1. Cao Y., Chen C., Weatherbee J.A., Tsang M., Folkman J. gro-beta, a -C-X-C- chemokine, is an angiogenesis inhibitor that suppresses the growth of Lewis lung carcinoma in mice. J. Exp. Med. 1995;182:2069–2077. - PMC - PubMed

Publication types