. 2018 Jan 10;23(1):54-64.e6.
doi: 10.1016/j.chom.2017.11.006. Epub 2017 Dec 21.

Dysbiosis-Associated Change in Host Metabolism Generates Lactate to Support Salmonella Growth

Affiliations

Dysbiosis-Associated Change in Host Metabolism Generates Lactate to Support Salmonella Growth

Caroline C Gillis et al. Cell Host Microbe. .

Erratum in

Abstract

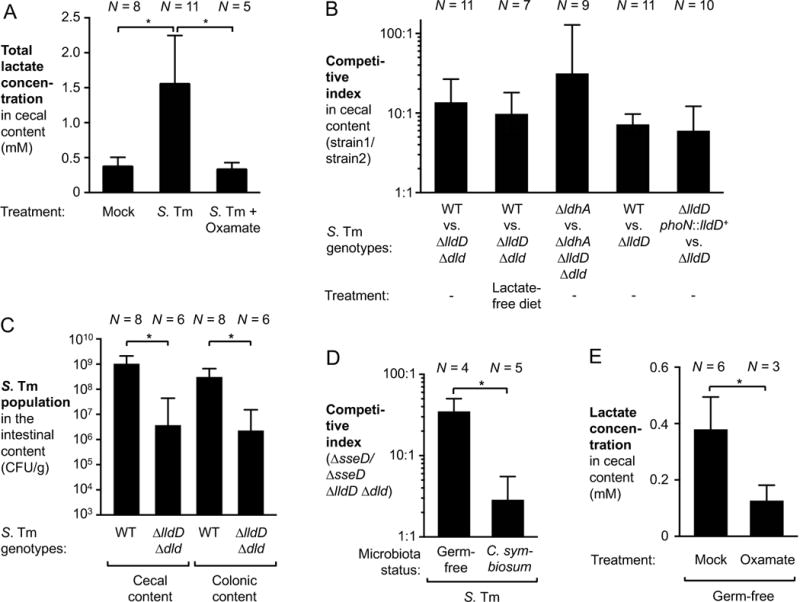
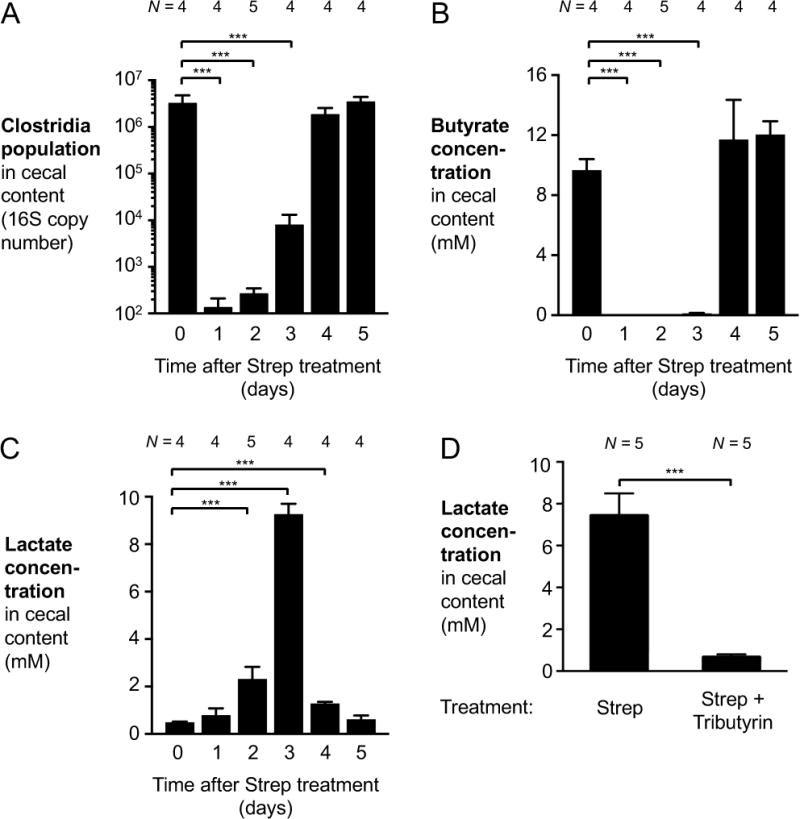
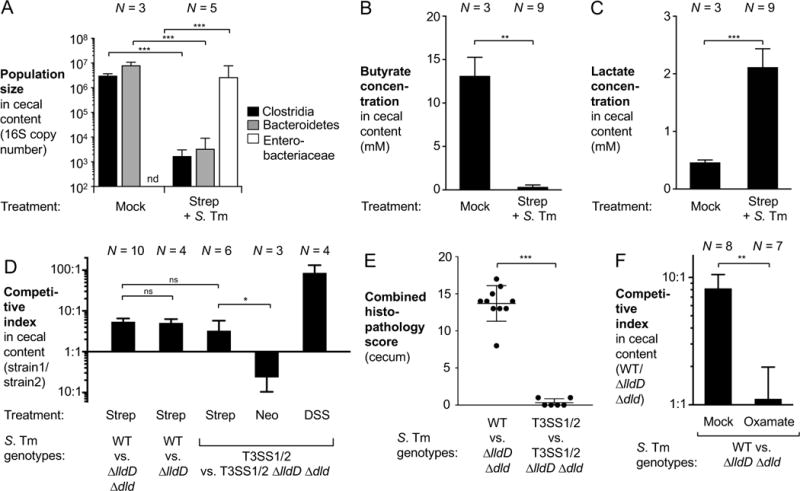
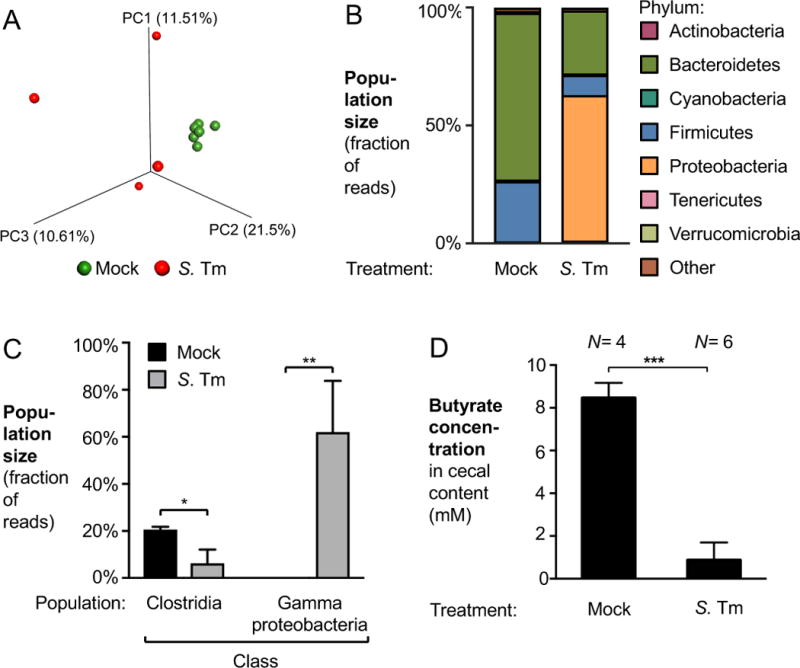
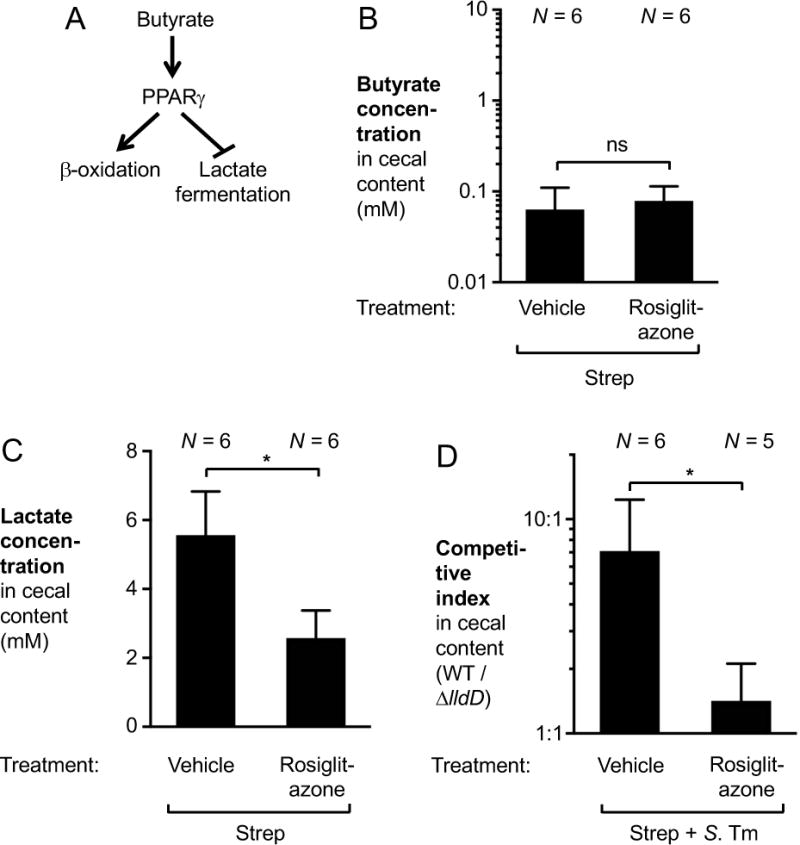
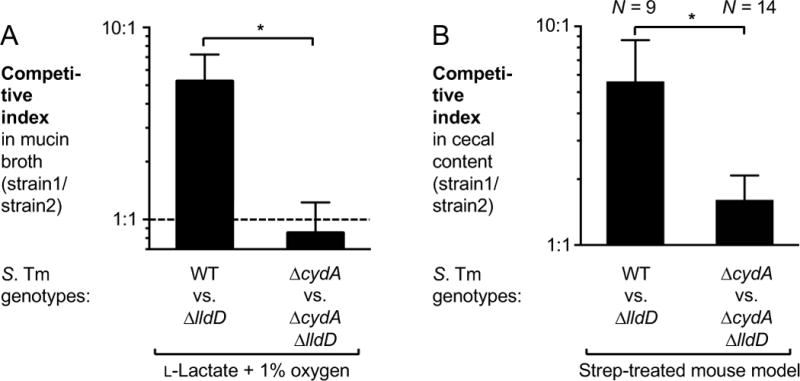
During Salmonella-induced gastroenteritis, mucosal inflammation creates a niche that favors the expansion of the pathogen population over the microbiota. Here, we show that Salmonella Typhimurium infection was accompanied by dysbiosis, decreased butyrate levels, and substantially elevated lactate levels in the gut lumen. Administration of a lactate dehydrogenase inhibitor blunted lactate production in germ-free mice, suggesting that lactate was predominantly of host origin. Depletion of butyrate-producing Clostridia, either through oral antibiotic treatment or as part of the pathogen-induced dysbiosis, triggered a switch in host cells from oxidative metabolism to lactate fermentation, increasing both lactate levels and Salmonella lactate utilization. Administration of tributyrin or a PPARγ agonist diminished host lactate production and abrogated the fitness advantage conferred on Salmonella by lactate utilization. We conclude that alterations of the gut microbiota, specifically a depletion of Clostridia, reprogram host metabolism to perform lactate fermentation, thus supporting Salmonella infection.

Keywords: Salmonella; gut microbiota; host metabolism during infection; host-microbe interaction; microbial metabolism.


Figures

Figure 1
Figure 1. The host is a source of lactate during S. Tm infection
(A) Groups of Swiss Webster mice were inoculated with the S. Tm wild-type strain (WT) or mock-treated with LB broth. One group of S. Tm-infected mice received 0.5 % sodium oxamate in their drinking water for the duration of the experiment. After 8 days of infection the mice were sacrificed and lactate concentration in the cecal content analyzed by GC/MS/MS. (B) Groups of Swiss Webster mice were intragastrically inoculated with a 1:1 ratio of the indicated S. Tm strains. Samples were collected 8 days after infection. Competitive indices were calculated using the relative abundance of each strain in the cecal content, corrected by the ratio in the inoculum. (C) Two groups of Swiss Webster mice were intragastrically infected with the S. Tm wild-type strain or the ΔlldD Δdld mutant, respectively. The S. Tm populations in the cecal and colonic content (CFU/g) was determined after 8 days. (D) Groups of germ-free mice were pre-colonized with C. symbiosum or were mock-treated. After 3 days, both groups were intragastrically inoculated with an equal mixture of a ΔsseD and a ΔsseD ΔlldD Δdld mutant. Cecal content was collected 10 days after infection to determine the CI. (E) Germ-free Swiss Webster mice were treated with oxamate in their drinking water for 2 days or were mock-treated. Lactate concentrations in the cecal content were quantified by GC/MS/MS. Bars represent geometric means ± standard error. *, P < 0.05. The number of animals per group (N) is indicated above each bar. See also Fig. S1 – S4.
Figure 2
Figure 2. Perturbation of the gut microbiota by oral streptomycin treatment results in elevated lactate levels
(A–C) Groups of C57BL/6 mice received a single oral dose of streptomycin (Strep). Samples of cecal content were taken 1 to 5 days after streptomycin administration. Mock-treated controls represent the 0-day time point. (A) qPCR analysis of DNA extracted from the cecal content to assess Clostridia populations in the microbiota. (B and C) The concentration of butyrate (B) and lactate (C) in the cecal content was quantified by GC/MS. (D) Groups of C57BL/6 mice were treated with a single dose of streptomycin. Animals then received oral tributyrin treatment through gavage and fortified chow, or were mock-treated. Lactate levels in the cecal content were measured 3 days after streptomycin treatment. Bars represent geometric means ± standard error. ***, P < 0.001. The number of animals per group (N) is indicated above each bar.
Figure 3
Figure 3. S. Tm utilizes lactate during post-antibiotic expansion
(A–C) Groups of C57BL/6 mice, pretreated with a single dose of oral streptomycin (Strep) were infected with the S. Tm wild-type strain (WT) or were mock-treated. Five days after infection, cecal content was collected for analysis. (A) 16S qPCR analysis of Clostridia, Bacteroidetes, and Enterobacteriaceae populations in the cecal microbiota. (B – C) Concentrations of butyrate (B) and lactate (C) in the cecal content were measured by targeted GC/MS. (D–E) C57BL/6 mice were pretreated with a single dose of streptomycin (Strep), neomycin (Neo), or 4 days of dextran sulfate sodium (DSS) treatment and were subsequently infected with an equal mixture of the indicated S. Tm strains through the intragastric route. DSS treatment was continued throughout the duration of the experiment, as indicated. Five days after infection, samples were collected for analysis. T3SS1/2, ΔinvA ΔspiB mutant. See also Fig. S5E. (D) Competitive indices of the indicated strains in the cecal content. (E) Combined histopathology score of cecal tissue. Each dot represents one animal while lines represent the average ± standard deviation. See also Fig. S5A – C. (F) Streptomycin-pretreated mice, infected with the S. Tm wild-type strain and the ΔlldD Δdld mutant, were treated with sodium oxamate in the drinking water or mock treated beginning one day after infection until the end of the experiment. The competitive index in the cecal content was determined 4 days after infection. See also Fig. S5E. Bars represent geometric means ± standard error. *, P < 0.05; **, P < 0.01; ***, P < 0.001; ns, not statistically significant; nd, not detected. The number of animals per group (N) is indicated above each bar.
Figure 4
Figure 4. Gut microbiota changes during S. Tm infection
(A – C) Groups of Swiss Webster mice were intragastrically infected with the S. Tm wild-type strain (WT) or mock-treated. Eight days after infection, cecal content was collected for 16S rDNA profiling. (A) Principal coordinate (PC) plot of unweighted UniFrac distances generated from cecal microbial communities. Mock treatment, green spheres; S. Tm infection, red spheres. (B) Cecal microbiota composition at the phylum level. (C) Abundance of the classes Clostridia and Gammaproteobacteria in the ceca of mock-treated (black bars) and S. Tm-infected mice (gray bars). In mock-treated animals, Gammaproteobacteria were detected at very low abundance (less than 0.15%) (D) Swiss Webster mice were infected as described above. Butyrate concentrations in the cecal contents were determined 8 days after infection using GC/MS. See also Fig. 1A. Bars represent geometric means ± standard error. *, P < 0.05; **, P < 0.01; ***, P < 0.001. The number of animals per group (N) is indicated above each bar.
Figure 5
Figure 5. Effect of PPARγ signaling on lactate availability during S. Tm colitis
(A) Schematic model of the effect of PPARγ on host cell metabolism. (B and C) Groups of C57BL/6 mice were given a single oral dose of streptomycin (Strep). The following day, rosiglitazone or vehicle (50 % DMSO in PBS) was administered intraperitoneally. Concentrations of butyrate (B) and lactate (C) in the cecal content were measured by GC/MS the day after. (D) Groups of streptomycin-pretreated C57BL/6 mice were infected with an equal mixture of the S. Tm wild-type strain and a ΔlldD mutant for 5 days. Rosiglitazone or vehicle control was administered intraperitoneally for the last 3 days of infection. Bars represent geometric means ± standard error. *, P < 0.05; ns, not statistically significant. The number of animals per group (N) is indicated above each bar.
Figure 6
Figure 6. Impact of aerobic respiration on lactate utilization in S. Tm
(A) Mucin broth supplemented with L-lactate was inoculated with an equal mixture of the S. Tm wild-type strain (WT) and a ΔlldD mutant or a ΔcydA and a ΔcydA ΔlldD mutant and incubated in a Coy chamber with 1% oxygen. Fitness was measured by determining the competitive index. The experiment was performed independently at least four times. (B) Groups of C57BL/6 mice were pre-treated with streptomycin (Strep) and subsequently infected with the indicated S. Tm strains. Five days after infection, cecal content was collected to determine the competitive index. Bars represent geometric means ± standard error. *, P < 0.05. The number of animals per group (N) is indicated above each bar. See also Fig. S5D.

Comment in

References

    1. Ackermann M, Stecher B, Freed NE, Songhet P, Hardt WD, Doebeli M. Self-destructive cooperation mediated by phenotypic noise. Nature. 2008;454(7207):987–990. doi: 10.1038/nature07067. - DOI - PubMed
    1. Adachi M, Kurotani R, Morimura K, Shah Y, Sanford M, Madison BB, Gumucio DL, Marin HE, Peters JM, Young HA, et al. Peroxisome proliferator activated receptor gamma in colonic epithelial cells protects against experimental inflammatory bowel disease. Gut. 2006;55(8):1104–1113. doi: 10.1136/gut.2005.081745. Published online 2006/03/21. - DOI - PMC - PubMed
    1. Ahmad MS, Krishnan S, Ramakrishna BS, Mathan M, Pulimood AB, Murthy SN. Butyrate and glucose metabolism by colonocytes in experimental colitis in mice. Gut. 2000;46(4):493–499. Published online 2000/03/15. - PMC - PubMed
    1. Ali MM, Newsom DL, Gonzalez JF, Sabag-Daigle A, Stahl C, Steidley B, Dubena J, Dyszel JL, Smith JN, Dieye Y, et al. Fructose-asparagine is a primary nutrient during growth of Salmonella in the inflamed intestine. PLoS Pathog. 2014;10(6):e1004209. doi: 10.1371/journal.ppat.1004209. Published online 2014/06/27. - DOI - PMC - PubMed
    1. Augoff K, Hryniewicz-Jankowska A, Tabola R. Lactate dehydrogenase 5: an old friend and a new hope in the war on cancer. Cancer Lett. 2015;358(1):1–7. doi: 10.1016/j.canlet.2014.12.035. Published online 2014/12/22. - DOI - PubMed

MeSH terms