

Assessing the Relationship Between Social Vulnerability and Community Resilience to Hazards
- PMID: 29276330
- PMCID: PMC5739329
- DOI: 10.1007/s11205-014-0698-3
Assessing the Relationship Between Social Vulnerability and Community Resilience to Hazards
Abstract
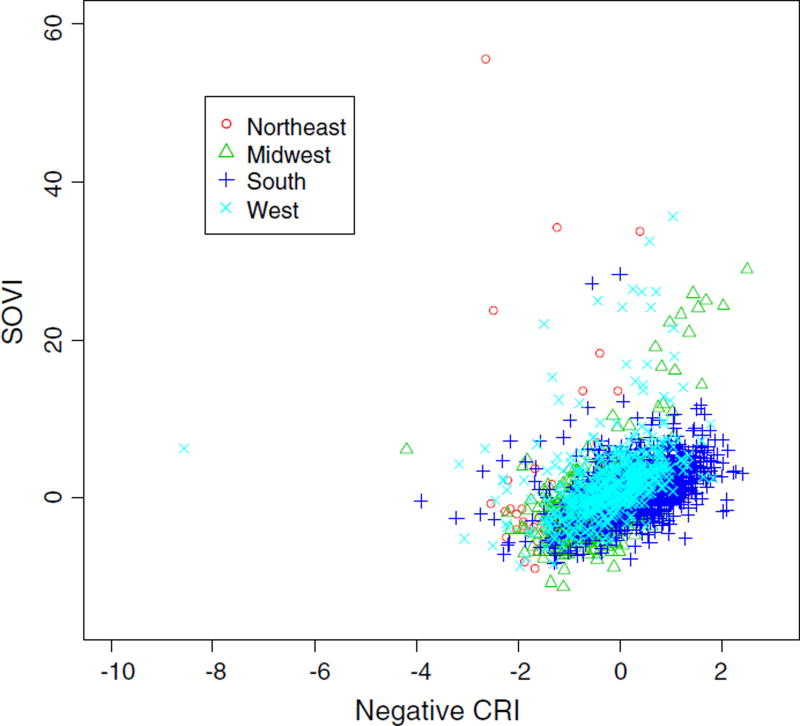
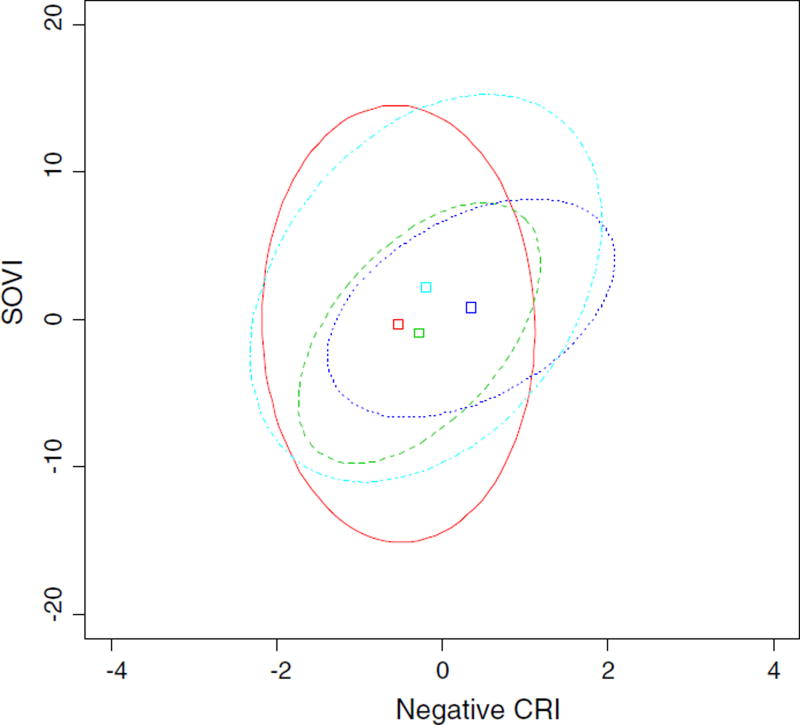
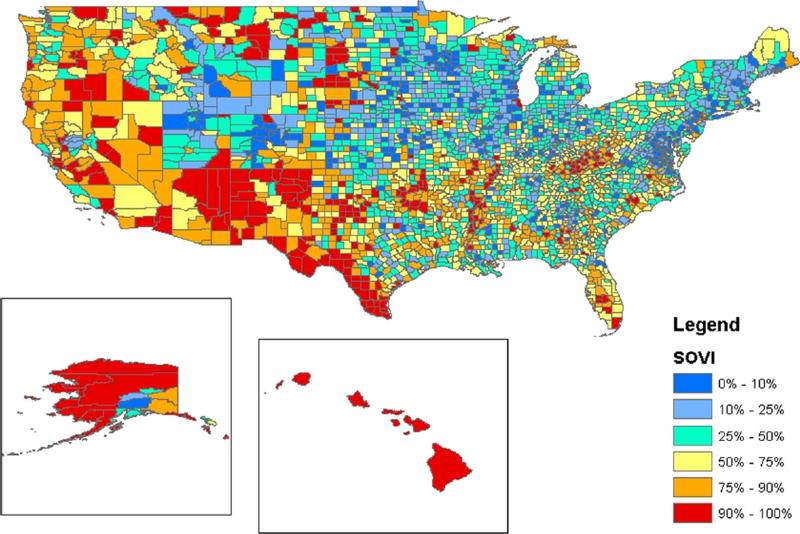
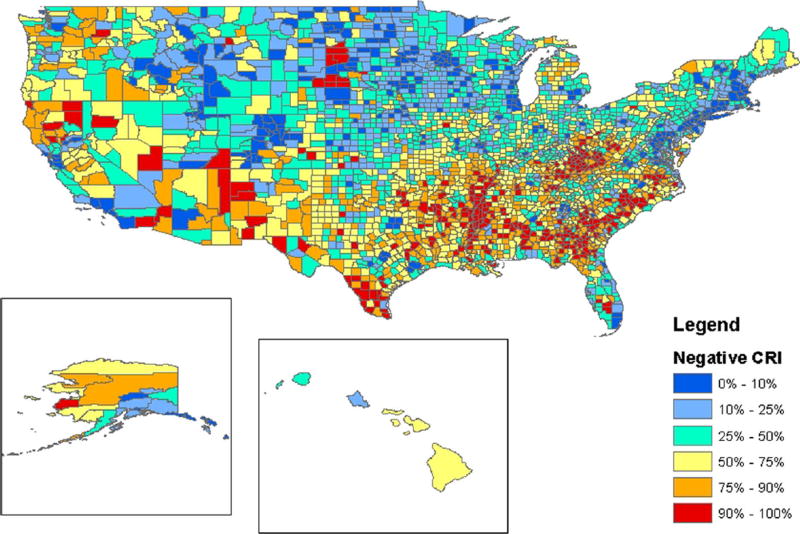
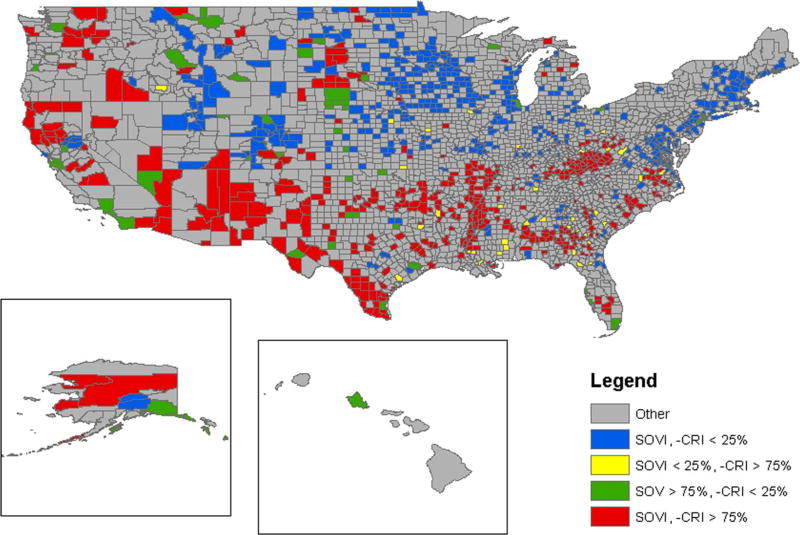
This article contributes to the disaster literature by measuring and connecting two concepts that are highly related but whose relationship is rarely empirically evaluated: social vulnerability and community resilience. To do so, we measure community resilience and social vulnerability in counties across the United States and find a correlation between high levels of vulnerability and low levels of resilience, indicating that the most vulnerable counties also tend to be the least resilient. We also find regional differences in the distribution of community resilience and social vulnerability, with the West being particularly vulnerable while the Southeast is prone to low levels of resilience. By looking at both social vulnerability and community resilience, we are able to map communities' social risks for harm from threats as well as their capacities for recovering and adapting in the aftermath of hazards. This provides a more complete portrait of the communities that might need the most assistance in emergency planning and response, as well as whether such interventions will need to be tailored toward reducing damage or finding the path to recovery.
Keywords: Community resilience; Disasters; Hazard indicators; Social vulnerability.
Figures
References
-
- Adger WN. Social vulnerability to climate change and extremes in coastal Vietnam. World Development. 1999;27:249–269.
-
- Alwang J, Siegel PB, Jorgensen SL. Vulnerability: A view from different disciplines. Washington, DC: World Bank Social Protection Discussion Paper Series, No. 115; 2001.
-
- Brooks N, Adger WN, Kelly PM. The determinants of vulnerability and adaptive capacity at the national level and the implications for adaptation. Global Environmental Change. 2005;15:151–163.
-
- Bruneau M, Chang SE, Eguchi RT, Lee GC, O’Rourke TD, Reinhorn AM, et al. A framework to quantitatively assess and enhance the seismic resilience of communities. Earthquake Spectra. 2003;19:733–752. doi: 10.1193/1.1623497. - DOI
-
- Coles E, Buckle P. Developing community resilience as a foundation for effective disaster recovery. Australian Journal of Emergency Management. 2004;19:6–15.
Grants and funding
LinkOut - more resources
Full Text Sources
Other Literature Sources