Review
. 2017 Dec 8:11:98.
doi: 10.3389/fncir.2017.00098. eCollection 2017.

Critical Points and Traveling Wave in Locomotion: Experimental Evidence and Some Theoretical Considerations

Affiliations
Review

Critical Points and Traveling Wave in Locomotion: Experimental Evidence and Some Theoretical Considerations

Philippe Saltiel et al. Front Neural Circuits. .

Abstract

The central pattern generator (CPG) architecture for rhythm generation remains partly elusive. We compare cat and frog locomotion results, where the component unrelated to pattern formation appears as a temporal grid, and traveling wave respectively. Frog spinal cord microstimulation with N-methyl-D-Aspartate (NMDA), a CPG activator, produced a limited set of force directions, sometimes tonic, but more often alternating between directions similar to the tonic forces. The tonic forces were topographically organized, and sites evoking rhythms with different force subsets were located close to the constituent tonic force regions. Thus CPGs consist of topographically organized modules. Modularity was also identified as a limited set of muscle synergies whose combinations reconstructed the EMGs. The cat CPG was investigated using proprioceptive inputs during fictive locomotion. Critical points identified both as abrupt transitions in the effect of phasic perturbations, and burst shape transitions, had biomechanical correlates in intact locomotion. During tonic proprioceptive perturbations, discrete shifts between these critical points explained the burst durations changes, and amplitude changes occurred at one of these points. Besides confirming CPG modularity, these results suggest a fixed temporal grid of anchoring points, to shift modules onsets and offsets. Frog locomotion, reconstructed with the NMDA synergies, showed a partially overlapping synergy activation sequence. Using the early synergy output evoked by NMDA at different spinal sites, revealed a rostrocaudal topographic organization, where each synergy is preferentially evoked from a few, albeit overlapping, cord regions. Comparing the locomotor synergy sequence with this topography suggests that a rostrocaudal traveling wave would activate the synergies in the proper sequence for locomotion. This output was reproduced in a two-layer model using this topography and a traveling wave. Together our results suggest two CPG components: modules, i.e., synergies; and temporal patterning, seen as a temporal grid in the cat, and a traveling wave in the frog. Animal and limb navigation have similarities. Research relating grid cells to the theta rhythm and on segmentation during navigation may relate to our temporal grid and traveling wave results. Winfree's mathematical work, combining critical phases and a traveling wave, also appears important. We conclude suggesting tracing, and imaging experiments to investigate our CPG model.

Keywords: Winfree’s phase singularities; central pattern generator; critical point shifts; hippocampus; locomotion; spinal cord; temporal grid; traveling wave.


Figures

Figure 1
Figure 1
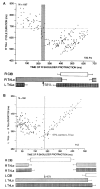
Critical point in the cat locomotor cycle identified with phasic R shoulder retractions. (A) Effect on R TriLo cycle duration, according to the time of retraction measured from R TriLo onset. (B) Effect on L TriLo cycle duration, with retraction time measured from L TriLo onset. Boxes below the graphs show the unperturbed cycle structure, and help to visualize when the perturbation was applied. Together these two graphs identified a critical point centered at the transition from R ClB to R TriLo, which corresponds in real locomotion to the transition between swing and stance. This corresponds to critical point D in Figure 3. ClB, Cleidobrachialis (shoulder protractor and elbow flexor); TriLo, long head of Triceps (shoulder retractor and elbow flexor); TriLa, lateral head of triceps (pure elbow extensor). Dotted lines indicate control cycle duration. Reproduced with permission from Saltiel and Rossignol (2004a).
Figure 2
Figure 2
Two other critical points in the cat locomotor cycle, identified with phasic R shoulder protractions. (A) Effect on R TriLo cycle duration, according to the time of protraction measured from R TriLo onset. There is a critical point at ~58% of R TriLo burst, where the effect on the cycle abruptly changes from lengthening to shortening. The dotted line indicates control cycle duration. This critical point is labeled C in Figure 3. (B) Effect on the L TriLo onset to R TriLo onset interval (essentially L stance onset to R stance onset). The dotted line indicates the control duration of that interval. There is a critical point at 40% of L TriLo burst, past which the advance in R TriLo onset by R shoulder protractions follows a linear relationship. This critical point is labeled B in Figure 3. It is also noted on the ordinate, that at this critical point B, the R TriLo onset is advanced to ~57% of the control L TriLo burst, that is point D is advanced to point C (more precisely to the symmetrical point C, half-a-cycle away from the point C identified in A). Reproduced with permission from Saltiel and Rossignol (2004a).
Figure 3
Figure 3
Structure of the fictive cat locomotor cycle, and location of critical points. Note the different burst shape of TriLo and TriLa, with an inflection point in TriLa, on which this average is synchronized. The location of critical points B, C and D identified in Figures 1, 2 is indicated in both half-cycles by vertical lines. Critical point B is at ~40% of TriLo burst. Critical point C is at ~55% of TriLo burst, and simultaneously coincides with the inflection in TriLa, and the onset of descent in the contralateral ClB. Critical point D is at TriLo onset/end of ClB. Reproduced with permission from Saltiel and Rossignol (2004a).
Figure 4
Figure 4
Effect of tonic protraction and tonic extension: shifts in critical points. Averages of the control (thin line, with dotted lines one standard deviation (SD) away) and perturbed (thick, darker line) cycles are synchronized on R ClB onset. Vertical lines are drawn at the same times in (A,B), corresponding to the critical points in the control cycle shown in Figure 3. (A) Tonic protraction shortens R ClB and prolongs R TriLo. R TriLo onset is shifted from D to D’, but D’ corresponds to the time of point C in the control cycle. The onset of descent of R ClB is shifted from C to C’, but C’ corresponds to the time of point B in the control cycle. (B) Tonic extension increases R ClB amplitude, starting at point B, and prolongs R ClB. The onset of descent of R ClB is shifted from C to C’, but C’ corresponds to the time of point D in the control cycle. These shifts between critical points suggest that a temporal “grid” is preserved during the changes in burst durations produced by the tonic perturbations. Reproduced with permission from Saltiel and Rossignol (2004b).
Figure 5
Figure 5
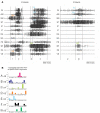
Identification of synergies entering in the composition of EMG patterns elicited by N-methyl-D-Aspartate (NMDA) iontophoresis in the frog spinal cord. (A) Examples of EMG patterns from 12 recorded muscles in the hindlimb. Visually comparing many such patterns, and how they evolve in time, led to the distinct impression that they are made of smaller subunits, indicated with different colors. (B) This was formally demonstrated with a computational algorithm which extracted a set of seven muscle synergies whose combinations reconstructed the EMG patterns. These synergies are labeled A to G (color code similar to the one used in A). Their main biochemical action is indicated: AE, ankle extensor; HE, hip extensor; KF, knee flexor; KE, knee extensor; HF, hip flexor. Muscle abbreviations: RI, rectus internus; AM, adductor magnus; SM, semimembranosus; ST, semitendinosus; IP, iliopsoas; VI, vastus internus; RA, rectus anterior; GA, gastrocnemius; PE, peroneus; BF, biceps femoris; SA, Sartorius; VE, vastus externus. Reproduced with permission from Saltiel et al. (2001, 2016).
Figure 6
Figure 6
Synergy sequence in frog locomotion, and comparison with the NMDA-evoked caudal extension-lateral force-flexion cycle. Stance and swing, or caudal extension-lateral force and flexion are each divided in five equal bins. (A) Reconstruction of a step with NMDA synergies, illustrating the A-B-G-A-F-E-G synergy sequence. (B) The mean times of synergy activation peaks are shown in angular histograms for the NMDA and the locomotor cycle. The difference between B and G during stance was a bit less striking when including frog f10, but remained strongly significant. (C) Time course of synergy activations shown in averages. Again a similar A-B-G-A-F-E-G synergy sequence is seen in the NMDA caudal extension-lateral force-flexion cycle, and locomotion. Averages are shown twice side-by-side to better visualize the phase transitions. Symbols above traces represent one SD. Reproduced with permission from Saltiel et al. (2016).
Figure 7
Figure 7
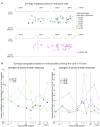
Synergy topography in the frog spinal cord. (A) Location of the spinal cord sites encoding individual synergies. Upper panel: a site was considered to encode synergy B, C, D, E, F, or G when activation of that synergy in the initial responses exceeded each of the other five synergies by a ratio ≥1.733 (arctangent ≤ 30°). Any amount of synergy A was allowed. Lower panel: a site encoded synergy A when its activity in the initial responses exceeded each of the other six synergies by a ratio ≥1.733. (B) Rostrocaudal topography of synergies A-G based on the second to tenth set of responses in the NMDA-evoked output. One-hundred and ten sites were divided rostrocaudally in 10 bins. Numbers identify the bin centers, and the 7th, 8th and 9th dorsal roots locations are indicated. For each bin, the percentages that synergies A–G contributed to the second to tenth set of responses at each site were pooled together, averaged and plotted. Symbols above and below traces represent one SD. SDs were 35.5 and 17.5% at bins 6 and 4 for synergy A, 32 and 7.3% at bins 4 and 10 for synergy C, and 35.2 and 13.8% at bins 10 and 1 for synergy E. Reproduced with permission from Saltiel et al. (2016).
Figure 8
Figure 8
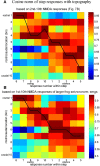
Comparison between the synergy composition of successive responses in the locomotor cycle, and synergy rostrocaudal topography. (A) Cosine angle between the average synergy composition of step responses (6–10, swing and 1–5, stance), and the 10 bins synergy topography based on the second to tenth NMDA responses (Figure 7B). The normalized dot products between the seven-synergy vector of each step response and the seven-synergy vectors for each rostrocaudal bin are plotted in pseudocolor. The black line joins the highest matches between the step responses and the synergy topography (highest cosine angle). (B) Similar analysis, but with the topography based on non-normalized NMDA EMGs (same as for locomotion), the first to tenth NMDA responses, and an additional frog set (total of 168 sites). Both plots suggest a rostrocaudal progression of activity along the step cycle. Reproduced with permission from Saltiel et al. (2016).
Figure 9
Figure 9
The effect of stimulus delivered at critical phases, examined in space, according to Winfree’s work. A traveling wave from right to left establishes a phase gradient in the rectangular space of tissue. The wavefronts (shaded regions) delimit in space, a cycle divided in equal intervals, as indicated by the isochrons labeled from 0 to 12. The isochron number indicates how long ago the wavefront has passed that location in space. The location of critical phases in the cycle is known from experiments on the effect of depolarizing and hyperpolarizing stimuli given at different times in a space-clamped situation (e.g., firing squid axon). These critical phases are at ~38% and ~88% of the cycle according to Winfree, chapter 4 (his Figures 4.1–4.5, and 4.9), which is also what we found for the effect of phasic protractions and retractions on the ipsilateral TriLo cycle. In the rectangular space, these correspond to the locations between isochrons 4–5, and isochrons 10–11, as indicated by vertical dashed lines in (A,C) respectively. Note that in order to respect these critical phase locations, the wavefronts in (A,B) have been moved 3 isochrons earlier in their trajectory, compared to Winfree’s original figures (Figures 6.1 and 6.2 in his 1987 book, chapter 6); and the wavefront in (C) has been moved 2 isochrons earlier in its trajectory, compared to the original figure (Winfree, , Figure 7.13). According to Winfree’s work, after delivery of a radially-decaying stimulus (applied at black dot inside dashed circle in A or C), a pair of rotors is established at the intersection between the critical phase (vertical dashed line), and critical stimulus (dashed circle), as shown in (B) for a depolarizing stimulus. In the region of space between the 2 rotors, the isochrons have changed from 4–5 to 10–11, while elsewhere they are much less or not modified. This work from Winfree suggests a potentially interesting interaction between our two experimental results of critical points, and a traveling wave in locomotion. Tentatively, the phase gradient set up rostrocaudally in the spinal cord by a traveling wave, means that the critical points, defined in the time domain, translate into critical locations in the space domain. At these critical locations, afferent inputs could set up phase singularities (rotors), with seemingly consequences on the organization of time in the different spinal cord regions encoding different synergies. Adapted with permission from Winfree (1987), Figures 6.1, 6.2, 7.13.

Similar articles

Cited by

References

    1. Beier K. T., Saunders A. B., Oldenburg I. A., Sabatini B. L., Cepko C. L. (2013). Vesicular stomatitis virus with the rabies virus glycoprotein directs retrograde transsynaptic transport among neurons in vivo. Front. Neural Circuits 7:11. 10.3389/fncir.2013.00011 - DOI - PMC - PubMed
    1. Best E. N. (1979). Null space in the Hodgkin-Huxley equations: a critical test. Biophys. J. 27, 87–104. 10.1016/s0006-3495(79)85204-2 - DOI - PMC - PubMed
    1. Bieri K. W., Bobbitt K. N., Colgin L. L. (2014). Slow and fast γ rhythms coordinate different spatial coding modes in hippocampal place cells. Neuron 82, 670–681. 10.1016/j.neuron.2014.03.013 - DOI - PMC - PubMed
    1. Bizzi E., Hogan N., Mussa-Ivaldi F. A., Giszter S. F. (1992). Does the nervous system use equilibrium-point control to guide single and multiple joint movements? Behav. Brain Sci. 15, 603–613. 10.1017/S0140525X00072538 - DOI - PubMed
    1. Bizzi E., Mussa-Ivaldi F. A., Giszter S. F. (1991). Computations underlying the execution of movement: a biological perspective. Science 253, 287–291. 10.1126/science.1857964 - DOI - PubMed

Publication types

MeSH terms

LinkOut - more resources