

Biofilm Surface Density Determines Biocide Effectiveness
- PMID: 29276508
- PMCID: PMC5727120
- DOI: 10.3389/fmicb.2017.02443
Biofilm Surface Density Determines Biocide Effectiveness
Abstract
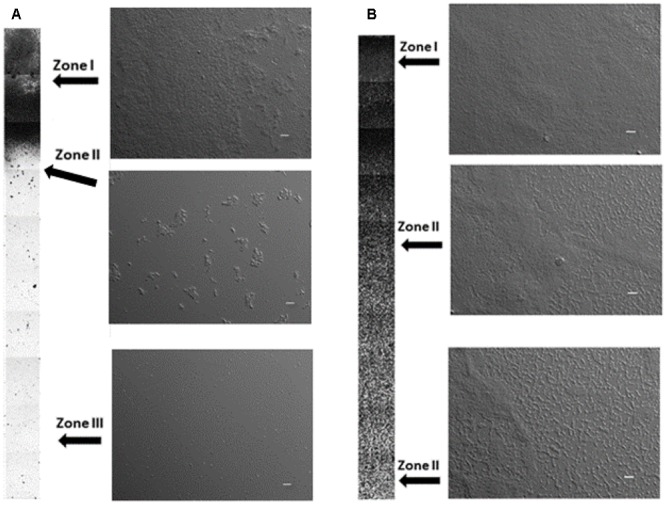
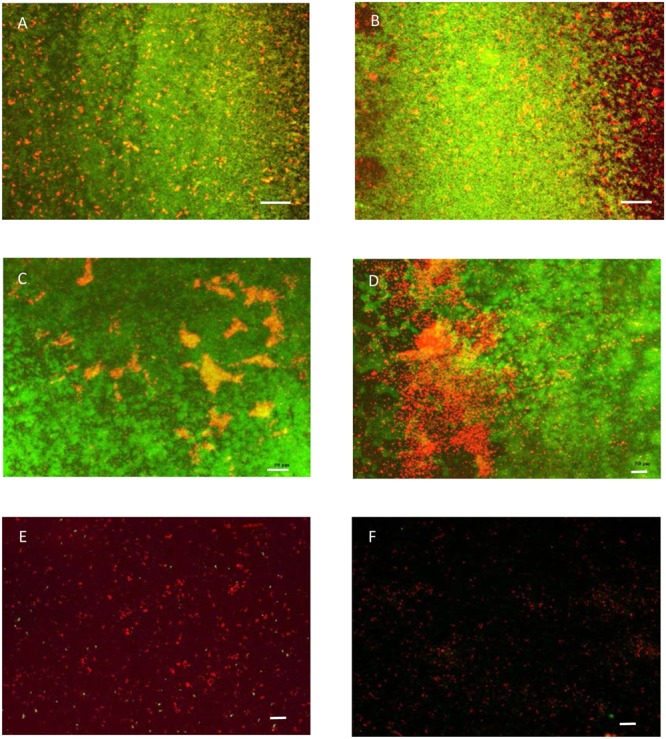
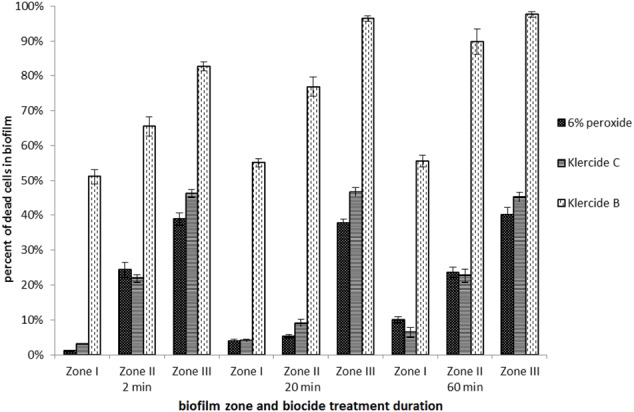
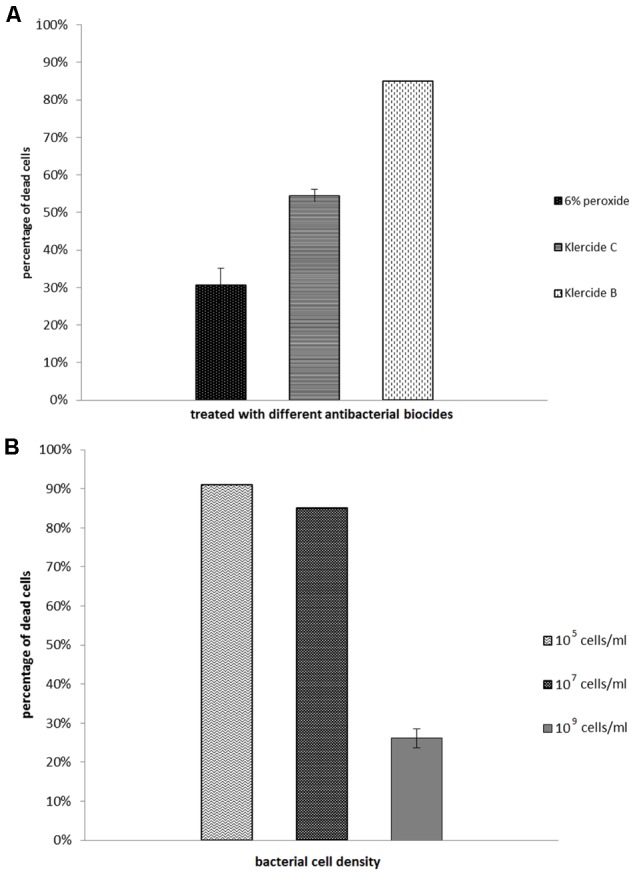
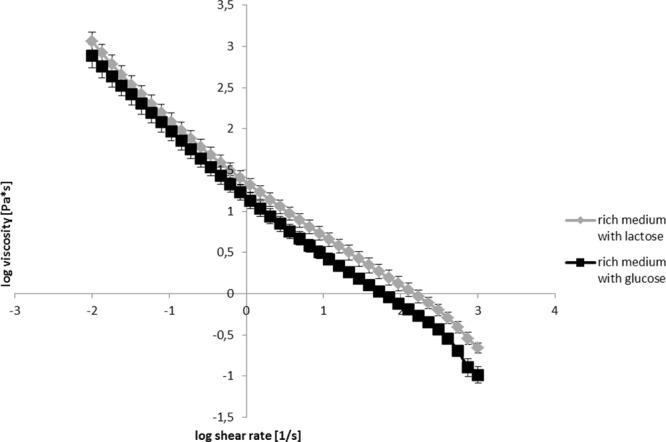
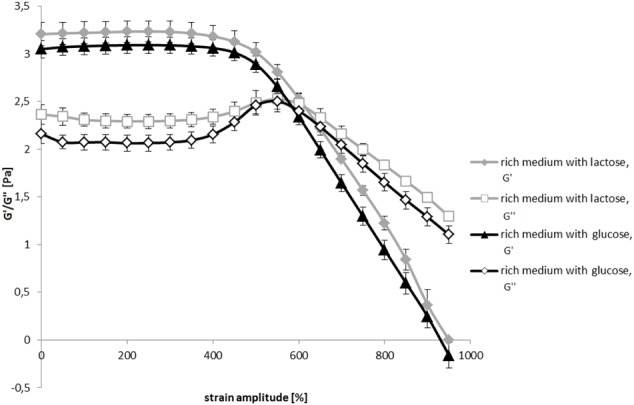
High resistance of biofilms for chemical challenges is a serious industrial and medical problem. In this work a gradient of surface covered with biofilm has been produced and correlated to the effectiveness of different commercially available oxidative biocides. The results for thin Escherichia coli biofilms grown in rich media supplemented with glucose or lactose on glass or poly methyl methacrylate surfaces indicate that the effectiveness of hydrogen peroxide or chlorine dioxide and quaternary ammonium compounds is inversely proportional to the fraction of the surface covered with the biofilm. In areas where biofilm covered more than 90% of the available surface the biocide treatment was inefficient after 60 min of incubation. The combined effect of oxidant and surfactant increased the effectiveness of the biocide. On the other hand, the increased biofilm viscoelasticity reduced biocide effectiveness. The results emphasize differential biocide effectiveness depending on the fraction of the attached bacterial cells. The results suggest that biofilm biocide resistance is an acquired property that increases with biofilm maturation. The more dense sessile structures present lower log reductions compared to less dense ones.
Keywords: E. coli; antimicrobial; biocide; biofilms; surface coverage; viscoelasticity.
Figures

Similar articles
-
Biocide resistance of Candida and Escherichia coli biofilms is associated with higher antioxidative capacities.J Hosp Infect. 2012 Jun;81(2):79-86. doi: 10.1016/j.jhin.2011.09.014. Epub 2012 May 16. J Hosp Infect. 2012. PMID: 22595316
-
Comparative stability and efficacy of selected chlorine-based biocides against Escherichia coli in planktonic and biofilm states.Food Res Int. 2017 Dec;102:511-518. doi: 10.1016/j.foodres.2017.09.033. Epub 2017 Sep 12. Food Res Int. 2017. PMID: 29195980
-
Common Plant-Derived Terpenoids Present Increased Anti-Biofilm Potential against Staphylococcus Bacteria Compared to a Quaternary Ammonium Biocide.Foods. 2020 Jun 1;9(6):697. doi: 10.3390/foods9060697. Foods. 2020. PMID: 32492772 Free PMC article.
-
Mechanisms of biofilm resistance to antimicrobial agents.Trends Microbiol. 2001 Jan;9(1):34-9. doi: 10.1016/s0966-842x(00)01913-2. Trends Microbiol. 2001. PMID: 11166241 Review.
-
Surface-attached cells, biofilms and biocide susceptibility: implications for hospital cleaning and disinfection.J Hosp Infect. 2015 Jan;89(1):16-27. doi: 10.1016/j.jhin.2014.09.008. Epub 2014 Oct 2. J Hosp Infect. 2015. PMID: 25447198 Review.
Cited by
-
Selection and dissemination of antimicrobial resistance in Agri-food production.Antimicrob Resist Infect Control. 2019 Oct 21;8:158. doi: 10.1186/s13756-019-0623-2. eCollection 2019. Antimicrob Resist Infect Control. 2019. PMID: 31649815 Free PMC article. Review.
-
Bacterial Density and Biofilm Structure Determined by Optical Coherence Tomography.Sci Rep. 2019 Jul 5;9(1):9794. doi: 10.1038/s41598-019-46196-7. Sci Rep. 2019. PMID: 31278369 Free PMC article.
-
A novel approach to expedite wound healing with plasma brush of cold flame.Rev Sci Instrum. 2023 Aug 1;94(8):084102. doi: 10.1063/5.0096969. Rev Sci Instrum. 2023. PMID: 38065141 Free PMC article.
-
Disinfectants and antiseptics: mechanisms of action and resistance.Nat Rev Microbiol. 2024 Jan;22(1):4-17. doi: 10.1038/s41579-023-00958-3. Epub 2023 Aug 30. Nat Rev Microbiol. 2024. PMID: 37648789 Review.
-
Detecting Flavobacterial Fish Pathogens in the Environment via High-Throughput Community Analysis.Appl Environ Microbiol. 2022 Jan 25;88(2):e0209221. doi: 10.1128/AEM.02092-21. Epub 2021 Nov 17. Appl Environ Microbiol. 2022. PMID: 34788066 Free PMC article.
References
-
- Chan W. (1998). The Role of Viscosity in Pseudomonas and Candida Phenotype Expression. Ph.D. thesis, University of Calgary; Calgary, AB.
-
- De Kee D., Liu Q., Hinestroza J. (2005). Viscoelastic (non-fickian) diffusion. Can. J. Chem. Eng. 83 913–929. 10.1002/cjce.5450830601 - DOI
LinkOut - more resources
Full Text Sources
Other Literature Sources