

The Dynamics of Energy Dissipation and Xanthophyll Conversion in Arabidopsis Indicate an Indirect Photoprotective Role of Zeaxanthin in Slowly Inducible and Relaxing Components of Non-photochemical Quenching of Excitation Energy
- PMID: 29276525
- PMCID: PMC5727089
- DOI: 10.3389/fpls.2017.02094
The Dynamics of Energy Dissipation and Xanthophyll Conversion in Arabidopsis Indicate an Indirect Photoprotective Role of Zeaxanthin in Slowly Inducible and Relaxing Components of Non-photochemical Quenching of Excitation Energy
Abstract
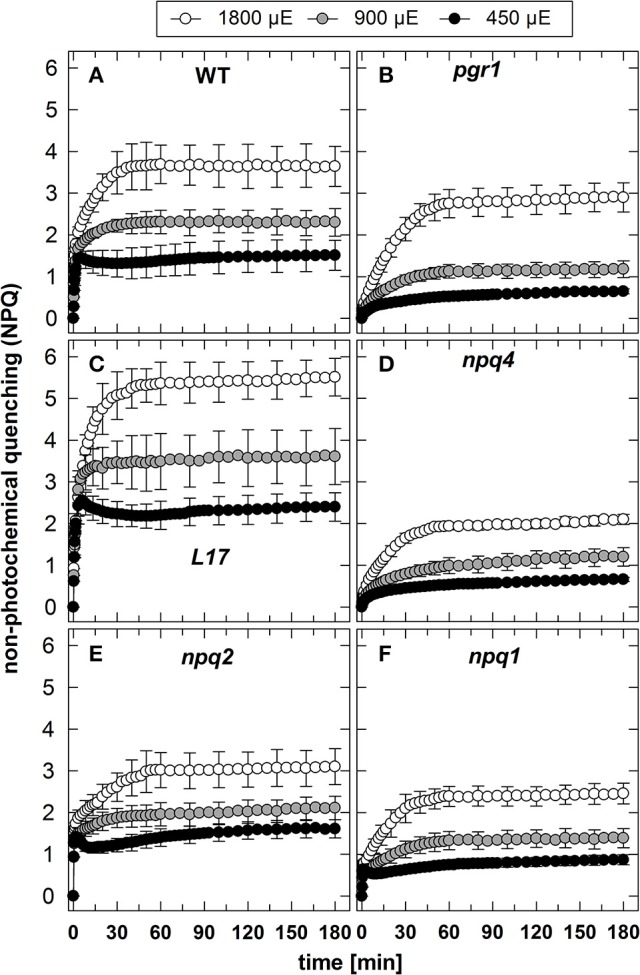
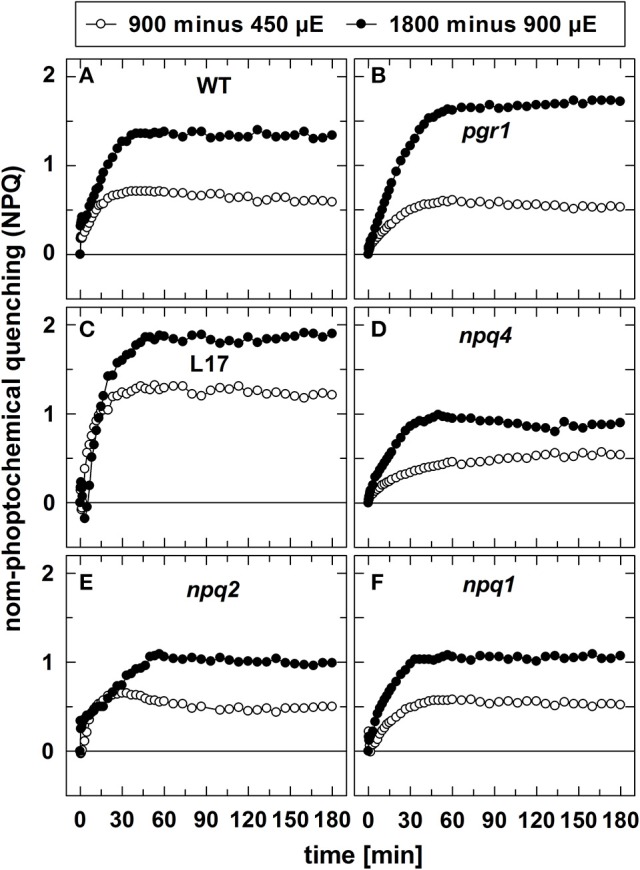
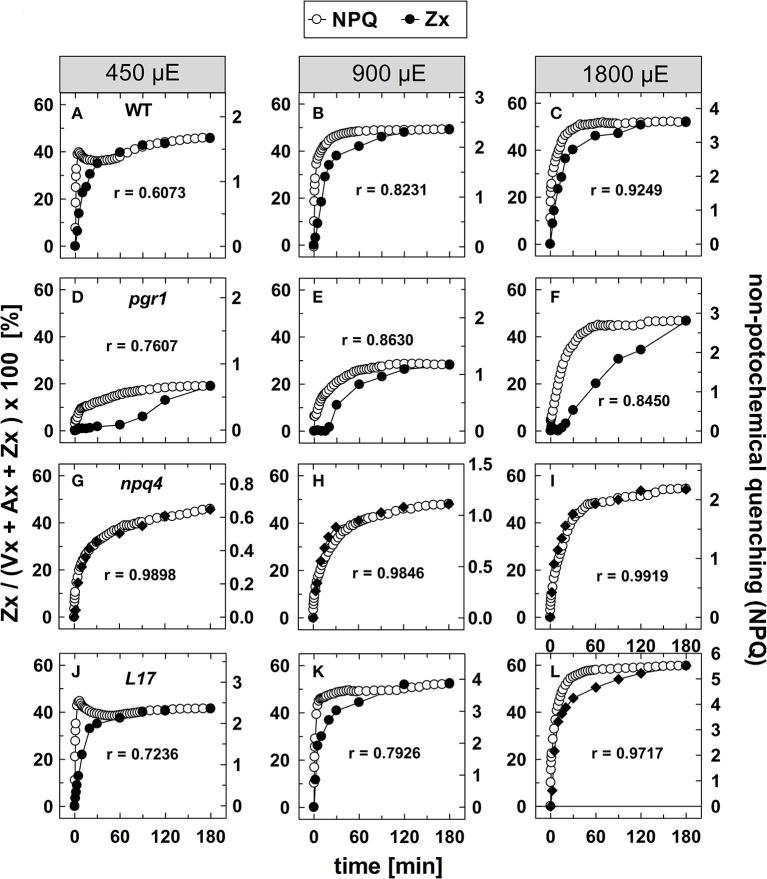
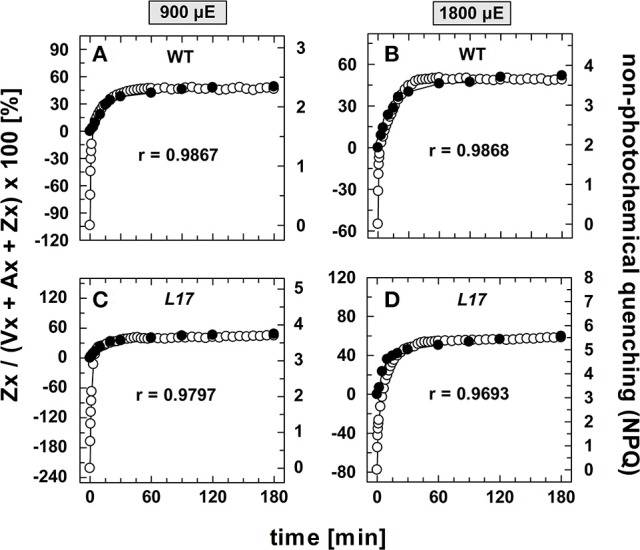
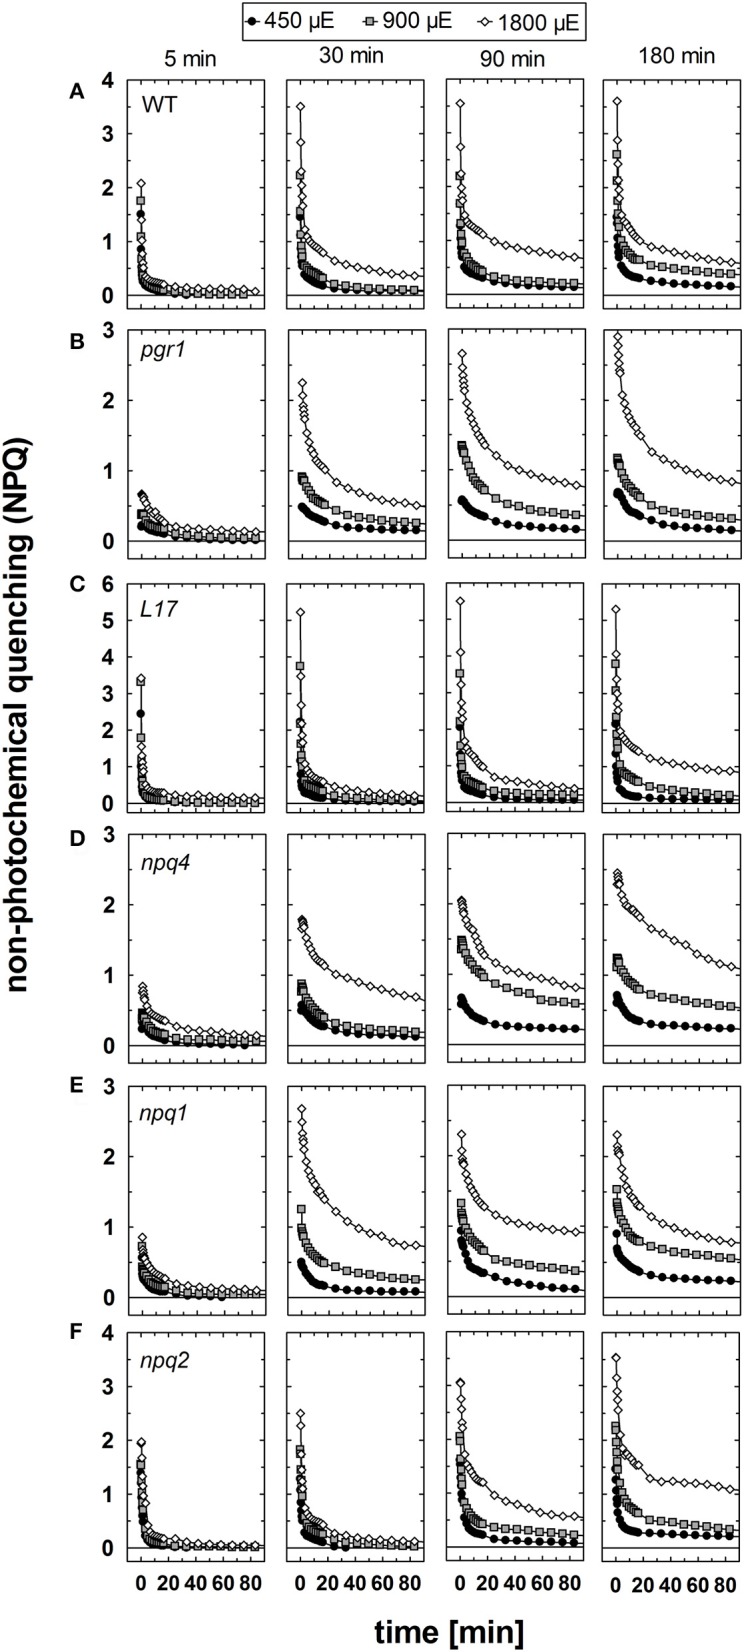
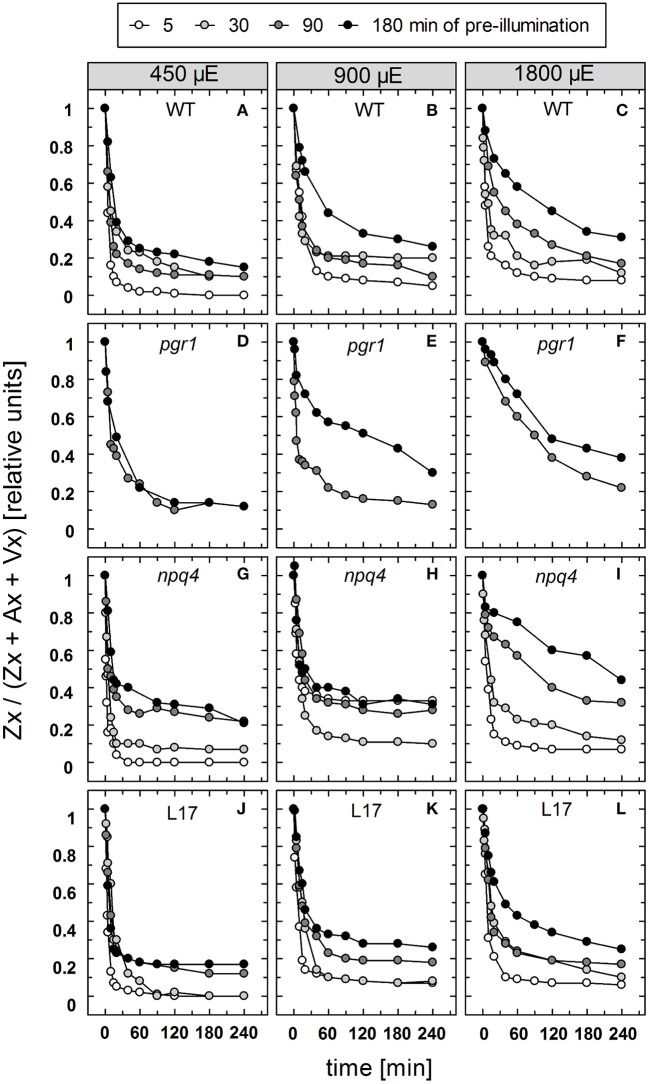
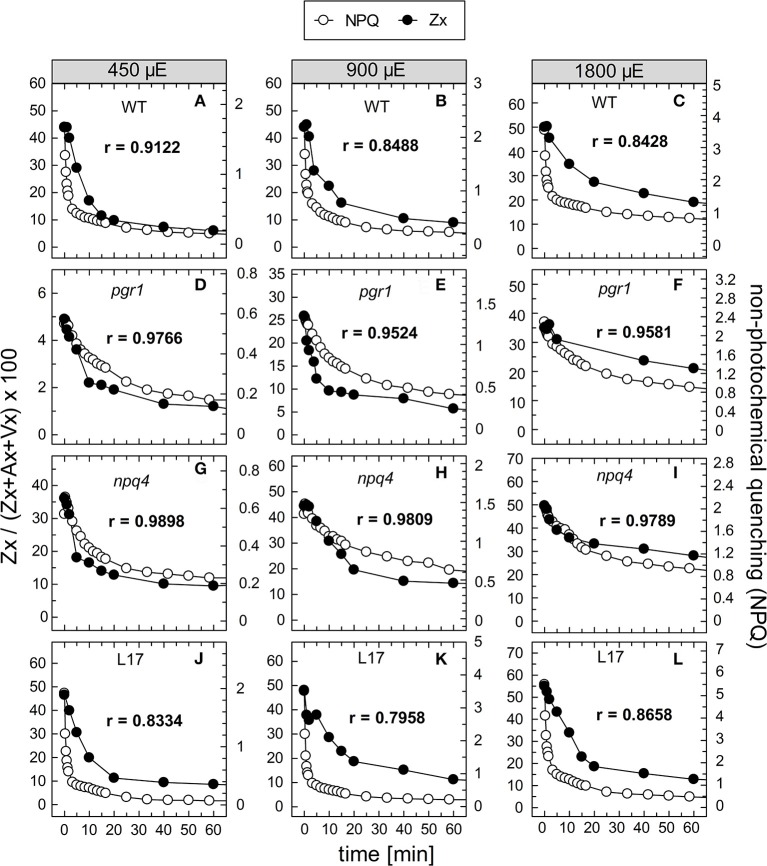
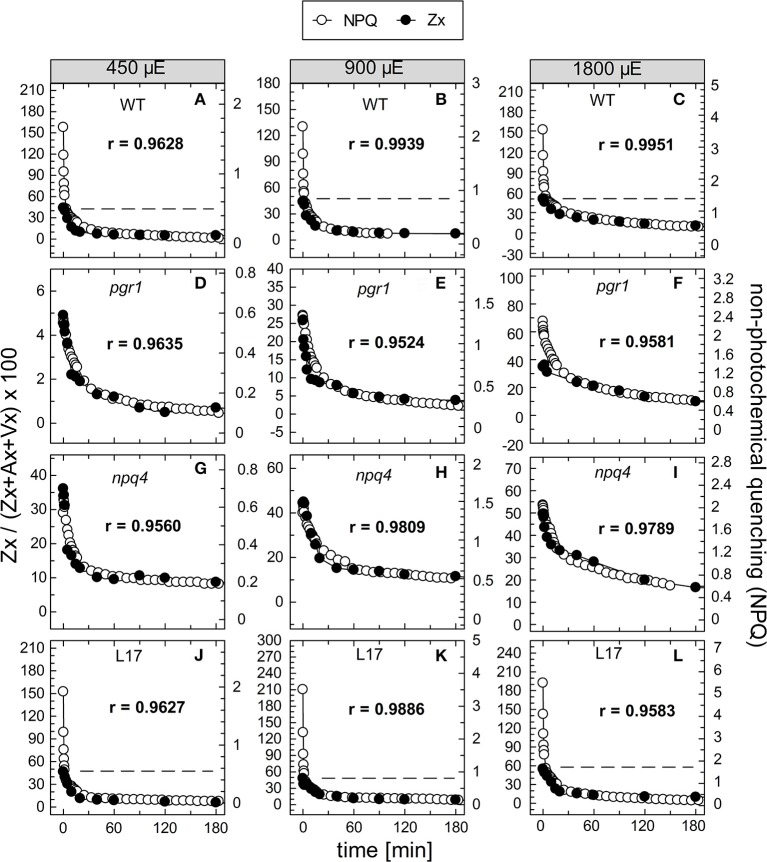
The dynamics of non-photochemical quenching (NPQ) of chlorophyll fluorescence and the dynamics of xanthophyll conversion under different actinic light conditions were studied in intact leaves of Arabidopsis thaliana. NPQ induction was investigated during up to 180 min illumination at 450, 900, and 1,800 μmol photons m-2 s-1 (μE) and NPQ relaxation after 5, 30, 90, or 180 min of pre-illumination at the same light intensities. The comparison of wild-type plants with mutants affected either in xanthophyll conversion (npq1 and npq2) or PsbS expression (npq4 and L17) or lumen acidification (pgr1) indicated that NPQ states with similar, but not identical characteristics are induced at longer time range (15-60 min) in wild-type and mutant plants. In genotypes with an active xanthophyll conversion, the dynamics of two slowly (10-60 min) inducible and relaxing NPQ components were found to be kinetically correlated with zeaxanthin formation and epoxidation, respectively. However, the extent of NPQ was independent of the amount of zeaxanthin, since higher NPQ values were inducible with increasing actinic light intensities without pronounced changes in the zeaxanthin amount. These data support an indirect role of zeaxanthin in pH-independent NPQ states rather than a specific direct function of zeaxanthin as quencher in long-lasting NPQ processes. Such an indirect function might be related to an allosteric regulation of NPQ processes by zeaxanthin (e.g., through interaction of zeaxanthin at the surface of proteins) or a general photoprotective function of zeaxanthin in the lipid phase of the membrane (e.g., by modulation of the membrane fluidity or by acting as antioxidant). The found concomitant down-regulation of zeaxanthin epoxidation and recovery of photosystem II activity ensures that zeaxanthin is retained in the thylakoid membrane as long as photosystem II activity is inhibited or down-regulated. This regulation supports the view that zeaxanthin can be considered as a kind of light stress memory in chloroplasts, allowing a rapid reactivation of photoprotective NPQ processes in case of recurrent light stress periods.
Keywords: energy dissipation; non-photochemical quenching; photoinhibition; photosynthesis; xanthophyll cycle; zeaxanthin.
Figures

Similar articles
-
Physiological validation of photochemical reflectance index (PRI) as a photosynthetic parameter using Arabidopsis thaliana mutants.Biochem Biophys Res Commun. 2018 Mar 25;498(1):52-57. doi: 10.1016/j.bbrc.2018.02.192. Epub 2018 Feb 28. Biochem Biophys Res Commun. 2018. PMID: 29501490
-
Arabidopsis plants lacking PsbS protein possess photoprotective energy dissipation.Plant J. 2010 Jan;61(2):283-9. doi: 10.1111/j.1365-313X.2009.04051.x. Epub 2009 Oct 16. Plant J. 2010. PMID: 19843315
-
Interaction between avoidance of photon absorption, excess energy dissipation and zeaxanthin synthesis against photooxidative stress in Arabidopsis.Plant J. 2013 Nov;76(4):568-79. doi: 10.1111/tpj.12314. Epub 2013 Oct 3. Plant J. 2013. PMID: 24033721
-
The role of the xanthophyll cycle and of lutein in photoprotection of photosystem II.Biochim Biophys Acta. 2012 Jan;1817(1):182-93. doi: 10.1016/j.bbabio.2011.04.012. Epub 2011 May 1. Biochim Biophys Acta. 2012. PMID: 21565154 Review.
-
Molecular genetics of xanthophyll-dependent photoprotection in green algae and plants.Philos Trans R Soc Lond B Biol Sci. 2000 Oct 29;355(1402):1385-94. doi: 10.1098/rstb.2000.0700. Philos Trans R Soc Lond B Biol Sci. 2000. PMID: 11127993 Free PMC article. Review.
Cited by
-
Non-Photochemical Quenching under Drought and Fluctuating Light.Int J Mol Sci. 2022 May 6;23(9):5182. doi: 10.3390/ijms23095182. Int J Mol Sci. 2022. PMID: 35563573 Free PMC article.
-
The zeaxanthin epoxidase is degraded along with the D1 protein during photoinhibition of photosystem II.Plant Direct. 2019 Dec 1;3(11):e00185. doi: 10.1002/pld3.185. eCollection 2019 Nov. Plant Direct. 2019. PMID: 31819921 Free PMC article.
-
Protein dynamics and lipid affinity of monomeric, zeaxanthin-binding LHCII in thylakoid membranes.Biophys J. 2022 Feb 1;121(3):396-409. doi: 10.1016/j.bpj.2021.12.039. Epub 2021 Dec 28. Biophys J. 2022. PMID: 34971616 Free PMC article.
-
Nonphotochemical quenching changes with abiotic stressor and developmental stages.bioRxiv [Preprint]. 2025 May 18:2025.05.14.654125. doi: 10.1101/2025.05.14.654125. bioRxiv. 2025. PMID: 40462976 Free PMC article. Preprint.
-
Specific thylakoid protein phosphorylations are prerequisites for overwintering of Norway spruce (Picea abies) photosynthesis.Proc Natl Acad Sci U S A. 2020 Jul 28;117(30):17499-17509. doi: 10.1073/pnas.2004165117. Epub 2020 Jul 20. Proc Natl Acad Sci U S A. 2020. PMID: 32690715 Free PMC article.
References
-
- Adams W. W., Demmig-Adams B., Rosenstiel T. N., Brightwell A. K., Ebbert V. (2002). Photosynthesis and photoprotection in overwintering plants. Plant Biol. 4, 545–557. 10.1055/s-2002-35434 - DOI
-
- Allen J. F., Bennett J., Steinback K. E., Arntzen C. J. (1981). Chloroplast protein phosphorylation couples plastoquinone redox state to distribution of excitation energy between photosystems. Nature 291, 25–29. 10.1038/291025a0 - DOI
LinkOut - more resources
Full Text Sources
Other Literature Sources
Molecular Biology Databases