. 2017 Sep 5;5(1):67-82.e1.
doi: 10.1016/j.jcmgh.2017.08.004. eCollection 2018.

Indian Hedgehog Suppresses a Stromal Cell-Driven Intestinal Immune Response

Affiliations

Indian Hedgehog Suppresses a Stromal Cell-Driven Intestinal Immune Response

B Florien Westendorp et al. Cell Mol Gastroenterol Hepatol. .

Abstract

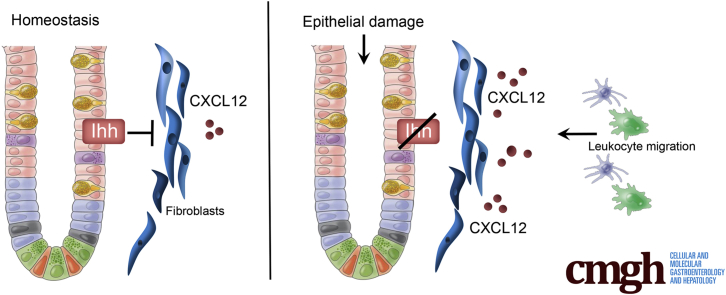
Background & aims: Upon intestinal epithelial damage a complex wound healing response is initiated to restore epithelial integrity and defend against pathogenic invasion. Epithelium-derived Indian Hedgehog (Ihh) functions as a critical sensor in this process. Signaling occurs in a paracrine manner because the receptor for Ihh is expressed only in the mesenchyme, but the exact Hedgehog target cell has remained elusive. The aim of this study was to elucidate further the nature of this target cell in the context of intestinal inflammation.

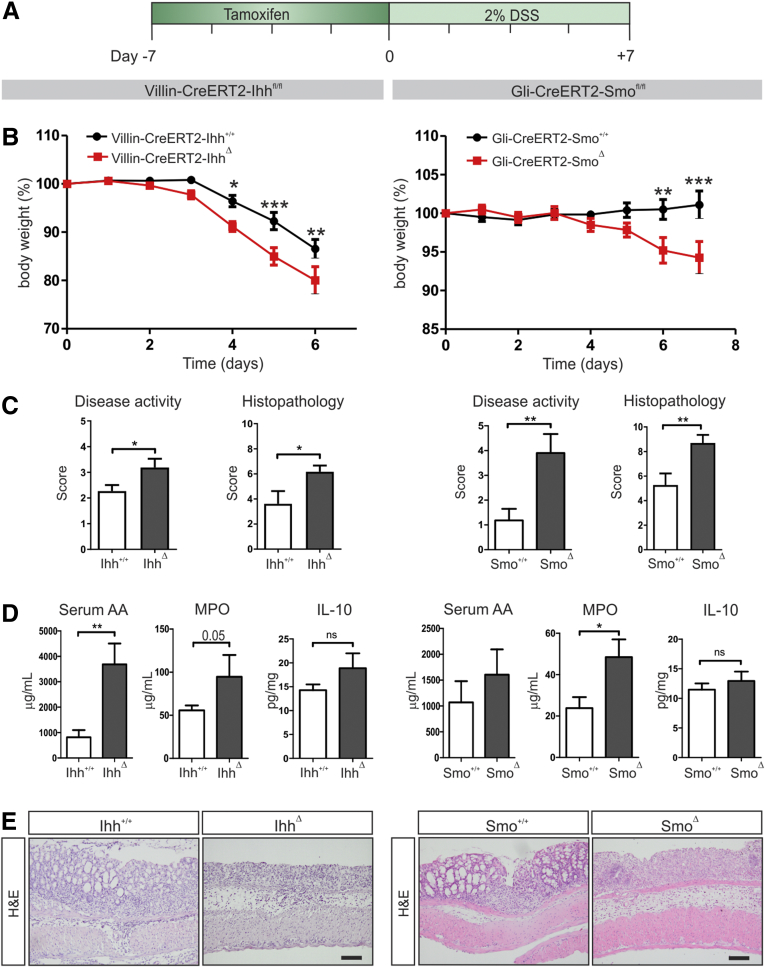
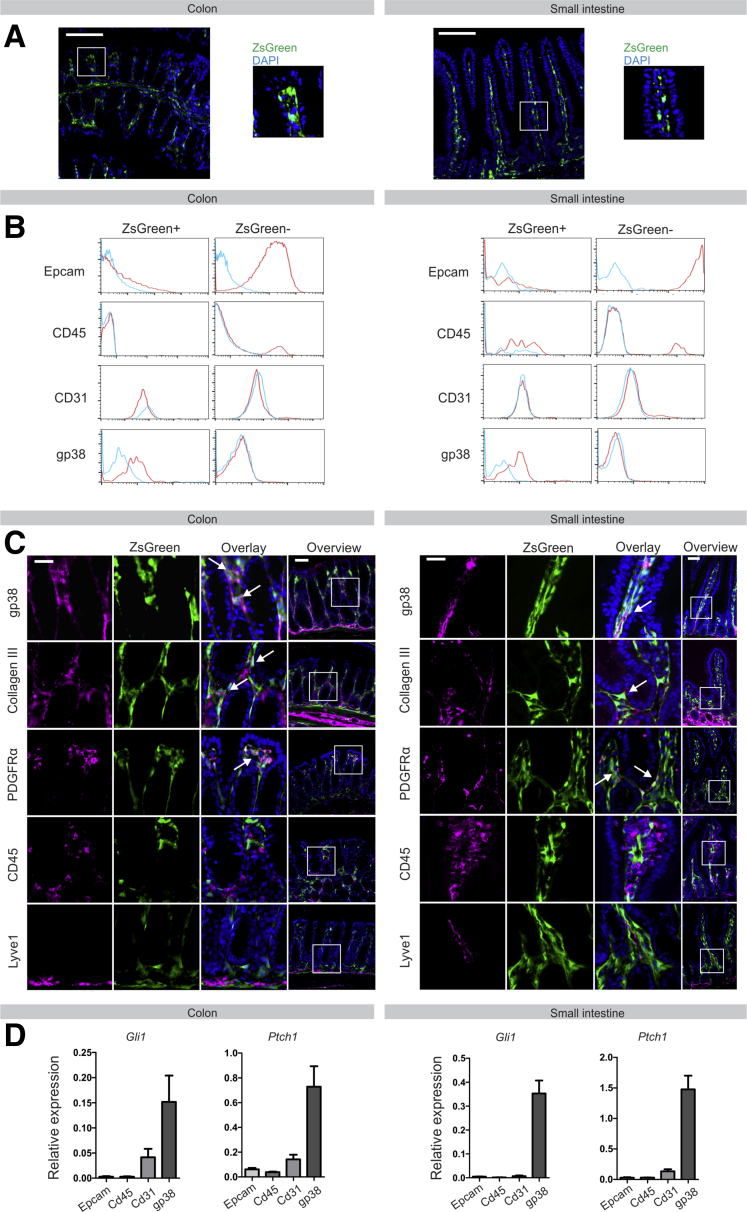
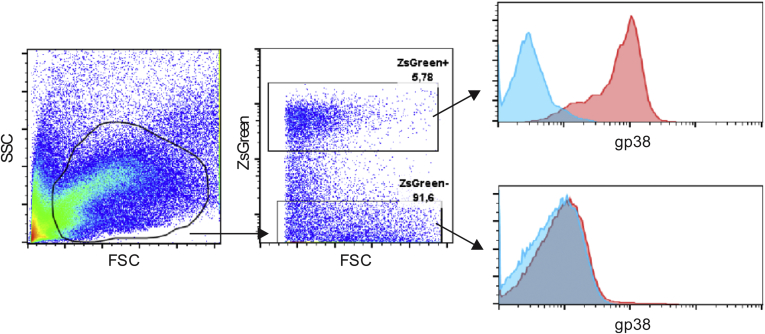
Methods: Hedgehog activity was modulated genetically in both cell type-specific and body-wide models and the resulting animals were analyzed for gene expression profiles and sensitivity for dextran sodium sulfate (DSS) colitis. To characterize the Hedgehog target cell, Gli1-CreERT2-Rosa26-ZsGreen animals were generated, which express ZsGreen in all Hedgehog-responsive cells. These cells were characterized using flow cytometry and immunofluorescence.

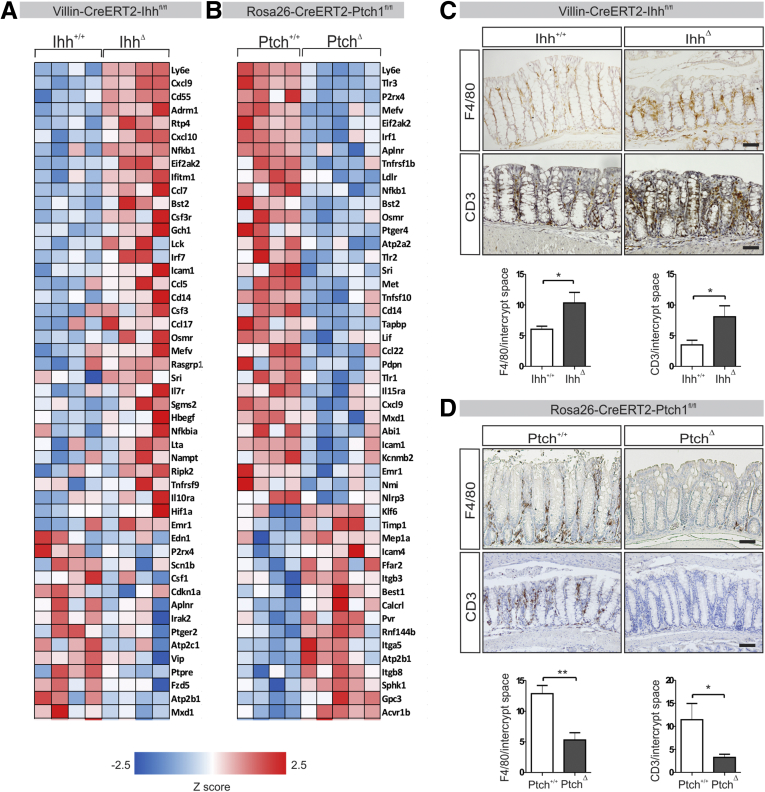
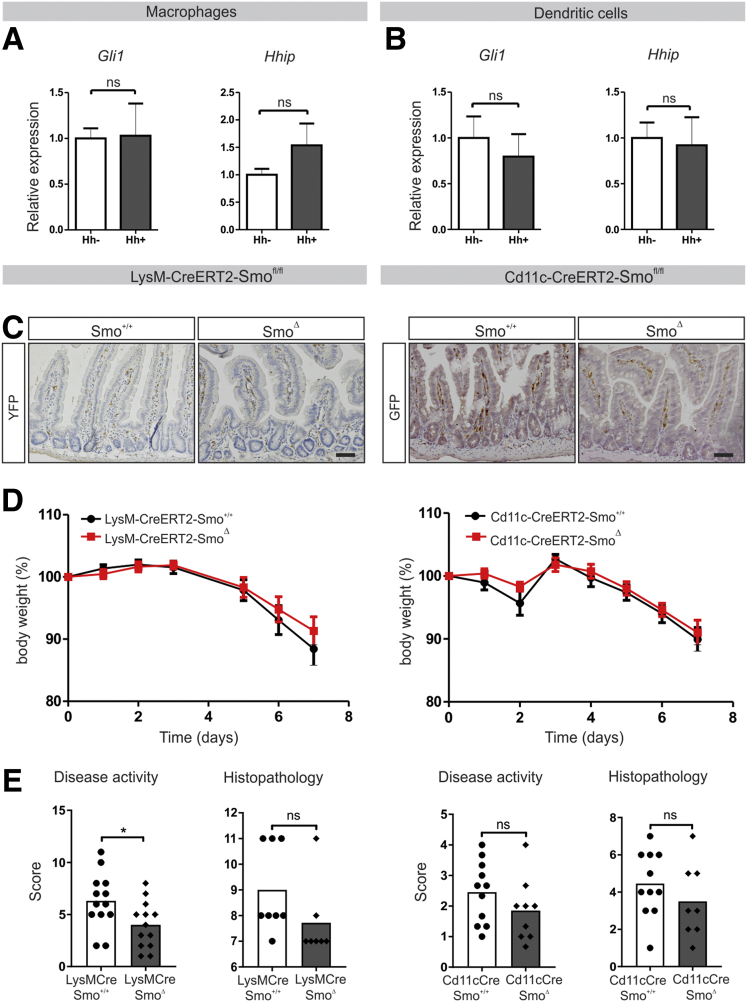
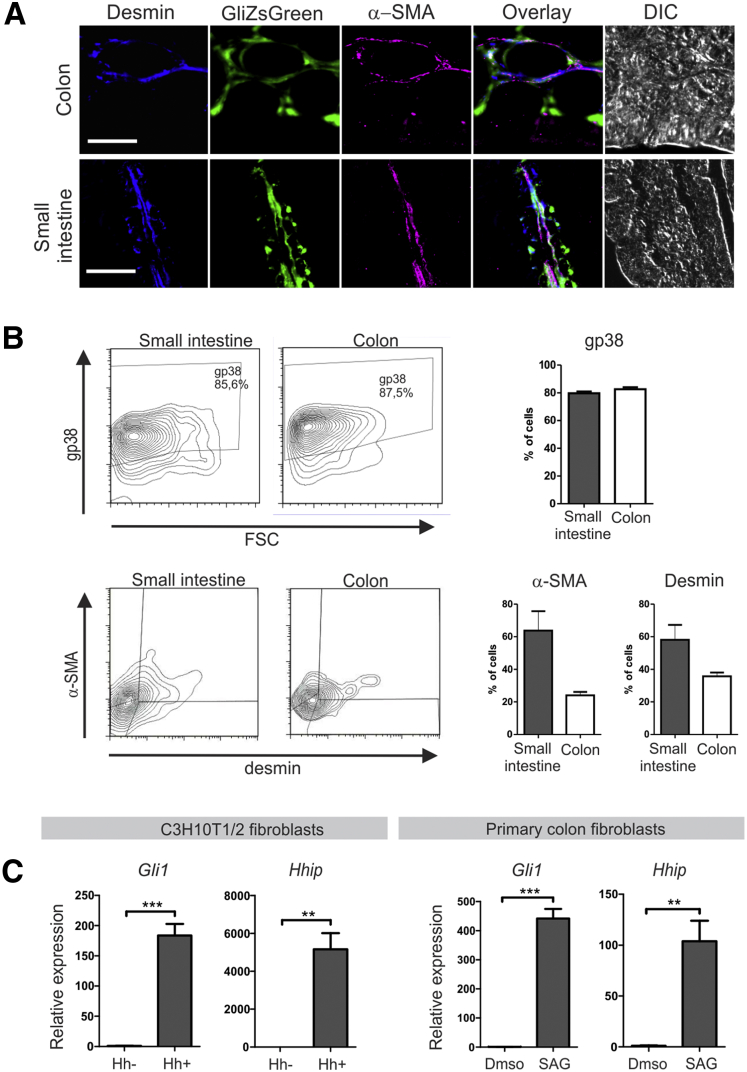
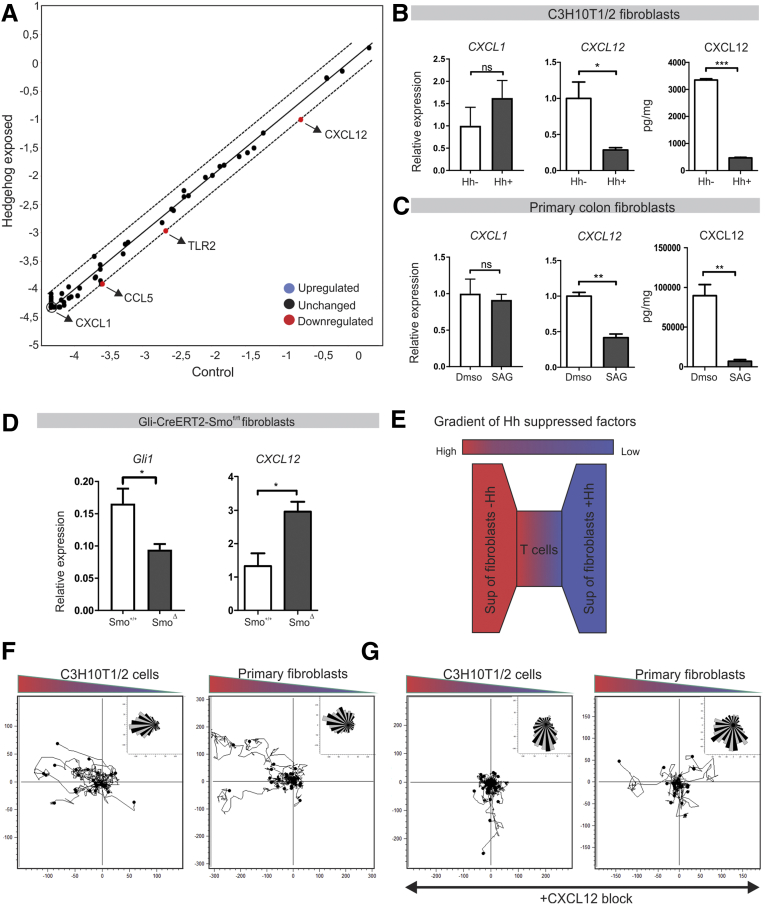
Results: Loss of Indian Hedgehog from the intestinal epithelium resulted in a rapid increase in expression of inflammation-related genes, accompanied by increased influx of immune cells. Animals with epithelium-specific deletion of Ihh or lacking the Hedgehog receptor Smoothened from Hedgehog target cells were more sensitive to DSS colitis. In contrast, specific deletion of Smoothened in the myeloid compartment did not alter the response to DSS. This suggests that Hedgehog signaling does not repress intestinal immunity through an effect on myeloid cells. Indeed, we found that Hedgehog-responsive cells expressed gp38, smooth muscle actin, and desmin, indicating a fibroblastic nature. Ihh signaling inhibited expression of C-X-C motif chemokine ligand 12 (CXCL12) in fibroblasts in vitro and in vivo, thereby impairing the recruitment of immune cells.

Conclusions: We show that epithelium-derived Indian Hedgehog signals exclusively to fibroblasts in the intestine. Loss of Ihh leads to a rapid immune response with up-regulation of fibroblast-derived CXCL12, and migration of immune cells into the lamina propria.

Keywords: CXCL, C-X-C motif chemokine ligand; CXCL12; CXCR, C-X-C motif chemokine receptor; DMEM, Dulbecco's modified Eagle medium; DSS, dextran sodium sulfate; FCS, fetal calf serum; Gli, glioma-associated oncogene proteins; Hedgehog; Hhip, Hedgehog interacting protein; IBD, inflammatory bowel disease; IL, interleukin; Ihh+/+, Villin-CreERT2-ZsGreen-Ihh+/+; Ihh, Indian Hedgehog; IhhΔ, Villin-CreERT2-ZsGreen-Ihhfl/fl; Inflammation; Intestine; MPO, myeloperoxidase; PBT, PBS/BSA/Triton; Ptch1, Patched1; RT-PCR, reverse-transcription polymerase chain reaction; Smo, Smoothened; Stroma; α-SMA, α smooth muscle actin.


Figures

None
Graphical abstract
Figure 1
Figure 1
Deletion of intestinal Hedgehog results in up-regulation of inflammation-mediated genes, whereas activation of Hedgehog signaling results in down-regulation.Villin-CreERT2-Ihh+/+ (Ihh+/+, n = 4) and Villin-CreERT2-Ihhfl/fl animals (IhhΔ, n = 4), or Rosa26-CreERT2-Ptch1+/+ (Ptch+/+, n = 4) and Rosa26-CreERT2-Ptch1fl/fl animals (PtchΔ, n = 4) were injected intraperitoneally with 1 mg tamoxifen for 5 consecutive days. Seven and 12 days after the start of induction for each genotype, respectively, animals were killed and transcriptional profiling and histologic analyses were performed. (A and B) Transcriptional analysis of (A) IhhΔ animals using Affymetrix and (B) PtchΔ animals using Illumina platforms. Gene set enrichment analyses of the Hallmark gene set Inflammatory_Response. Gene expression heatmaps of the 50 most differentially regulated transcripts within the Inflammatory_Response gene set in each mouse model are shown. (C and D) Immunohistochemistry for CD3 and F4/80 expression (positive cells/crypt) in the colons of (C) IhhΔ and (D) Ptch1Δ animals. Scale bars: 50 μm. Bars represent means, error bars represent SEM. *P < .05, **P < .01.
Figure 2
Figure 2
Decreased Hedgehog signaling results in increased sensitivity to DSS-induced colitis. (A) Experimental set up: Villin-CreERT2-Ihh+/+ (Ihh+/+, n = 10) and Villin-CreERT2-Ihhfl/fl animals (IhhΔ, n = 10), or Gli1-CreERT2-ZsGreen-Smo+/+ (Smo+/+, n = 11) and Gli1-CreERT2-ZsGreen-Smofl/fl animals (SmoΔ, n = 10) were injected intraperitoneally with 1 mg tamoxifen for 5 consecutive days. Animals were provided with drinking water containing 2% DSS for 6 or 7 days, starting 7 days after induction of recombination. Experiments were performed in 2 separate mouse facilities. For both mouse models, (B) the relative weight to the weight at the start of DSS administration is shown, (C) disease and histologic scores were determined as described in the Materials and Methods section, (D) MPO levels and IL10 protein levels were determined in colon lysates and are shown as corrected for total protein content, and serum amyloid A levels were measured in the serum at death. (E) Representative images of H&E-stained sections of the colons of each mouse model. Scale bars: 50 μm. Bars represent means, error bars represent SEM. *P < .05, **P < .01, ***P < .001.
Figure 3
Figure 3
Intestinal myeloid cells are not Hedgehog responsive. (A and B) Quantitative RT-PCR for Hedgehog targets Gli1 and Hhip in bone marrow–derived macrophages and dendritic cells stimulated using 10% Hedgehog conditioned or control medium for 24 hours. Expression relative to the household gene cyclophilin is shown. Data are representative of 3 independent experiments. (C) Immunohistochemistry for GFP and YFP to confirm expression of Cre recombinase. Scale bars: 50 μm. (D and E) LysM-Cre-Smo+/+ (Smo+/+, n = 13) and LysM-Cre-SmoΔ animals (SmoΔ, n = 13) or CD11c-Cre-Smo+/+ (Smo+/+, n = 11) and CD11c-Cre-Smofl/fl animals (SmoΔ, n = 9) were provided with drinking water containing 2% DSS after induction with tamoxifen and killed on day 7. (D) Relative weight to the weight of start was measured, and (E) disease and histologic scores were determined as described in the Materials and Methods section. Bars represent means, error bars represent SEM. ∗P < .05.
Figure 4
Figure 4
Hedgehog-responsive cells in the intestine are fibroblast-like cells. (A) ZsGreen expression in small intestine and colon of Gli1-CreERT2-Rosa26-ZsGreen animals upon induction with tamoxifen. Nuclei were visualized by 4′,6-diamidino-2-phenylindole (DAPI) (blue). Scale bars: 50 μm. (B) Flow cytometry for expression of Epcam, CD45, CD31, and gp38 in ZsGreen+ and ZsGreen- cells of induced Gli1-CreERT2-Rosa26-ZsGreen animals. Blue lines indicate isotype control, red line indicates specific staining. (C) Immunofluorescent staining for gp38, collagen III, platelet-derived growth factor receptor-α (PDGFRα), CD45, and Lyve1 (magenta) on sections generated from induced Gli1-CreERT2-Rosa26-ZsGreen animals. Nuclei were visualized by DAPI (blue). Arrows indicate co-localization. Scale bars: 25 μm; scale bars in overview, 50 μm. (D) Quantitative RT-PCR for Hedgehog targets Gli1 and Ptch1 in intestinal cell populations positive for Epcam, CD45, CD31, or gp38, respectively, isolated from wild-type mice (N = 3).
Figure 5
Figure 5
Hedgehog-responsive cells are a heterogeneous population of fibroblasts. (A) Immunofluorescent staining for desmin (blue) and α-SMA (magenta) on sections generated from induced Gli1-CreERT2-Rosa26-ZSGreen animals. For topographic reference, a differential interference contrast (DIC) image is shown. Scale bars: 50 μm. (B) Flow cytometry analysis and quantification of expression of gp38, desmin, and α-SMA in ZsGreen+ cells isolated from induced Gli1-CreERT2-Rosa26-ZsGreen animals. (C) Quantitative RT-PCR for Hedgehog targets Gli1 and Hhip in C3H10T1/2 fibroblasts or primary mouse colon fibroblasts that were incubated in 10% Hedgehog conditioned medium or stimulated with a Smoothened agonist (SAG), respectively, for 7 days. Expression relative to the household gene cyclophilin is shown. Data are representative of 3 independent experiments. Bars represent means, error bars represent SEM. **P < .01, ***P < .0001.
Figure 6
Figure 6
Hedgehog suppresses immune cell migration through inhibition of fibroblast-derived CXCL12. (A) Quantitative RT-PCR array for 84 chemokines and receptors in C3H10T1/2 cells incubated in 10% Hedgehog conditioned medium for 48 hours. (B and C) Quantitative RT-PCR for CXCL1 and CXCL12 and enzyme-linked immunosorbent assay for CXCL12 in C3H10T1/2 cells or primary mouse colon fibroblasts that were incubated in 10% Hedgehog conditioned medium or stimulated with a Smoothened agonist (SAG), respectively, for 7 days. Data are representative of 3 independent experiments. (D) Quantitative RT-PCR for Gli1 and CXCL12 in Epcam-CD45-gp38+ fibroblasts isolated from Gli1-CreERT2-ZsGreen-Smo+/+ (Smo+/+, n = 3) and Gli1-CreERT2-ZsGreen-Smofl/fl animals (SmoΔ, n = 3). (E) Experimental set up: Jurkat T cells were cultured in a collagen/fibronectin matrix and exposed to a gradient of supernatant of fibroblasts with active Hedgehog signaling and control fibroblasts. Migration was tracked overnight. (F) Migration assay for Jurkat T cells in response to supernatant of C3H10T1/2 cells or primary mouse colon fibroblasts that were incubated in 10% Hedgehog conditioned medium or stimulated with SAG, respectively, for 7 days. Data are representative of 3 independent experiments. (G) Migration assay for Jurkat T cells in response to supernatant of fibroblasts supplemented with CXCL12 neutralizing antibody. Data are representative of 3 independent experiments. Bars represent means, error bars represent SEM. *P < .05, **P < .01, ***P < .001. DMSO, dimethyl sulfoxide; Sup, supernatant.
Supplementary Figure 1
Flow cytometry gating strategy example for expression of gp38 in ZsGreen+ and ZsGreen- cells in the colon of an induced Gli1-CreERT2-Rosa26-ZsGreen animal.Blue lines indicate isotype control, red lines indicate specific staining. FSC, forward scatter; SSC, side scatter.

References

    1. Liu Y.J., Soumelis V., Watanabe N., Ito T., Wang Y.H., Malefyt Rde W., Omori M., Zhou B., Ziegler S.F. TSLP: an epithelial cell cytokine that regulates T cell differentiation by conditioning dendritic cell maturation. Annu Rev Immunol. 2007;25:193–219. - PubMed
    1. Zeuthen L.H., Fink L.N., Frokiaer H. Epithelial cells prime the immune response to an array of gut-derived commensals towards a tolerogenic phenotype through distinct actions of thymic stromal lymphopoietin and transforming growth factor-beta. Immunology. 2008;123:197–208. - PMC - PubMed
    1. Kang S., Okuno T., Takegahara N., Takamatsu H., Nojima S., Kimura T., Yoshida Y., Ito D., Ohmae S., You D.J., Toyofuku T., Jang M.H., Kumanogoh A. Intestinal epithelial cell-derived semaphorin 7A negatively regulates development of colitis via alphavbeta1 integrin. J Immunol. 2012;188:1108–1116. - PubMed
    1. Saenz S.A., Siracusa M.C., Perrigoue J.G., Spencer S.P., Urban J.F., Jr., Tocker J.E., Budelsky A.L., Kleinschek M.A., Kastelein R.A., Kambayashi T., Bhandoola A., Artis D. IL25 elicits a multipotent progenitor cell population that promotes T(H)2 cytokine responses. Nature. 2010;464:1362–1366. - PMC - PubMed
    1. Martini E., Krug S.M., Siegmund B., Neurath M.F., Becker C. Mend your fences. Cell Mol Gastroenterol Hepatol. 2017;4:33–46. - PMC - PubMed