

Uncovering a Predictive Molecular Signature for the Onset of NASH-Related Fibrosis in a Translational NASH Mouse Model
- PMID: 29276754
- PMCID: PMC5738456
- DOI: 10.1016/j.jcmgh.2017.10.001
Uncovering a Predictive Molecular Signature for the Onset of NASH-Related Fibrosis in a Translational NASH Mouse Model
Abstract
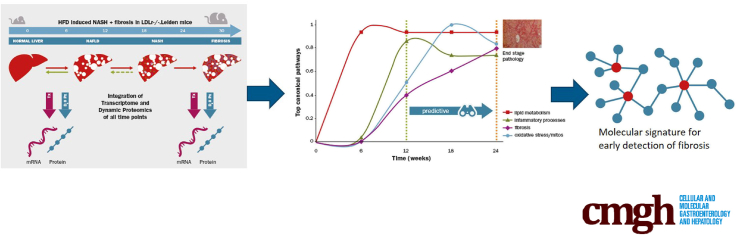
Background & aims: The incidence of nonalcoholic steatohepatitis (NASH) is increasing. The pathophysiological mechanisms of NASH and the sequence of events leading to hepatic fibrosis are incompletely understood. The aim of this study was to gain insight into the dynamics of key molecular processes involved in NASH and to rank early markers for hepatic fibrosis.
Methods: A time-course study in low-density lipoprotein-receptor knockout. Leiden mice on a high-fat diet was performed to identify the temporal dynamics of key processes contributing to NASH and fibrosis. An integrative systems biology approach was used to elucidate candidate markers linked to the active fibrosis process by combining transcriptomics, dynamic proteomics, and histopathology. The translational value of these findings were confirmed using human NASH data sets.
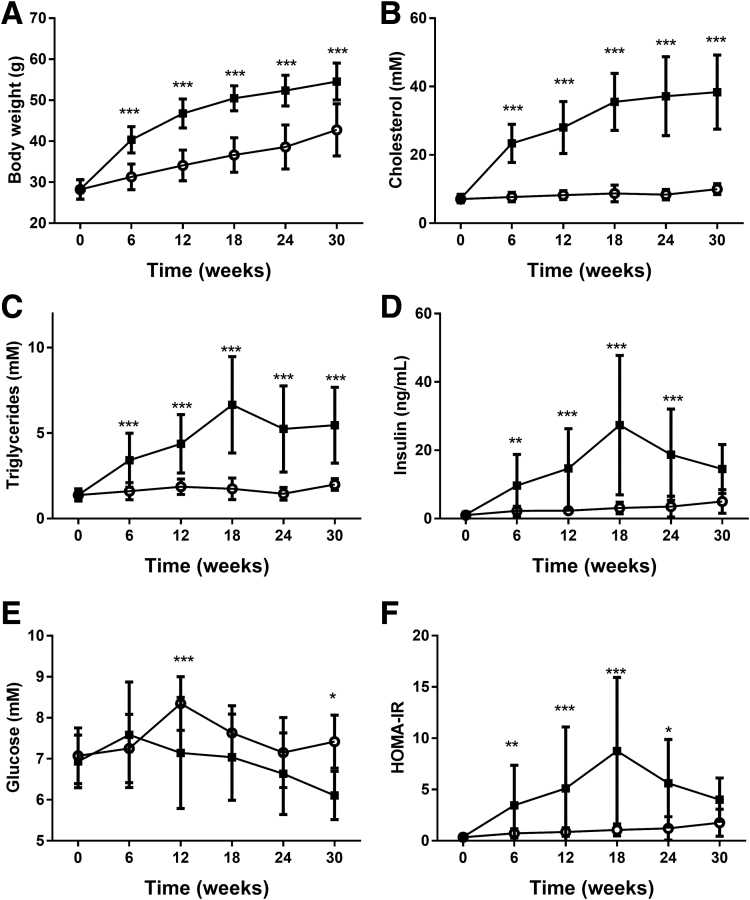
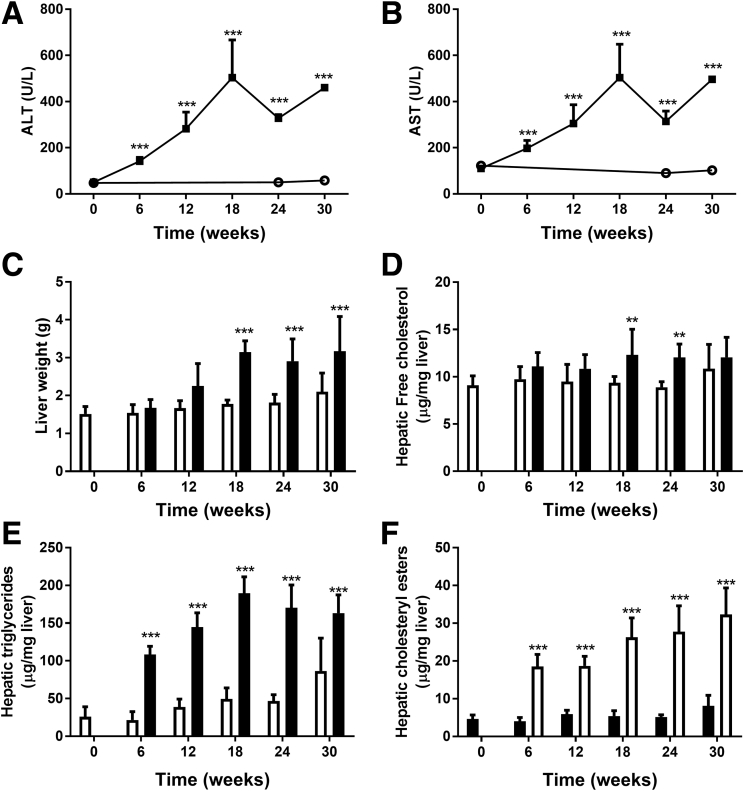
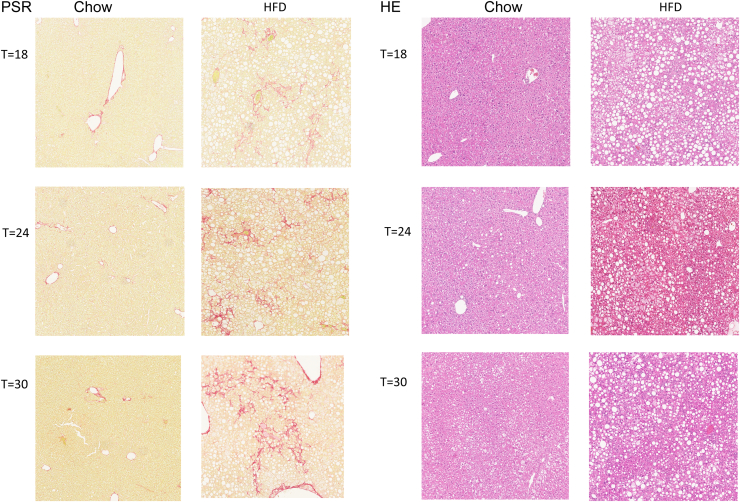
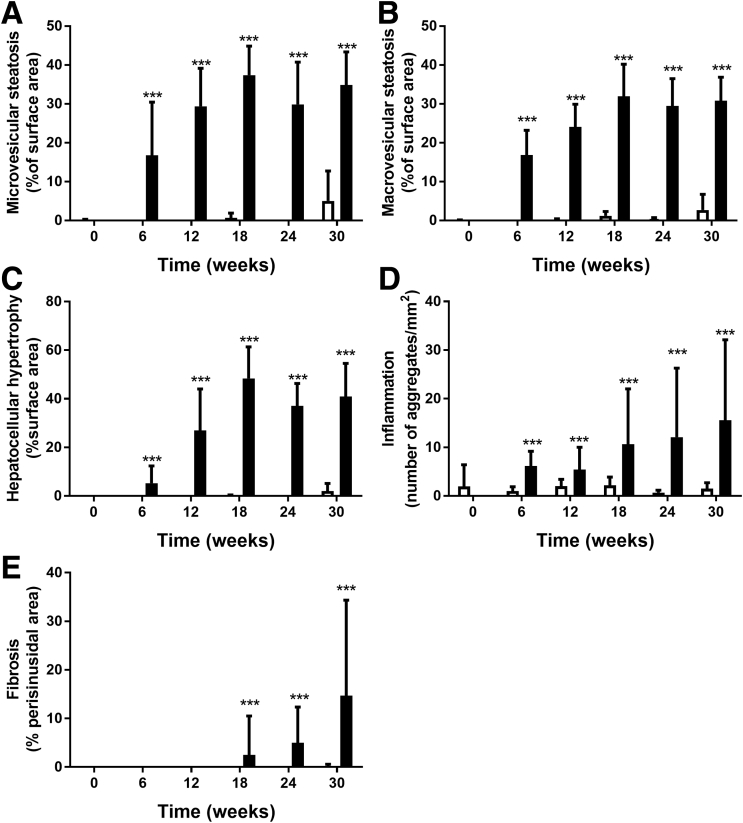
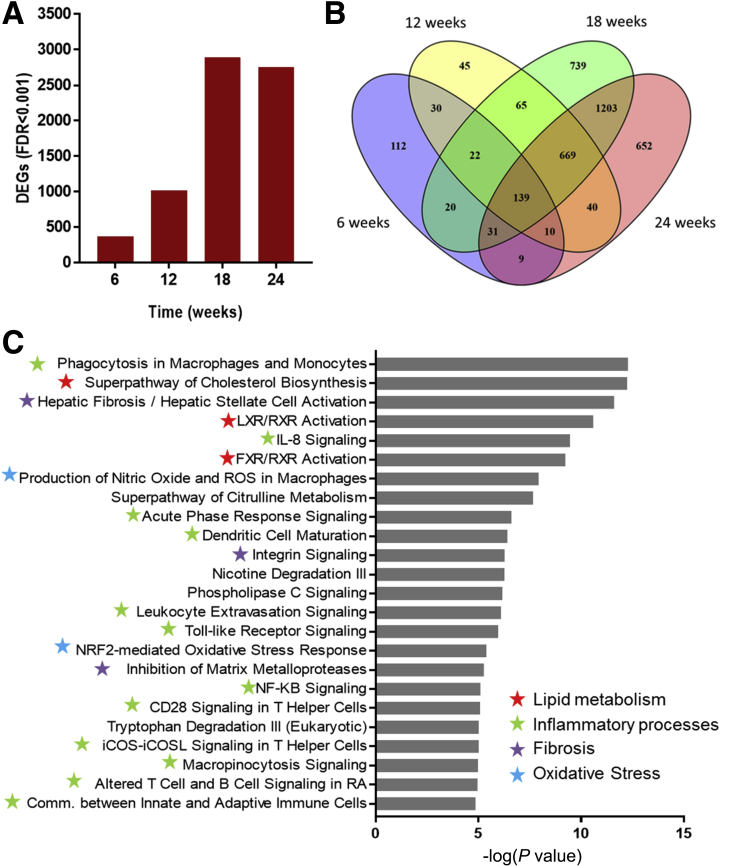
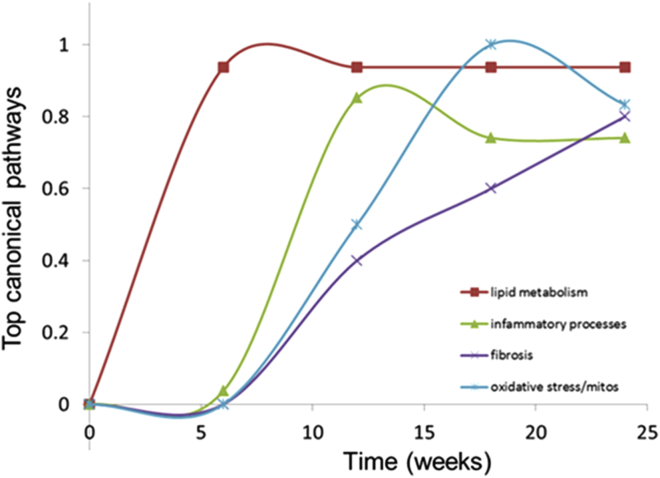
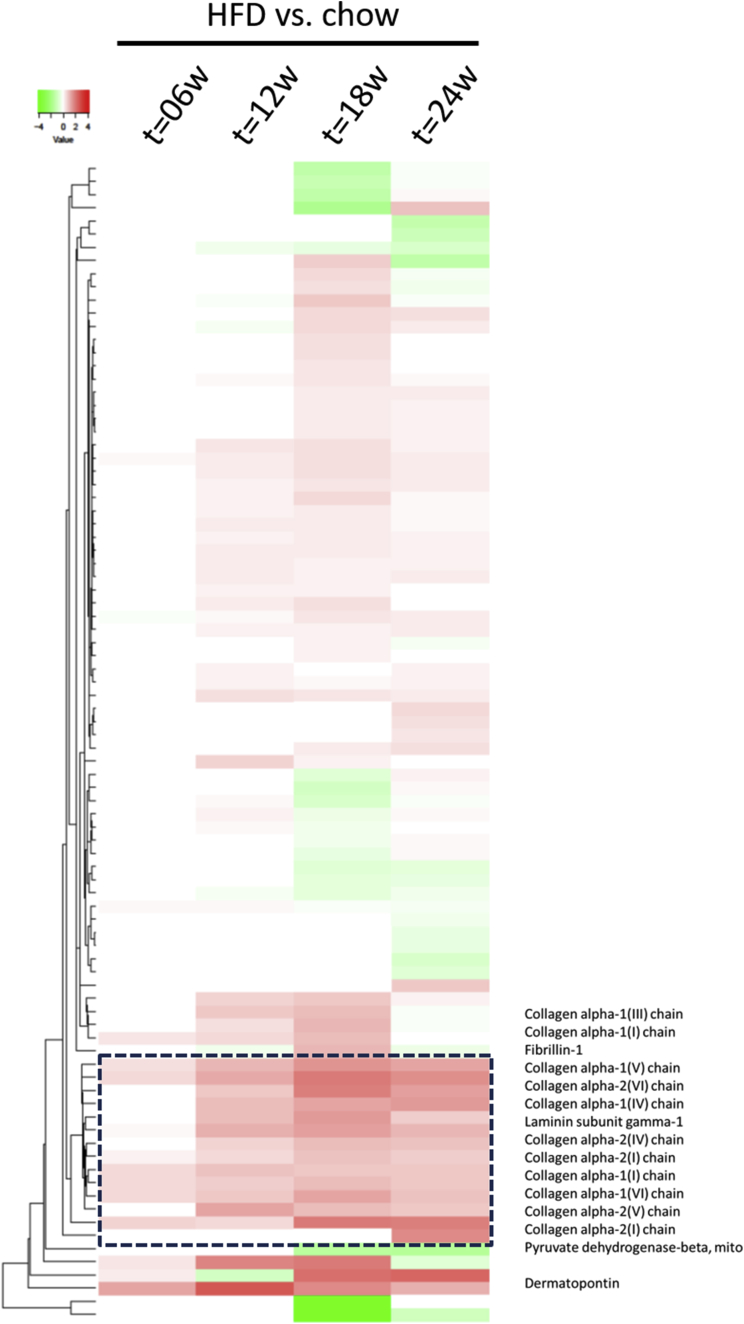
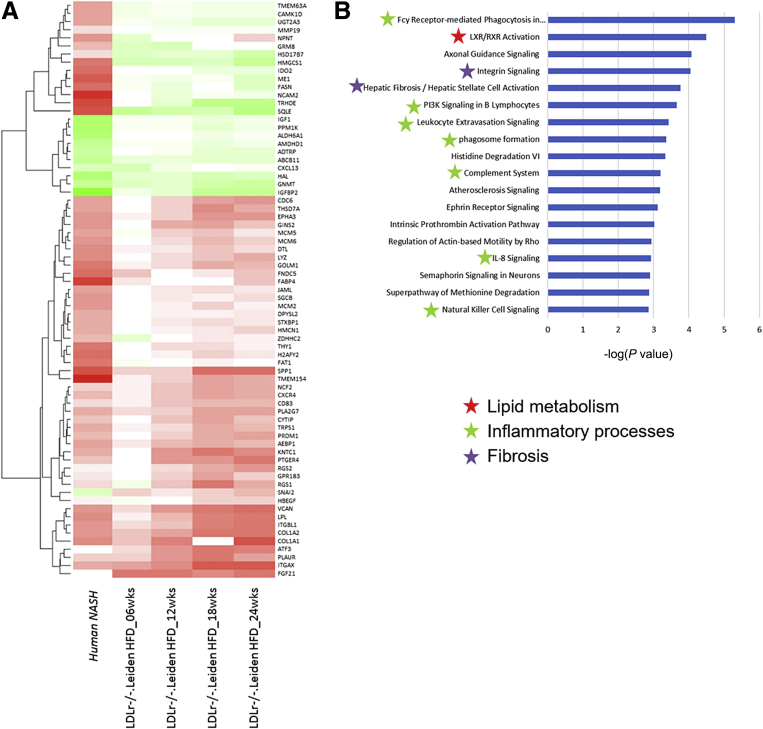
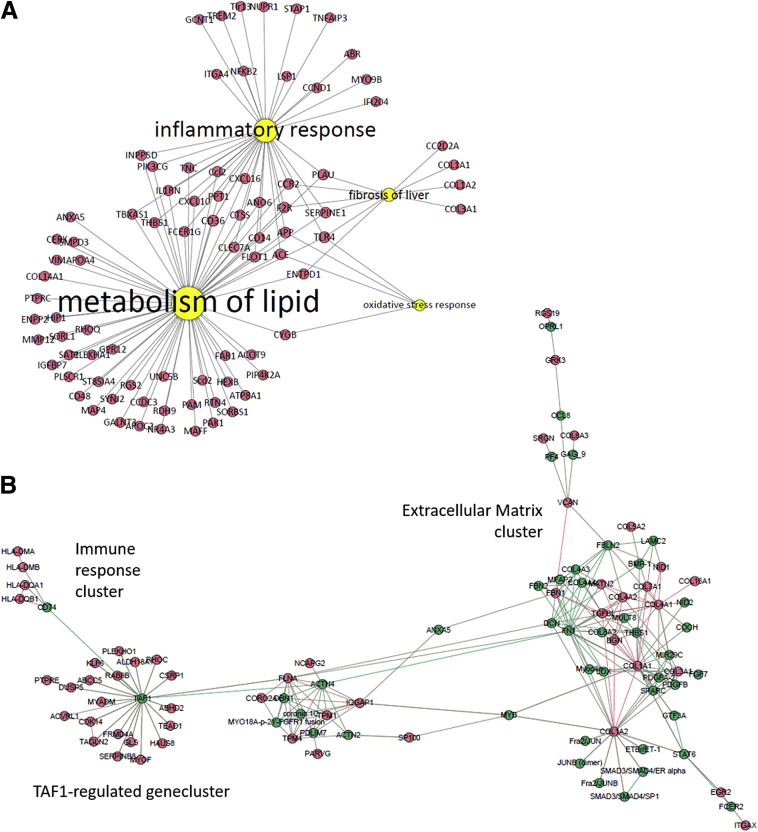
Results: High-fat-diet feeding resulted in obesity, hyperlipidemia, insulin resistance, and NASH with fibrosis in a time-dependent manner. Temporal dynamics of key molecular processes involved in the development of NASH were identified, including lipid metabolism, inflammation, oxidative stress, and fibrosis. A data-integrative approach enabled identification of the active fibrotic process preceding histopathologic detection using a novel molecular fibrosis signature. Human studies were used to identify overlap of genes and processes and to perform a network biology-based prioritization to rank top candidate markers representing the early manifestation of fibrosis.
Conclusions: An early predictive molecular signature was identified that marked the active profibrotic process before histopathologic fibrosis becomes manifest. Early detection of the onset of NASH and fibrosis enables identification of novel blood-based biomarkers to stratify patients at risk, development of new therapeutics, and help shorten (pre)clinical experimental time frames.
Keywords: ALT, alanine aminotransferase; AST, aspartate aminotransferase; DEG, differentially expressed genes; Diagnosis; ECM, extracellular matrix; HFD, high-fat diet; IPA, Ingenuity Pathway Analysis; LDLr-/-, low-density lipoprotein receptor knock out; Liver Disease; Metabolic Syndrome; NAFLD, nonalcoholic fatty liver disease; NASH, nonalcoholic steatohepatitis; Systems Biology; THBS1, thrombospontin-1.
Figures
References
-
- Wong R.J., Aguilar M., Cheung R., Perumpail R.B., Harrison S.A., Younossi Z.M., Ahmed A. Nonalcoholic steatohepatitis is the second leading etiology of liver disease among adults awaiting liver transplantation in the United States. Gastroenterology. 2015;148:547–555. - PubMed
-
- Chang Y., Jung H.-S., Cho J., Zhang Y., Yun K.E., Lazo M., Pastor-Barriuso R., Ahn J., Kim C.-W., Rampal S., Cainzos-Achirica M., Zhao D., Chung E.C., Shin H., Guallar E., Ryu S. Metabolically healthy obesity and the development of nonalcoholic fatty liver disease. Am J Gastroenterol. 2016;111:1133–1140. - PubMed
-
- Katsiki N., Mikhailidis D.P., Mantzoros C.S. Non-alcoholic fatty liver disease and dyslipidemia: an update. Metabolism. 2016;65:1109–1123. - PubMed
-
- Siddiqui M.S., Fuchs M., Idowu M.O., Luketic V.A., Boyett S., Sargeant C., Stravitz R.T., Puri P., Matherly S., Sterling R.K., Contos M., Sanyal A.J. Severity of nonalcoholic fatty liver disease and progression to cirrhosis are associated with atherogenic lipoprotein profile. Clin Gastroenterol Hepatol. 2015;13:1000–1008.e3. - PMC - PubMed
-
- Dongiovanni P., Rametta R., Meroni M., Valenti L. The role of insulin resistance in nonalcoholic steatohepatitis and liver disease development – a potential therapeutic target? Expert Rev Gastroenterol Hepatol. 2016;10:229–242. - PubMed
LinkOut - more resources
Full Text Sources
Other Literature Sources
Molecular Biology Databases
Miscellaneous
