. 2018 Apr;154(5):1449-1464.e20.
doi: 10.1053/j.gastro.2017.12.019. Epub 2017 Dec 24.

Nuclear Receptor Subfamily 1 Group D Member 1 Regulates Circadian Activity of NLRP3 Inflammasome to Reduce the Severity of Fulminant Hepatitis in Mice

Affiliations

Nuclear Receptor Subfamily 1 Group D Member 1 Regulates Circadian Activity of NLRP3 Inflammasome to Reduce the Severity of Fulminant Hepatitis in Mice

Benoit Pourcet et al. Gastroenterology. 2018 Apr.

Abstract

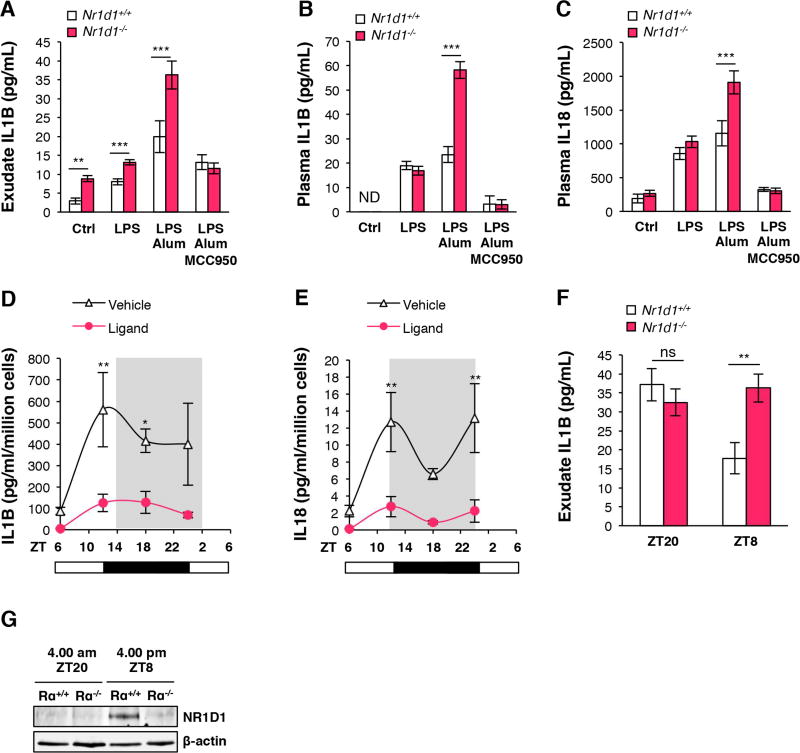
Background & aims: The innate immune system responds not only to bacterial signals, but also to non-infectious danger-associated molecular patterns that activate the NLRP3 inflammasome complex after tissue injury. Immune functions vary over the course of the day, but it is not clear whether these changes affect the activity of the NLRP3 inflammasome. We investigated whether the core clock component nuclear receptor subfamily 1 group D member 1 (NR1D1, also called Rev-erbα) regulates expression, activity of the NLRP3 inflammasome, and its signaling pathway.

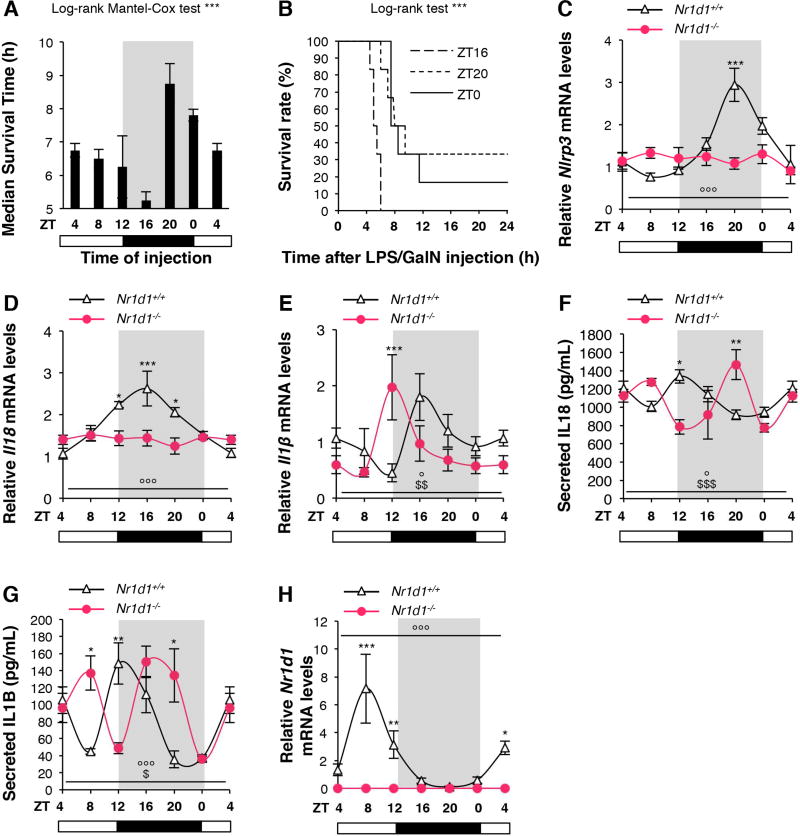
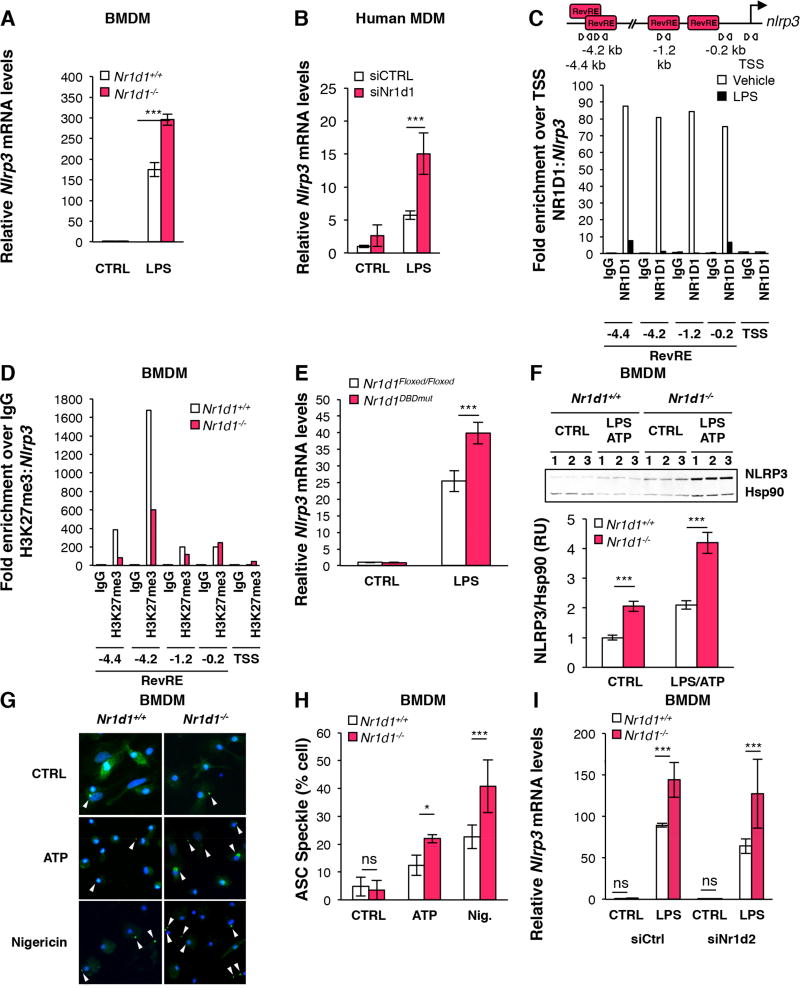
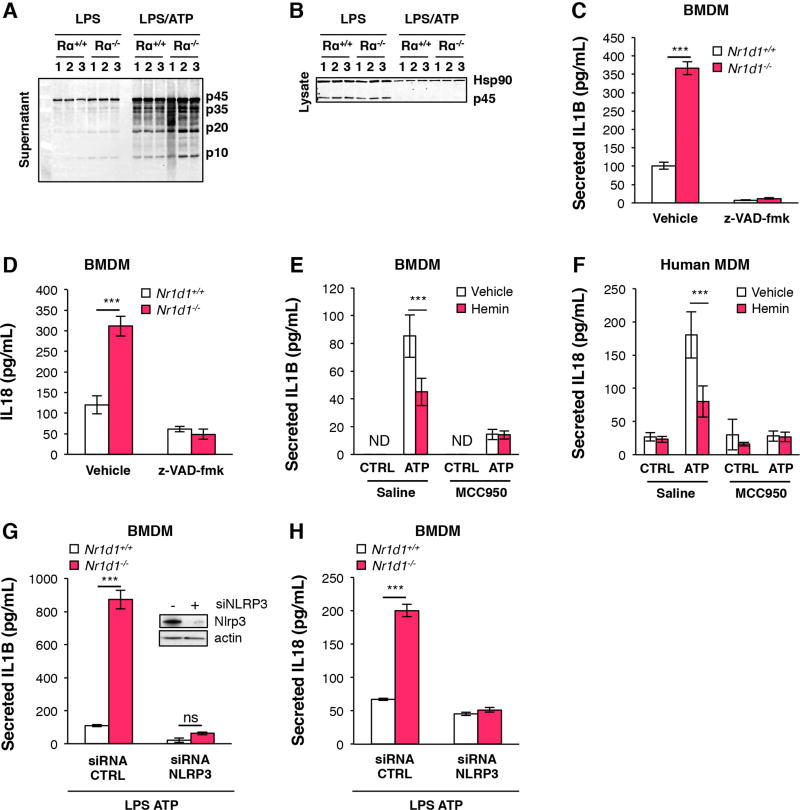
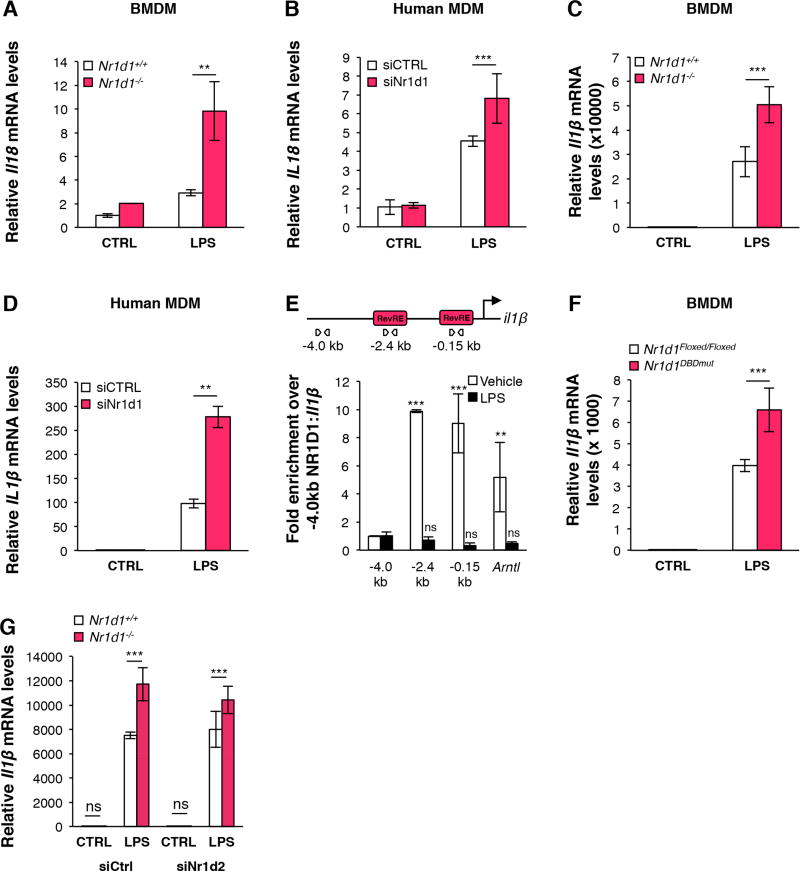
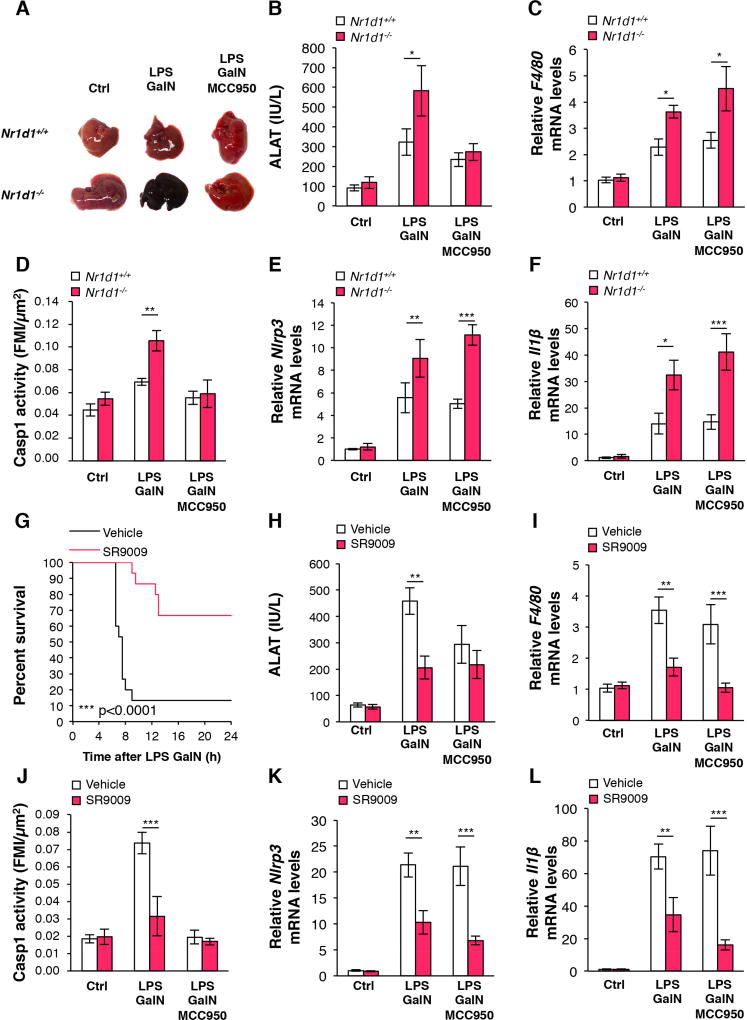
Methods: We collected naïve peritoneal macrophages and plasma, at multiple times of day, from Nr1d1-/- mice and their Nr1d1+/+ littermates (controls) and analyzed expression NLRP3, interleukin 1β (IL1B, in plasma), and IL18 (in plasma). We also collected bone marrow-derived primary macrophages from these mice. Levels of NR1D1 were knocked down with small hairpin RNAs in human primary macrophages. Bone marrow-derived primary macrophages from mice and human primary macrophages were incubated with lipopolysaccharide (LPS) to induce expression of NLRP3, IL1B, and IL18; cells were incubated with LPS and adenosine triphosphate to activate the NLRP3 complex. We analyzed caspase 1 activity and cytokine secretion. NR1D1 was activated in primary mouse and human macrophages by incubation with SR9009; some of the cells were also incubated with an NLRP3 inhibitor or inhibitors of caspase 1. Nr1d1-/- mice and control mice were given intraperitoneal injections of LPS to induce peritoneal inflammation; plasma samples were isolated and levels of cytokines were measured. Nr1d1-/- mice, control mice, and control mice given injections of SR9009 were given LPS and D-galactosamine to induce fulminant hepatitis and MCC950 to specifically inhibit NLRP3; plasma was collected to measure cytokines and a marker of liver failure (alanine aminotransferase); liver tissues were collected and analyzed by quantitative polymerase chain reaction, immunohistochemistry, and flow cytometry.

Results: In peritoneal macrophages, expression of NLRP3 and activation of its complex varied with time of day (circadian rhythm)-this regulation required NR1D1. Primary macrophages from Nr1d1-/- mice and human macrophages with knockdown of NR1D1 had altered expression patterns of NLRP3, compared to macrophages that expressed NR1D1, and altered patterns of IL1B and 1L18 production. Mice with disruption of Nr1d1 developed more-severe acute peritoneal inflammation and fulminant hepatitis than control mice. Incubation of macrophage with the NR1D1 activator SR9009 reduced expression of NLRP3 and secretion of cytokines. Mice given SR9009 developed less-severe liver failure and had longer survival times than mice given saline (control).

Conclusions: In studies of Nr1d1-/- mice and human macrophages with pharmacologic activation of NR1D1, we found NR1D1 to regulate the timing of NLRP3 expression and production of inflammatory cytokines by macrophages. Activation of NR1D1 reduced the severity of peritoneal inflammation and fulminant hepatitis in mice.

Keywords: Acute Liver Failure; Biological Clock; Immune Regulation; Rev-erbα.


Conflict of interest statement

Conflict of interest statements

The authors disclose no conflicts

Figures

Figure 1
Figure 1. NR1D1 controls daily variations in Nlrp3 expression and activation, and IL1B and IL18 secretion
(A) Survival time and (B) Survival rate after FH induction every for 4 hours. Data are means ± SEM (n=4). ***p<0.001 as determined by Log-rank Mantel Cox (A) and Log-rank (B) test. (C) Nlrp3, (D) Il18, (E) Il1β and (H) Nr1d1 mRNA levels in CD11b+ PECs from unstimulated Nr1d1+/+ or Nr1d1−/− mice obtained by peritoneal lavage around the clock (ZT4→ZT4). (F) Secreted IL18 and (G) IL1B in peritoneal lavages from unstimulated Nr1d1+/+ or Nr1d1−/− mice around the clock (ZT4→ZT4). Data are means ± SEM (n=4–7). *p<0.05, **p<0.01, ***p<0.001 as determined by two-way ANOVA and Bonferroni post-hoc test to compare Nr1d1+/+ and Nr1d1−/−. °p<0.05, °°p<0.01, °°°p<0.001 as determined by one-way ANOVA test to compare Nr1d1+/+. $p<0.05, $$p<0.01, $$$p<0.001 as determined by one-way ANOVA test to compare Nr1d1−/−. Cosinor analysis is given in Supplementary Figure 1. ZT0: lights on, ZT12: lights off.
Figure 2
Figure 2. NR1D1 directly regulates the NLRP3 inflammasome in macrophages
Nlrp3 mRNA levels in control (CTRL) and LPS-primed (LPS) (A) BMDMs from Nr1d1+/+ and Nr1d1−/− mice and in (B) MDMs transfected with siRNA against Nr1d1 (siNr1d1) or a scrambled siRNA (siCTRL) (n=3). Data are represented as means ± SD. ***p<0.001 as determined by two-way ANOVA followed by a Bonferroni post-hoc test. (C) ChIP analysis of NR1D1 occupancy to the Nlrp3 promoter in control (Vehicle) or LPS-primed (for 1 hour) BMDMs. The top diagram represents putative Rev-erb Response Elements (RevREs) unveiled by MatInspector promoter analysis. Down, ChIP analysis from one representative experiment. (D) ChIP analysis of H3K27me3 at the Nlrp3 promoter in Nr1d1+/+ and Nr1d1−/− BMDMs. (E) Nlrp3 mRNA levels in BMDMs from Nr1d1Floxed/Floxed;LysM+/+ (Nr1d1Floxed/Floxed) or Nr1d1Floxed/Floxed; LysMCre/+ (Nr1d1DBDmut) mice mice. (F) NLRP3 protein expression in control (CTRL) and LPS-primed ATP-activated (LPS ATP) BMDMs from Nr1d1+/+ or Nr1d1−/− mice (n=3). Top, the western blot and down, its quantification. ***p<0.001 as determined by two-way ANOVA followed by a Bonferroni post-hoc test. (G) ASC specks formation and (H) its quantification in LPS-primed BMDMs from Nr1d1+/+ and Nr1d1−/− mice treated with ATP, Nigericin or vehicle (CTRL). Results are presented as mean percentage of cells displaying ASC specks ± SD. *p<0.05, ***p<0.001 as determined by two-way ANOVA followed by a Bonferroni post-hoc test. (I) Nlrp3 mRNA levels in BMDMs from Nr1d1+/+ and Nr1d1−/− mice transfected with siRNA against Nr1d2 (siNr1d2) or a scrambled siRNA (siCtrl) (n=3). Data are represented as means ± SD. ***p<0.001 as determined by two-way ANOVA followed by a Bonferroni post-hoc test.
Figure 3
Figure 3. NR1D1 regulates IL18 and IL1B maturation and secretion in a NLRP3 inflammasome-dependent manner
Caspase-1 protein (sub-unit p10, p20, p35, p45) expression in supernatant (A) or lysate (B) from LPS-primed (LPS) and ATP-activated (LPS/ATP) or not (/) BMDMs from Nr1d1+/+ (Rα+/+) and Nr1d1−/− (Rα−/−) mice (representative of 3 independent experiments). (C) IL1B and (D) IL18 secreted by LPS-primed and ATP-activated BMDMs isolated from Nr1d1+/+ or Nr1d1−/− mice that were treated with low dose of caspase inhibitor z-VAD-fmk (z-VAD-fmk) or not (Vehicle) (n=3). (E) IL1B secreted by LPS-primed and ATP activated (ATP) or not (CTRL) BMDMs treated with (hemin) or its vehicle (vehicle) and with NLRP3 inhibitor MCC950 or not (Saline) (n=3). (F) IL18 secreted by LPS-primed and ATP-activated (ATP) or not (CTRL) MDMs treated with (hemin) or its vehicle (vehicle) and with NLRP3 inhibitor MCC950 or not (Saline) (n=3). (G) IL1B and (H) IL18 secreted by LPS-primed and ATP-activated BMDMs isolated from Nr1d1+/+ or Nr1d1−/− mice in which NLRP3 was silenced (siRNA NLRP3) or not (siRNA CTRL) (n=3). The top western blot (G) shows NLRP3 protein silencing. Data are represented as means ± SD. ***p<0.001 as determined by two-way ANOVA followed by a Bonferroni post-hoc test.
Figure 4
Figure 4. NR1D1 regulates IL18 and IL1B expression
(A–D) Il18 (A,B) and Il1β (C,D) mRNA levels in LPS-primed BMDMs isolated from Nr1d1+/+ or Nr1d1−/− mice (A,C) and in LPS-primed human MDMs transfected with siRNA against Nr1d1 (siNr1d1) or a scrambled siRNA (siCTRL) (B,D) (n=3). Data are represented as means ± SD. **p<0.01, ***p<0.001 as determined by two-way ANOVA followed by a Bonferroni post-hoc test. (E) ChIP analysis of NR1D1 occupancy at the Il1β and Arntl promoter (as control) in control (Vehicle) or LPS-primed (for 1 hour) BMDMs (n=3). The top diagram represents putative Rev-erb Response Elements (RevREs) unveiled by MatInspector promoter analysis. Data are represented as means ± SD. **p<0.01, ***p<0.001 as determined by an unpaired t-test. Il1β mRNA levels in LPS-primed (F) BMDMs isolated from Nr1d1Floxed/Floxed;LysM+/+ (Nr1d1Floxed/Floxed) or Nr1d1Floxed/Floxed; LysMCre/+ (Nr1d1DBDmut) mice mice and (G) BMDMs from Nr1d1+/+ and Nr1d1−/− mice transfected with siRNA against Nr1d2 (siNr1d2) or a scrambled siRNA (siCtrl) (n=3). Data are represented as means ± SD. ***p<0.001 as determined by two-way ANOVA followed by a Bonferroni post-hoc test.
Figure 5
Figure 5. NR1D1 pharmacological activation inhibits the NLRP3 inflammasome pathway in primary macrophages
(A) Nlrp3 mRNA levels in LPS-primed (LPS) or not (NT) BMDMs treated with SR9009 (n=3). (B) NLRP3 protein levels in LPS-primed (LPS) or not (/) BMDMs treated with SR9009 or DMSO (representative of 3 independent experiments). (C) NLRP3 and (E) IL1β mRNA levels in LPS-primed human MDMs pre-treated with SR9009 or not (Vehicle) (n=3). (D) Il1β and (F) Il18 mRNA levels in LPS-primed BMDMs pre-treated or not with SR9009 (n=3). (G) pro- and matured IL1B protein expression in LPS-primed BMDM or not (NT) and treated with SR9009 or not (Vhc). (H) IL1B secretion in LPS-primed and ATP-activated BMDMs pre-treated with SR9009 or not (Vehicle) (n=3) (I) IL1B and (J) IL18 secretion in LPS-primed and ATP-activated human MDMs pre-treated with SR9009 or not (Vehicle) (n=3). Data are represented as means ± SD. °°°p<0.001 in LPS vs unstimulated vehicle condition (A); *p<0.05, **p<0.01, ***p<0.001 as determined by one-way ANOVA (A) or two-way ANOVA (C–F, H–J) followed by a Bonferroni post-hoc test.
Figure 6
Figure 6. NR1D1 modulates the development of acute innate inflammation through regulation of the NLRP3 inflammasome in a peritonitis model
(A) Secreted IL1B from peritoneal lavage of Nr1d1+/+ or Nr1d1−/− mice treated with LPS, LPS + Alum, LPS + Alum + MCC950 or not (Ctrl) at ZT8 (n=6–12). (B) Plasma IL1B and (C) IL18 from Nr1d1+/+ or Nr1d1−/− mice treated as in (A) (n=6–12). (D) Secreted IL1B and (E) IL18 from peritoneal macrophages isolated around the clock from LPS-stimulated mice treated with SR10067 (Ligand) or vehicle (n=10). (F) Secreted IL1B from peritoneal lavage at ZT8 and ZT20 of Nr1d1+/+ or Nr1d1−/− mice treated with LPS + Alum (n=6–12). Data are represented as means ± SEM. *p<0.05, **p<0.01, ***p<0.001 as determined by two-way ANOVA and Bonferroni post-hoc test. (G) NR1D1 protein expression in CD11b+ PECs at ZT8 and ZT20 of Nr1d1+/+ (Rα+/+) or Nr1d1−/− (Rα−/−) mice treated with LPS + Alum (n=6–12).
Figure 7
Figure 7. NR1D1 prevents the development of fulminant hepatitis through regulation of the NLRP3 inflammasome
(A–F) Nr1d1+/+ or Nr1d1−/− mice were pre-treated with MCC950 or Saline and then intraperitoneally injected with LPS plus GalN or PBS as control (Ctrl). (A) Representative liver appearance, (B) serum ALAT activity, (C) liver F4/80 mRNA levels, (D) Caspase-1 activity in tissue sections (FMI: Fluorescence Mean Intensity) and (E) Nlrp3 and (F) Il1β mRNA levels in liver from each group as described. Data are represented as means ± SEM (n=5–11). *p<0.05, **p<0.01, ***p<0.001 as determined by two-way ANOVA and Bonferroni post-hoc test. (G–L) C57/Bl6 mice were pre-treated with SR9009 or vehicle and/or MCC950 and then challenged with LPS/GalN or PBS as control (Ctrl) as indicated. (G) Kaplan-Meier survival curve of mice challenged with LPS/GalN at ZT2 (n=15 per group). ***p<0.0001 as determined by log rank test. (H) serum ALAT activity, (I) liver F4/80 mRNA levels, (J) Caspase 1 activity in tissue sections (FMI: Fluorescence Mean Intensity), and (K) Nlrp3 and Il1β mRNA levels in liver from each group as described. Data are represented as means ± SEM (n=5–6) **p<0.01, ***p<0.001 as determined by two-way ANOVA and Bonferroni post-hoc test.

References

    1. Cardoso FS, Marcelino P, Bagulho L, et al. Acute liver failure: An up-to-date approach. J Crit Care. 2017;39:25–30. - PubMed
    1. Bass J. Circadian topology of metabolism. Nature. 2012;491:348–356. - PubMed
    1. Curtis AM, Bellet MM, Sassone-Corsi P, et al. Circadian clock proteins and immunity. Immunity. 2014;40:178–186. - PubMed
    1. Early JO, Curtis AM. Immunometabolism: Is it under the eye of the clock? Semin Immunol. 2016 - PubMed
    1. Man K, Loudon A, Chawla A. Immunity around the clock. Science. 2016;354:999–1003. - PMC - PubMed

Publication types

MeSH terms