. 2018 May 1:171:277-295.
doi: 10.1016/j.neuroimage.2017.12.040. Epub 2017 Dec 24.

Susceptibility-induced distortion that varies due to motion: Correction in diffusion MR without acquiring additional data

Affiliations

Susceptibility-induced distortion that varies due to motion: Correction in diffusion MR without acquiring additional data

Jesper L R Andersson et al. Neuroimage. .

Abstract

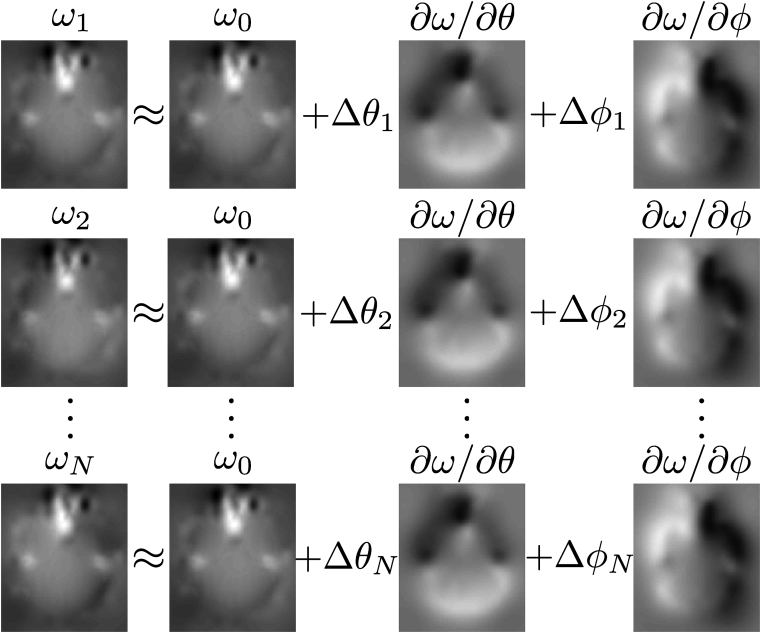
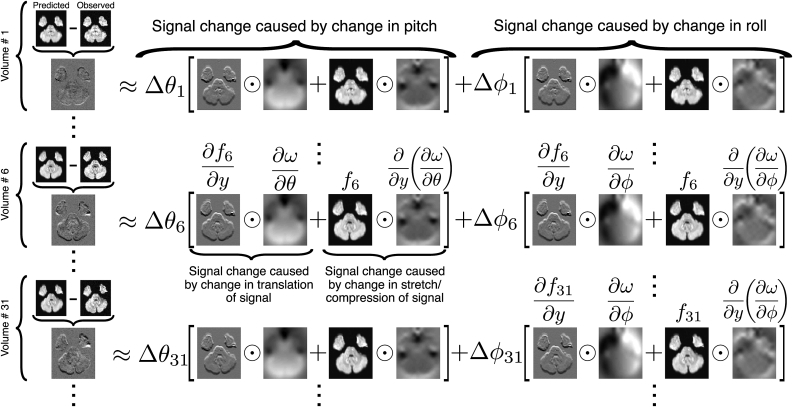
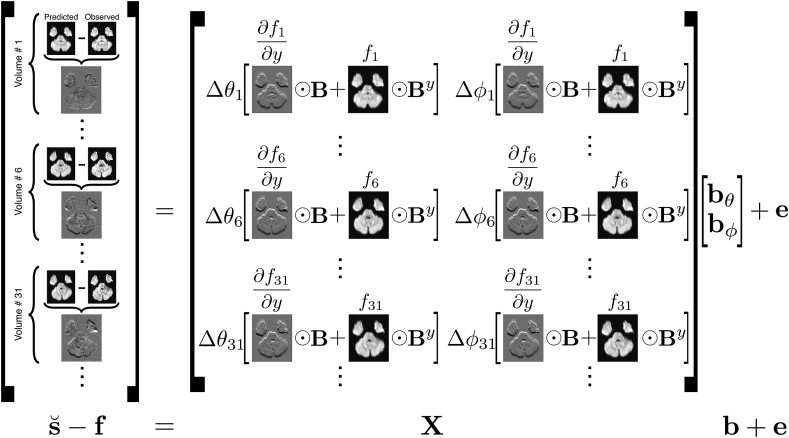
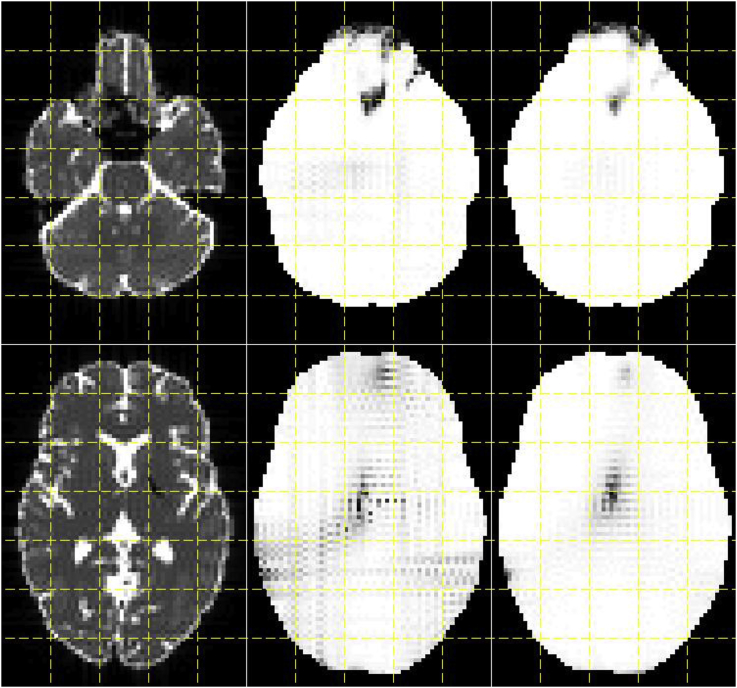
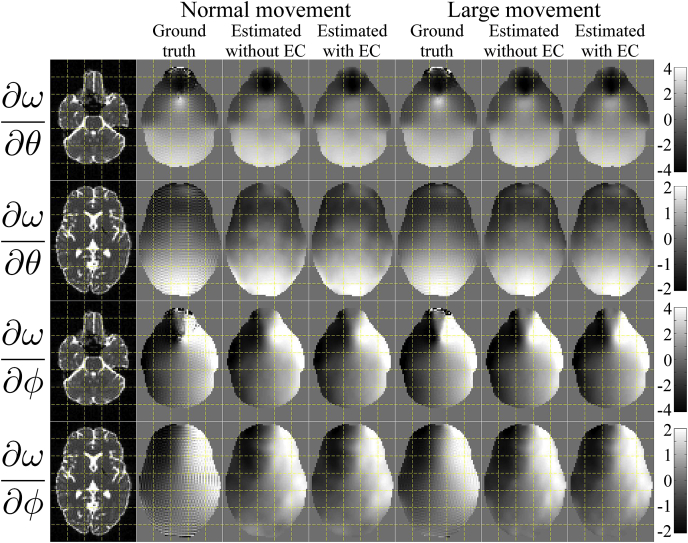
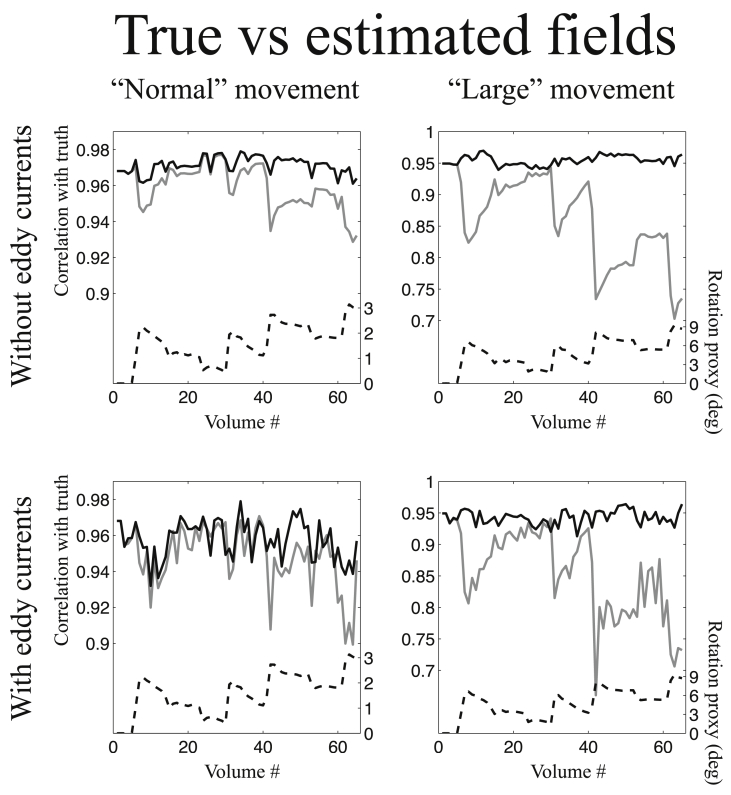
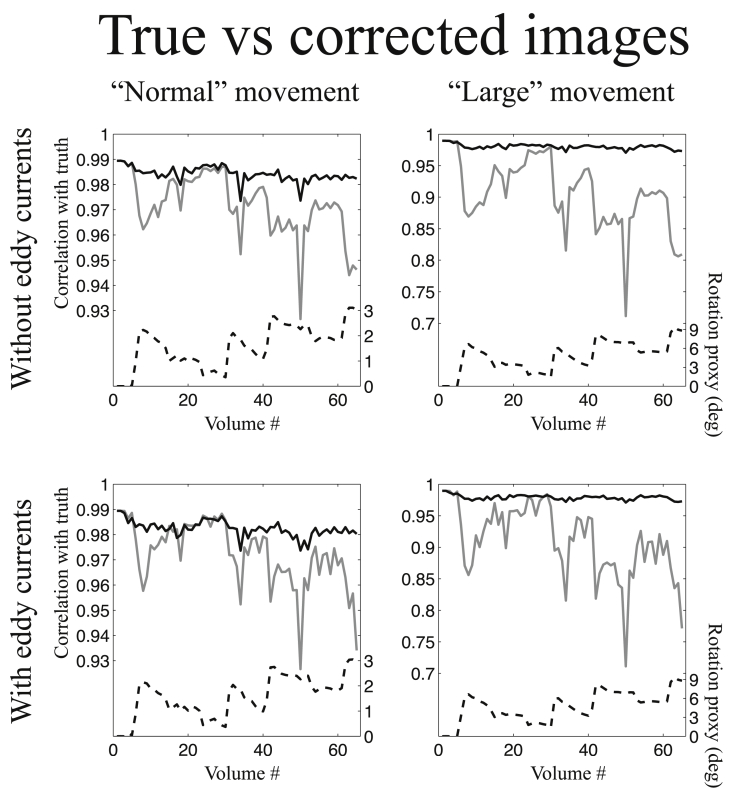
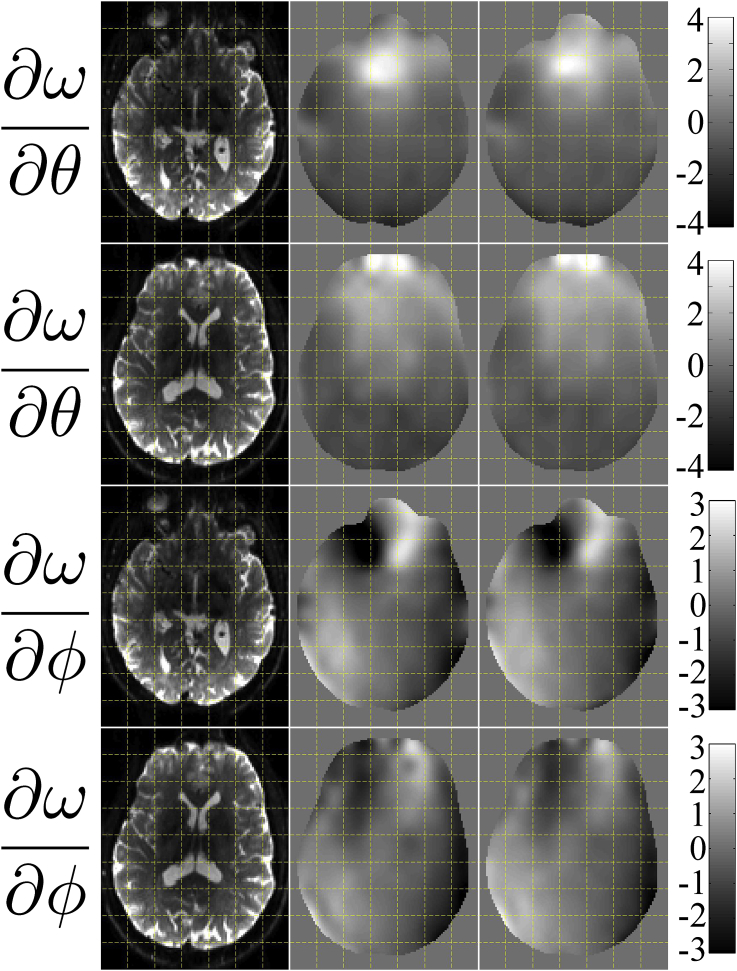
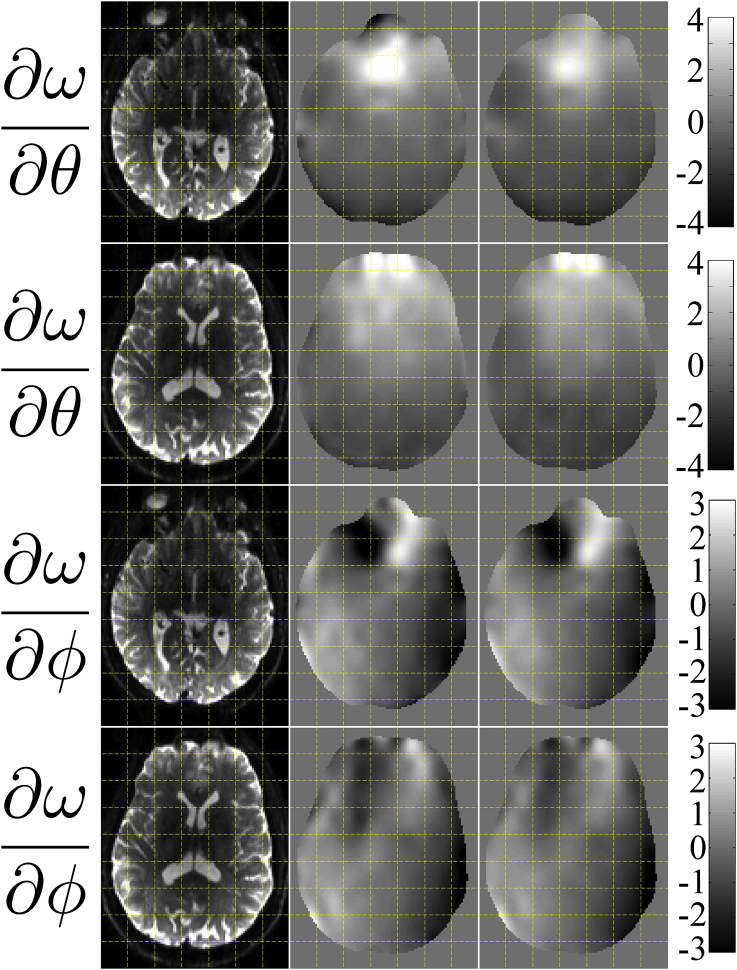
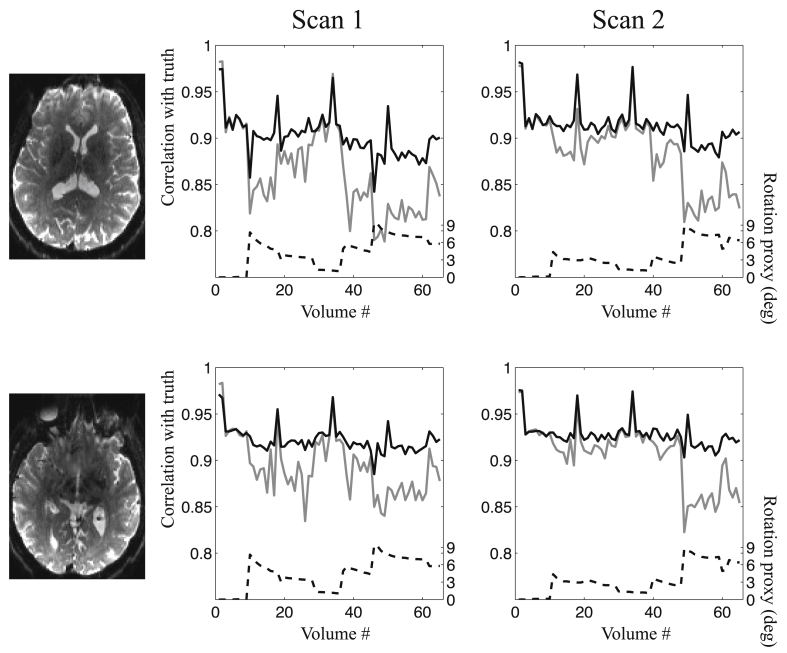
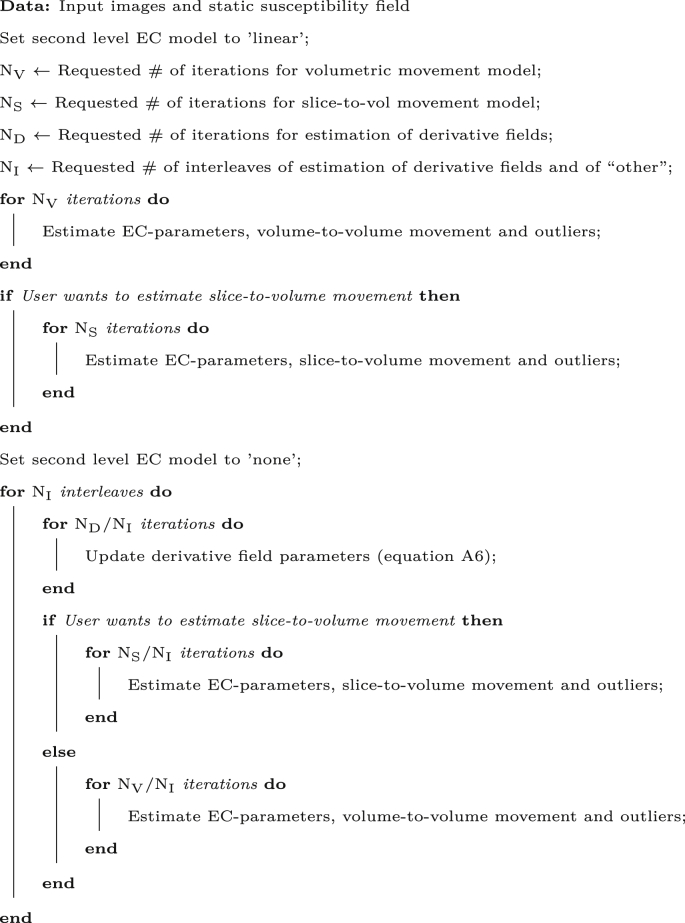
Because of their low bandwidth in the phase-encode (PE) direction, the susceptibility-induced off-resonance field causes distortions in echo planar imaging (EPI) images. It is therefore crucial to correct for susceptibility-induced distortions when performing diffusion studies using EPI. The susceptibility-induced field is caused by the object (head) disrupting the field and it is typically assumed that it remains constant within a framework defined by the object, (i.e. it follows the object as it moves in the scanner). However, this is only approximately true. When a non-spherical object rotates around an axis other than that parallel with the magnetic flux (the z-axis) it changes the way it disrupts the field, leading to different distortions. Hence, if using a single field to correct for distortions there will be residual distortions in the volumes where the object orientation is substantially different to that when the field was measured. In this paper we present a post-processing method for estimating the field as it changes with motion during the course of an experiment. It only requires a single measured field and knowledge of the orientation of the subject when that field was acquired. The volume-to-volume changes of the field as a consequence of subject movement are estimated directly from the diffusion data without the need for any additional or special acquisitions. It uses a generative model that predicts how each volume would look predicated on field change and inverts that model to yield an estimate of the field changes. It has been validated on both simulations and experimental data. The results show that we are able to track the field with high accuracy and that we are able to correct the data for the adverse effects of the changing field.

Keywords: Diffusion; Dynamic; Movement; Registration; Susceptibility.


Figures

Fig. 1
Fig. 1
The figure is a graphical depiction of equation (2) and shows how the field ωi for any volume i is approximated by a linear combination of a measured field ω0 and the derivative of that field with respect to θ (rotation around the x-axis) and ϕ (rotation around the y-axis). The weights for the derivative fields are given by the estimated movement parameters where Δθi denotes the rotation around the x-axis of volume i relative the orientation that ω0 was acquired in (and correspondingly for Δϕi). The maps in the figure are estimated from our simulations and the grey-scales are −40 to 100 Hz for the wi fields and −5 to 5 Hz/degree for the ω/θ and ω/ϕ fields. An intuitive description of the ω/θ field is “How much the field changes if one nods forward (looks down) one degree”. The corresponding description for ω/ϕ would be “How much the field changes if one tilts one's head to the right (in the direction of the dark part of the field) one degree.
Fig. 2
Fig. 2
This figure illustrates the forward model that explains the difference between observations and predictions as the result of a changing off-resonance field. It demonstrates how the total difference can be described as the sum of the signal changes caused by a change in pitch and the signal changes caused by a change in roll. The signal changes can be further subdivided into changes in translation of the signal along the PE-direction (i.e. how the sampling point in the predicted image changes) and changes in Jacobian modulation (intensity changes caused by stretching/compression). The choice of volumes 1, 6 and 31 for demonstration is arbitrary and the model of course encompasses all volumes (both b=0 and DWI volumes). The symbol was used to denote Hadamard (or elementwise) product.
Fig. 3
Fig. 3
This figure shows the matrix-vector equation s˘f=Xb+e that is solved for bˆ in a least squares sense. The matrix X implements the forward model described in Fig. 2, but with a spatial basis set B in lieu of the (unknown) derivative fields. The vector b=[bθTbϕT]T contains the weights for the fields ω/θ and ω/ϕ such that Bbˆθ is an estimate of ω/θ. By denotes a matrix that is organised in the same way as B, but where the columns consists of splines that have been differentiated in the y-direction (PE-direction).
Fig. 4
Fig. 4
This figure shows the R2-maps that demonstrate the proportion of true variance in the simulated off-resonance fields explained by a first order model. The left column shows b=0 images for anatomical guidance. The middle and rightmost columns show the R2-maps for the “normal” and “large” movement simulations respectively. The grey-scale goes from 0 (black) to 1 (white).
Fig. 5
Fig. 5
This figure shows the true and estimated maps of ω/θ and ω/ϕ (top two and bottom two rows respectively) when using simulations with volumetric movement, phase-encoding AP and an SNR of 40. The first column shows the true b=0 images for anatomical guidance. Columns 2–4 show the results for the “normal” movement case. Column 2 shows the “truth”, column 3 the estimated fields for the “No eddy currents” case and column 4 the estimated fields when they were jointly estimated with eddy current-induced fields. Correspondingly columns 5–7 show the results for the “large” movement case, where column 5 is the “truth” and columns 6 and 7 shows the estimated fields in the absence and presence of eddy current-induced fields respectively. The units of the colorbars are Hz/degree.
Fig. 6
Fig. 6
This figure shows the correlation between true and estimated off-resonance fields for all volumes of the simulated data. The data used for this figure was simulated such that the phase encode direction was AP and the SNR was 40. The solid black and solid grey lines represent the correlation between true and estimated off-resonance fields for the method in the present paper and the method assuming a constant susceptibility field respectively. The scale for both these curves is found on the left-hand of the graphs. The dashed black line shows a “proxy” for the rotation relevant to susceptibility field. It was calculated as Rx2+Ry2 where Rx and Ry denote rotation around the x- and y-axes respectively. The scale for that curve is found on the right hand side of the graphs. The graphs in the left column show the results for “normal” subject movement and the right column for “large” movement. The top row shows the situation when no eddy current distortions were simulated and no attempt was made to estimate eddy currents. The bottom row shows the situation when eddy currents were included in the simulations and eddy currents and susceptibility-by-movement were jointly estimated by eddy.
Fig. 7
Fig. 7
This figure shows the correlation between true and corrected images for all volumes of the simulated data. The data used for this figure was simulated such that the phase encode direction was AP, the SNR was 40 and all movement was “inter-volume”, i.e. any movement was assumed to occur between acquisition of consecutive volumes. Correspondingly the analysis used a volumetric movement model. The solid black and solid grey lines represent the correlation between true and corrected images for the method in the present paper and the method assuming a constant susceptibility field respectively. See the legend for Fig. 6 for more details.
Fig. 8
Fig. 8
This figure shows the correlation between true and corrected images for all volumes of the simulated data. The data used for this figure was simulated such that the phase encode direction was AP, the SNR was 40 and movement was continuous, i.e. volumes occurring during periods of rapid movement were corrupted by intra-volume movement. Correspondingly the analysis used a slice-to-volume movement model. The solid black and solid grey lines represent the correlation between true and corrected images for the method in the present paper and the method assuming a constant susceptibility field respectively. See the legend for Fig. 6 for more details.
Fig. 9
Fig. 9
This figure shows the test-retest agreement of derivative fields estimated from two different data sets in the same subject. The first column is shown for anatomical reference and the two rightmost columns show the estimated derivative fields. The top two rows show the rate-of-change of the field with respect to pitch, and the bottom two rows with respect to roll. The units of the fields are Hz/degree rotation.
Fig. 10
Fig. 10
This figure shows the agreement between derivative fields estimated from b=0 volumes only (middle column) and from a diffusion data set (right column). The first column contains a corresponding b=0 volume after correction for susceptibility distortions, and is shown for anatomical reference. The top two rows show the rate-of-change of the field with respect to pitch, and the bottom two rows with respect to roll. The units of the fields are Hz/degree rotation.
Fig. 11
Fig. 11
This figure shows the volume-wise correlation with “truth” when performing correction with (solid black line) and without (solid grey line) susceptibility-by-movement correction. The images to the left show the slices where the comparisons were made for the two rows. The leftmost plot pertains to the first scan and the rightmost to the second scan.
Image 1

References

    1. Alhamud A.A., Tisdall M.D., Hess A.T., Hassan K.M., Meintjes E.M., van der Kouwe A.J.W. Volumetric navigators for real-time motion correction in diffusion tensor imaging. Magn. Reson. Med. 2012;68:1097–1108. - PMC - PubMed
    1. Alhamud A.A., Taylor P.A., van der Kouwe A.J.W., Meintjes E.M. Real-time measurement and correction of both B0 changes and subject motion in diffusion tensor imaging using a double volumetric navigated (DvNav) sequence. Neuroimage. 2016;126:60–71. - PMC - PubMed
    1. Andersson J.L.R., Sotiropoulos S.N. Non-parametric representation and prediction of single- and multi-shell diffusion-weighted MRI data using Gaussian processes. Neuroimage. 2015;122:166–176. - PMC - PubMed
    1. Andersson J.L.R., Sotiropoulos S.N. An integrated approach to correction for off-resonance effects and subject movement in diffusion MR imaging. Neuroimage. 2016;125:1063–1078. - PMC - PubMed
    1. Andersson J.L.R., Hutton C., Ashburner J., Turner R., Friston K. Modelling geometric deformations in EPI time series. Neuroimage. 2001;13:903–919. - PubMed

Publication types