

A multicentre study investigating vital sign changes occurring in complicated and uncomplicated transfusions
- PMID: 29277907
- PMCID: PMC5812819
- DOI: 10.1111/vox.12621
A multicentre study investigating vital sign changes occurring in complicated and uncomplicated transfusions
Abstract
Background and objectives: Many hospitals require transfusions to be discontinued when vital signs stray from predetermined ranges, regardless of clinical symptoms. Variations in vital signs may be unrelated to transfusion, however, and needlessly stopping a transfusion may delay medical care while increasing donor exposures and healthcare costs. We hypothesized that a detailed study of vital sign changes associated with transfusion of blood product by component, including those associated with potential reactions (complicated) and those deemed to be uncomplicated, would establish a useful framework of reference for treating clinicians and transfusion services alike.
Materials and methods: A retrospective electronic record review of transfusion service and transfusion recipient data was completed on 3852 inpatient transfusion episodes over a 6-month period at four academic tertiary care hospitals across the United States. Vital signs pre- and post-transfusion were recorded by trained clinical research nurses. Serious reactions were adjudicated by a panel of transfusion medicine experts.
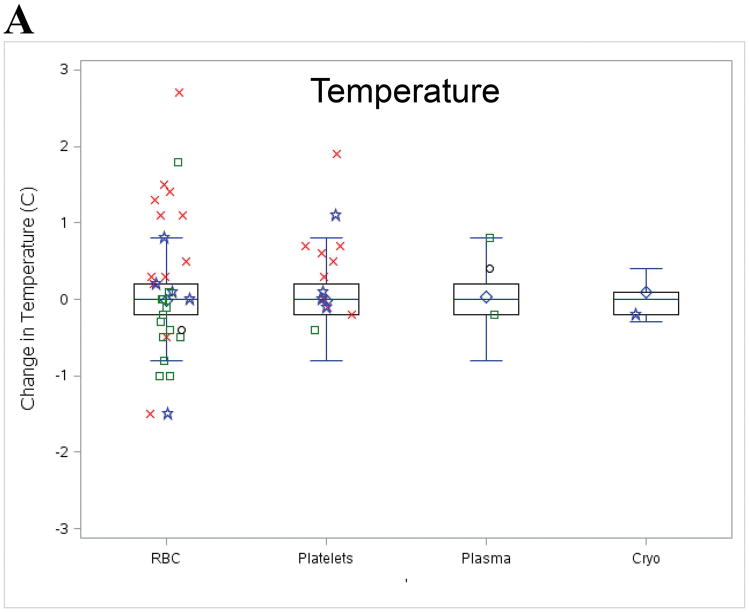
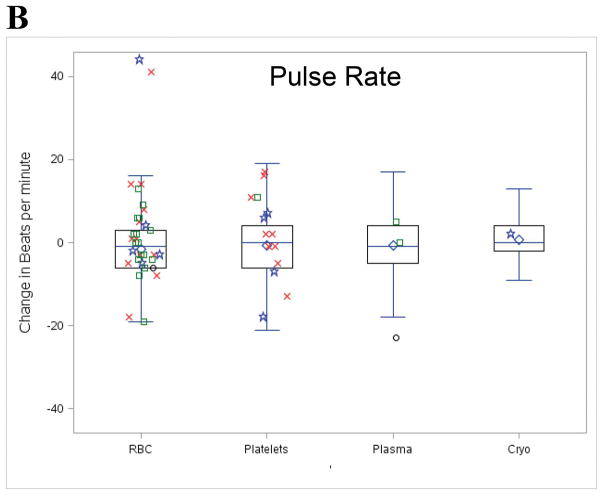
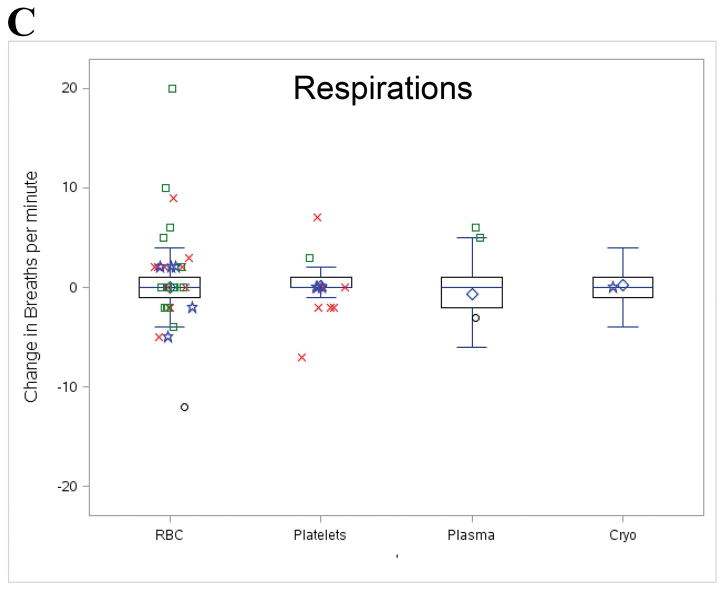
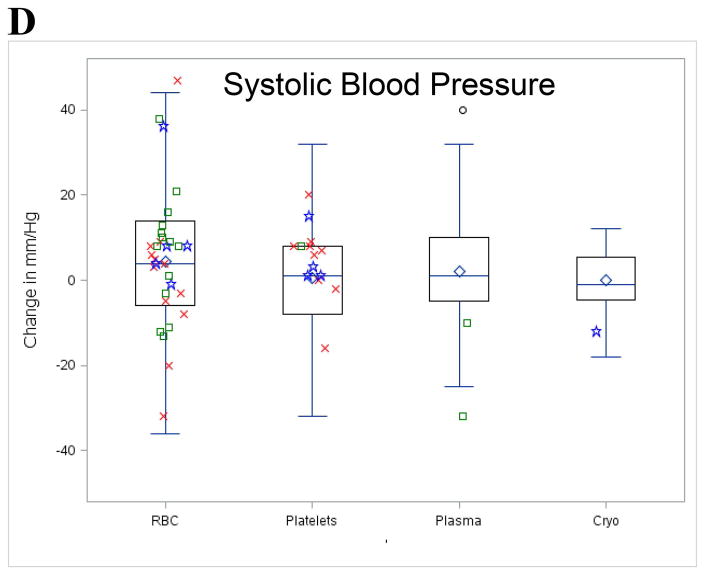
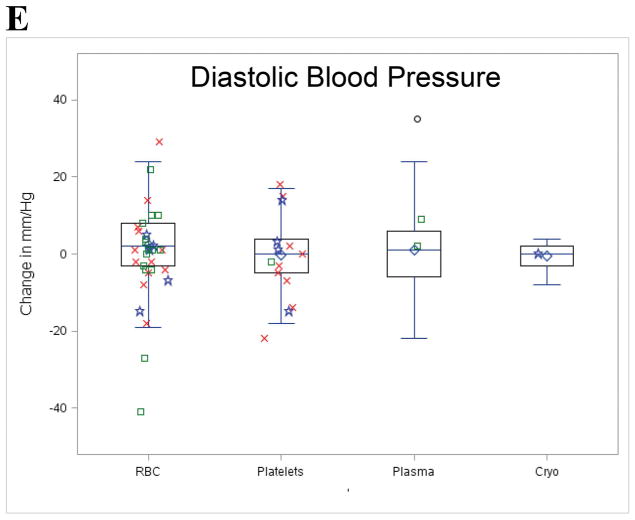
Results: In both uncomplicated transfusions (n = 3765) and those including an adverse reaction (n = 87), vital sign fluctuations were generally modest. Compared to uncomplicated transfusions, transfusions complicated by febrile reactions were associated with higher pretransfusion temperature and higher pretransfusion pulse rates. Episodes of transfusion circulatory overload were associated with higher pretransfusion respiration rates compared to uncomplicated transfusions.
Conclusion: Most transfusions are associated with only modest changes in vital signs. Pretransfusion vital signs may be an important yet previously understudied predictor of vital sign changes during transfusion. The optimal role of vital sign assessment during blood transfusion deserves further study.
Keywords: blood safety; patient blood management; transfusion reactions.
© 2017 International Society of Blood Transfusion.
Figures
References
-
- Whitaker BI, Rajbhandary SR, Harris A. The 2013 AABB Blood Collection, Utilization and Patient Blood Management Survey Report. AABB Press; 2015. [Accessed 1-23-2017]. Available at: http://www.aabb.org/research/hemovigilance/bloodsurvey/Docs/2013-AABB-Bl....
-
- Bolton-Maggs PHB. Poles D, et al., editors. on behalf of the Serious Hazards of Transfusion (SHOT) Steering Group. [Accessed 7-29-16];The 2015 Annual SHOT Report. 2016 Available at: http://www.shotuk.org/wp-content/uploads/SHOT-2015-Annual-Report-Web-Edi....
-
- King KE, Shirey S, Thoman SK, et al. Universal leukoreduction decreases the incidence of febrile nonhemolytic transfusion reactions to RBCs. Transfusion. 2004;44:25–29. - PubMed
-
- U.S. Centers for Disease Control and Prevention. The National Healthcare Safety Network (NHSN) Manual: Biovigilance Component v2.2. Atlanta, GA: Division of Healthcare Quality Promotion, National Center for Emerging Zoonotic Infectious Diseases; [Accessed 7-29-2016]. Available at: http://www.cdc.gov/nhsn/pdfs/biovigilance/bv-hv-protocol-current.pdf.
Publication types
MeSH terms
Grants and funding
LinkOut - more resources
Full Text Sources
Other Literature Sources
Medical
