

Role of fetal nutrient restriction and postnatal catch-up growth on structural and mechanical alterations of rat aorta
- PMID: 29277911
- PMCID: PMC6265550
- DOI: 10.1113/JP275030
Role of fetal nutrient restriction and postnatal catch-up growth on structural and mechanical alterations of rat aorta
Abstract
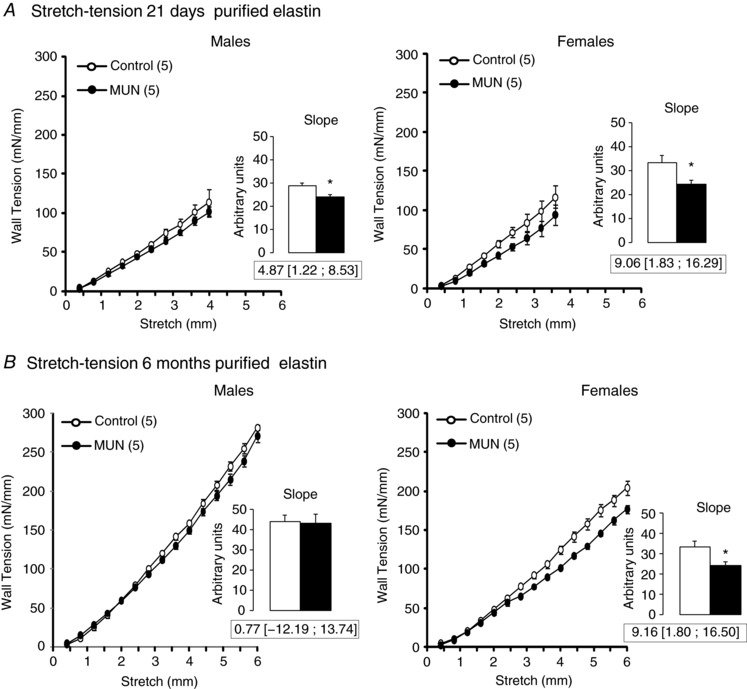
Key points: Intrauterine growth restriction (IUGR), induced by maternal undernutrition, leads to impaired aortic development. This is followed by hypertrophic remodelling associated with accelerated growth during lactation. Fetal nutrient restriction is associated with increased aortic compliance at birth and at weaning, but not in adult animals. This mechanical alteration may be related to a decreased perinatal collagen deposition. Aortic elastin scaffolds purified from young male and female IUGR animals also exhibit increased compliance, only maintained in adult IUGR females. These mechanical alterations may be related to differences in elastin deposition and remodelling. Fetal undernutrition induces similar aortic structural and mechanical alterations in young male and female rats. Our data argue against an early mechanical cause for the sex differences in hypertension development induced by maternal undernutrition. However, the larger compliance of elastin in adult IUGR females may contribute to the maintenance of a normal blood pressure level.
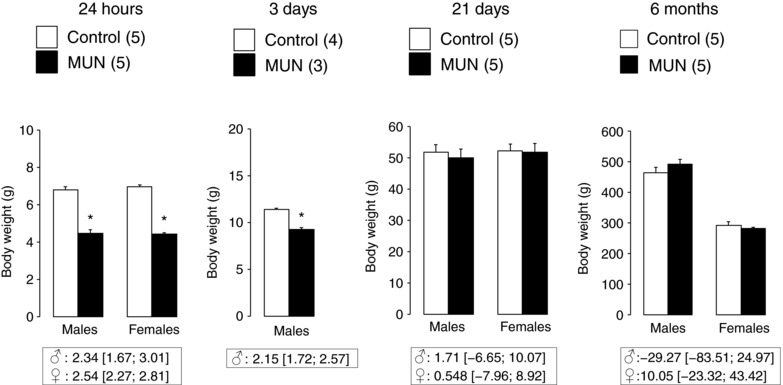
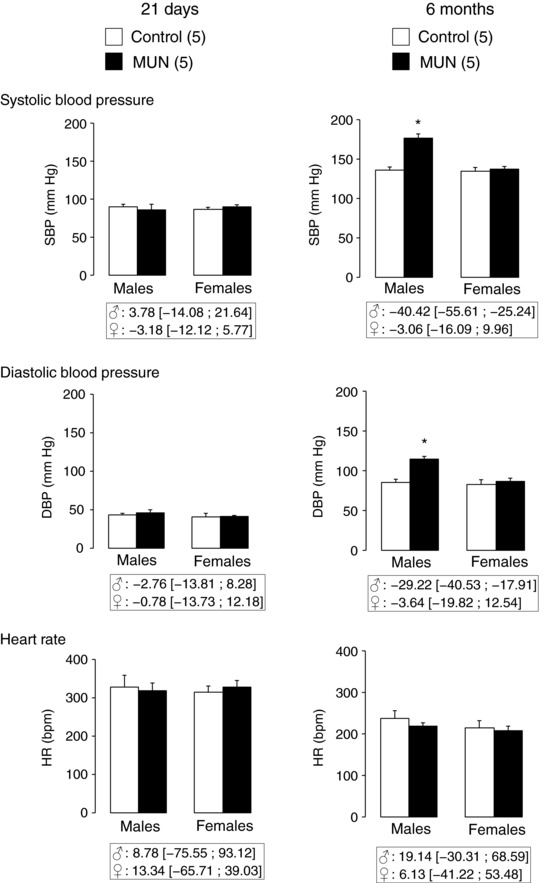
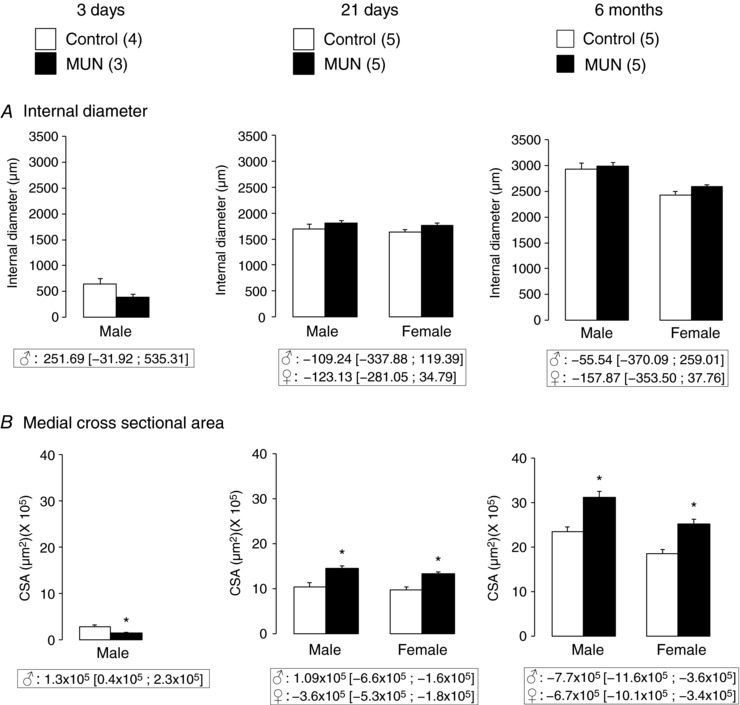
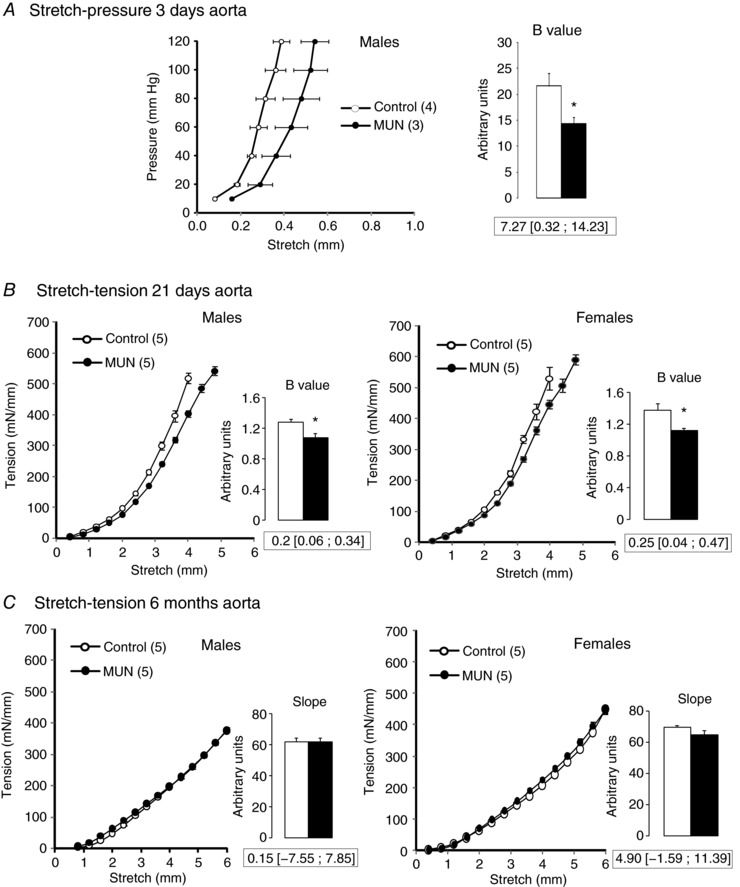
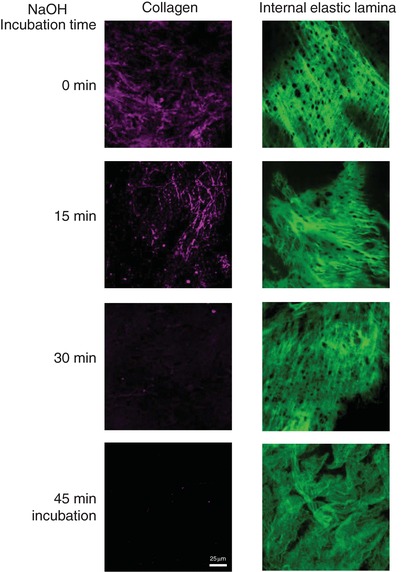
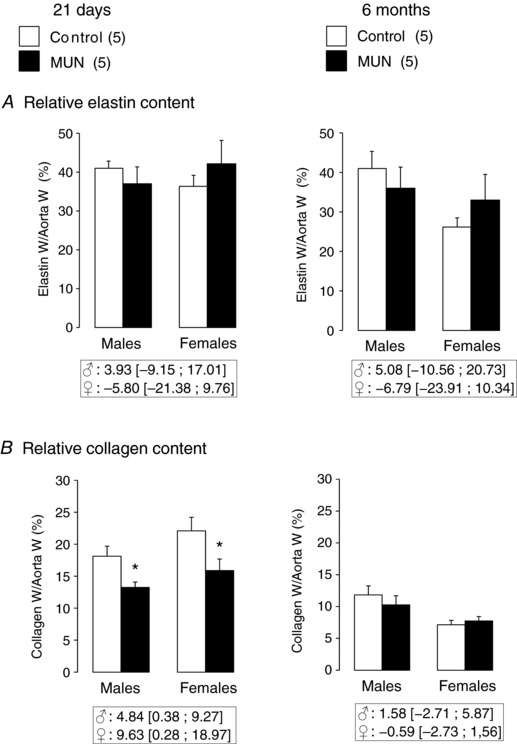
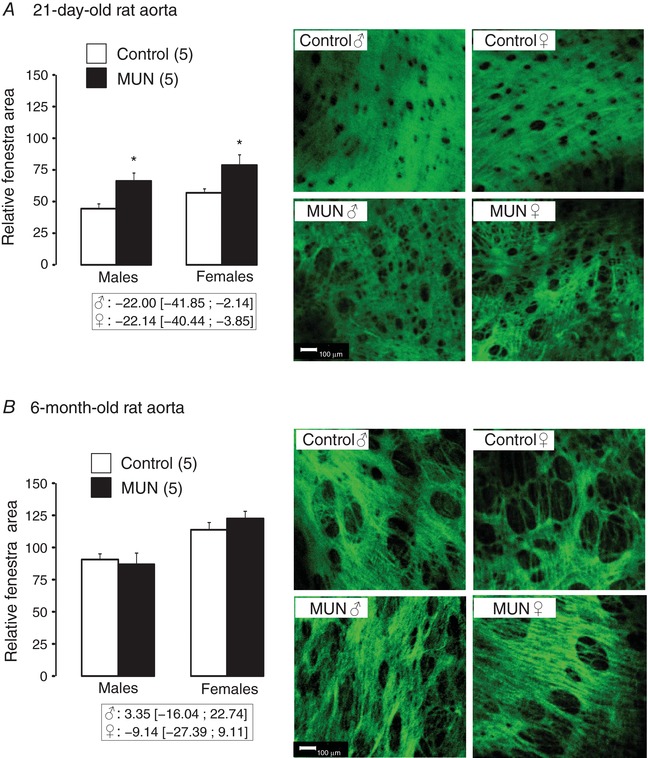
Abstract: Fetal undernutrition programmes hypertension development, males being more susceptible. Deficient fetal elastogenesis and vascular growth is a possible mechanism. We investigated the role of aortic mechanical alterations in a rat model of hypertension programming, evaluating changes at birth, weaning and adulthood. Dams were fed ad libitum (Control) or 50% of control intake during the second half of gestation (maternal undernutrition, MUN). Offspring aged 3 days, 21 days and 6 months were studied. Blood pressure was evaluated in vivo. In the thoracic aorta we assessed gross structure, mechanical properties (intact and purified elastin), collagen and elastin content and internal elastic lamina (IEL) organization. Only adult MUN males developed hypertension (systolic blood pressure: MUNmales = 176.6 ± 5.6 mmHg; Controlmales = 136.1 ± 4.9 mmHg). At birth MUN rats were lighter, with smaller aortic cross-sectional area (MUNmales = (1.51 ± 0.08) × 105 μm2 , Controlmales = (2.8 ± 0.04) × 105 μm2 ); during lactation MUN males and females exhibited catch-up growth and aortic hypertrophy (MUNmales = (14.5 ± 0.5) × 105 μm2 , Controlmales = (10.4 ± 0.9) × 105 μm2 ), maintained until adulthood. MUN aortas were more compliant until weaning (functional stiffness: MUNmales = 1.0 ± 0.04; Controlmales = 1.3 ± 0.03), containing less collagen with larger IEL fenestrae, returning to normal in adulthood. Purified elastin from young MUN offspring was more compliant in both sexes; only MUN adult females maintained larger elastin compliance (slope: MUNfemales = 24.1 ± 1.9; Controlfemales = 33.3 ± 2.8). Fetal undernutrition induces deficient aortic development followed by hypertrophic remodelling and larger aortic compliance in the perinatal period, with similar alterations in collagen and elastin in both sexes. The observed alterations argue against an initial mechanical cause for sex differences in hypertension development. However, the maintenance of high elastin compliance in adult females might protect them against blood pressure rise.
Keywords: IUGR; collagen; elastin; fetal programming; hypertension; sexual dimorphism; vascular mechanics.
© 2017 The Authors. The Journal of Physiology © 2017 The Physiological Society.
Figures
Comment in
-
A tough life in utero doesn't necessarily make for a stiff future: sex matters for aortic passive mechanics.J Physiol. 2018 Dec;596(23):5491-5492. doi: 10.1113/JP275701. Epub 2018 Jan 15. J Physiol. 2018. PMID: 29282735 Free PMC article. No abstract available.
Similar articles
-
Fetal Undernutrition Induces Resistance Artery Remodeling and Stiffness in Male and Female Rats Independent of Hypertension.Biomedicines. 2020 Oct 16;8(10):424. doi: 10.3390/biomedicines8100424. Biomedicines. 2020. PMID: 33081182 Free PMC article.
-
Intrauterine growth restriction influences vascular remodeling and stiffening in the weanling rat more than sex or diet.Am J Physiol Heart Circ Physiol. 2017 Feb 1;312(2):H250-H264. doi: 10.1152/ajpheart.00610.2016. Epub 2016 Nov 23. Am J Physiol Heart Circ Physiol. 2017. PMID: 27881387
-
Long term effects of fetal undernutrition on rat heart. Role of hypertension and oxidative stress.PLoS One. 2017 Feb 17;12(2):e0171544. doi: 10.1371/journal.pone.0171544. eCollection 2017. PLoS One. 2017. PMID: 28212445 Free PMC article.
-
HPA axis programming by maternal undernutrition in the male rat offspring.Psychoneuroendocrinology. 2007 Aug;32 Suppl 1:S16-20. doi: 10.1016/j.psyneuen.2007.03.014. Epub 2007 Jul 17. Psychoneuroendocrinology. 2007. PMID: 17644270 Review.
-
Sex differences in the fetal programming of hypertension.Gend Med. 2008;5 Suppl A(Suppl A):S121-32. doi: 10.1016/j.genm.2008.03.012. Gend Med. 2008. PMID: 18395678 Free PMC article. Review.
Cited by
-
Implication of RAS in Postnatal Cardiac Remodeling, Fibrosis and Dysfunction Induced by Fetal Undernutrition.Pathophysiology. 2021 Jun 5;28(2):273-290. doi: 10.3390/pathophysiology28020018. Pathophysiology. 2021. PMID: 35366262 Free PMC article.
-
Elevated Vascular Sympathetic Neurotransmission and Remodelling Is a Common Feature in a Rat Model of Foetal Programming of Hypertension and SHR.Biomedicines. 2022 Aug 5;10(8):1902. doi: 10.3390/biomedicines10081902. Biomedicines. 2022. PMID: 36009448 Free PMC article.
-
Fetal Undernutrition Induces Resistance Artery Remodeling and Stiffness in Male and Female Rats Independent of Hypertension.Biomedicines. 2020 Oct 16;8(10):424. doi: 10.3390/biomedicines8100424. Biomedicines. 2020. PMID: 33081182 Free PMC article.
-
Challenges and controversies in perinatal physiology.J Physiol. 2018 Dec;596(23):5485-5489. doi: 10.1113/JP276299. J Physiol. 2018. PMID: 30499159 Free PMC article. No abstract available.
-
Association between Neonatal Intakes and Hyperglycemia, and Left Heart and Aortic Dimensions at 6.5 Years of Age in Children Born Extremely Preterm.J Clin Med. 2021 Jun 9;10(12):2554. doi: 10.3390/jcm10122554. J Clin Med. 2021. PMID: 34207785 Free PMC article.
References
-
- Angus JA & Wright CE (2000). Techniques to study the pharmacodynamics of isolated large and small blood vessels. J Pharmacol Toxicol Methods 44, 395–407. - PubMed
-
- Arribas SM, Briones AM, Bellingham C, Gonzalez MC, Salaices M, Liu K, Wang Y & Hinek A (2008). Heightened aberrant deposition of hard‐wearing elastin in conduit arteries of prehypertensive SHR is associated with increased stiffness and inward remodeling. Am J Physiol Heart Circ Physiol 295, H2299–H2307. - PubMed
-
- Berry CL, Looker T & Germain J (1972). Nucleic acid and scleroprotein content of the developing human aorta. J Pathol 108, 265–274. - PubMed
Publication types
MeSH terms
Substances
Grants and funding
LinkOut - more resources
Full Text Sources
Other Literature Sources