. 2018 Mar;22(3):1583-1600.
doi: 10.1111/jcmm.13434. Epub 2017 Dec 26.

Monotropein promotes angiogenesis and inhibits oxidative stress-induced autophagy in endothelial progenitor cells to accelerate wound healing

Affiliations

Monotropein promotes angiogenesis and inhibits oxidative stress-induced autophagy in endothelial progenitor cells to accelerate wound healing

Chenggui Wang et al. J Cell Mol Med. 2018 Mar.

Erratum in

  •  .
    [No authors listed] [No authors listed] J Cell Mol Med. 2021 Nov;25(21):10322-10325. doi: 10.1111/jcmm.16995. J Cell Mol Med. 2021. PMID: 34747104 Free PMC article. No abstract available.

Abstract

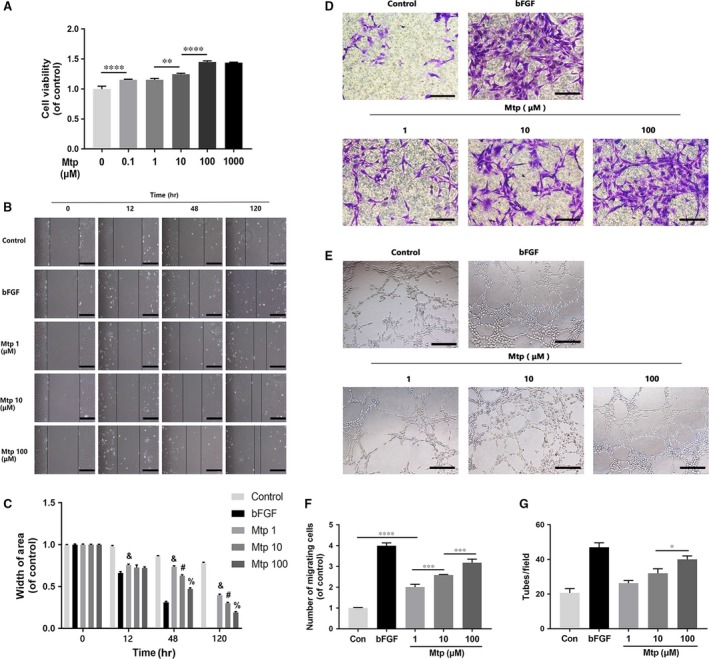
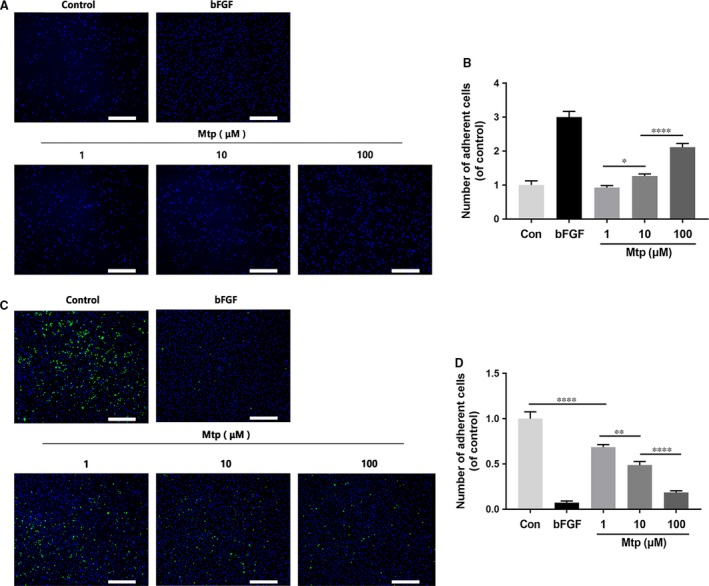
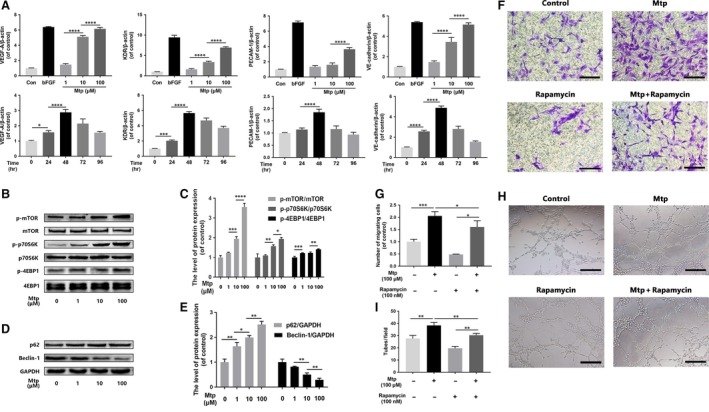
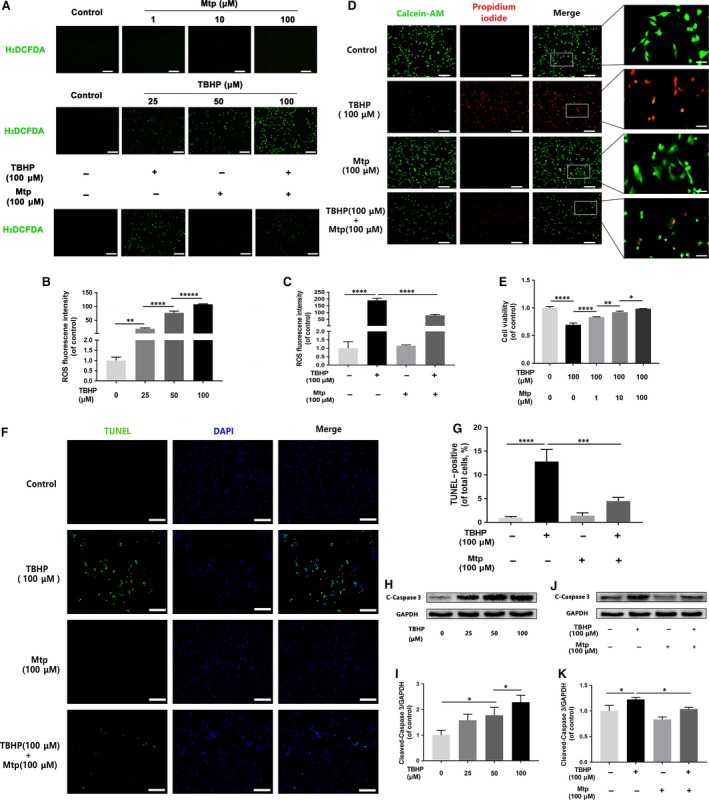
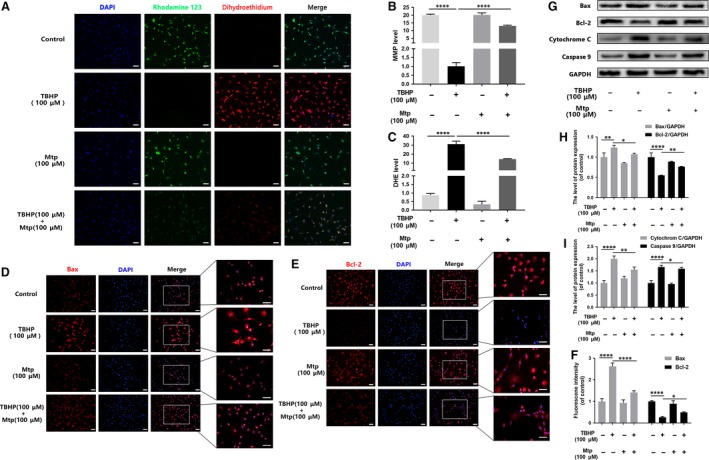
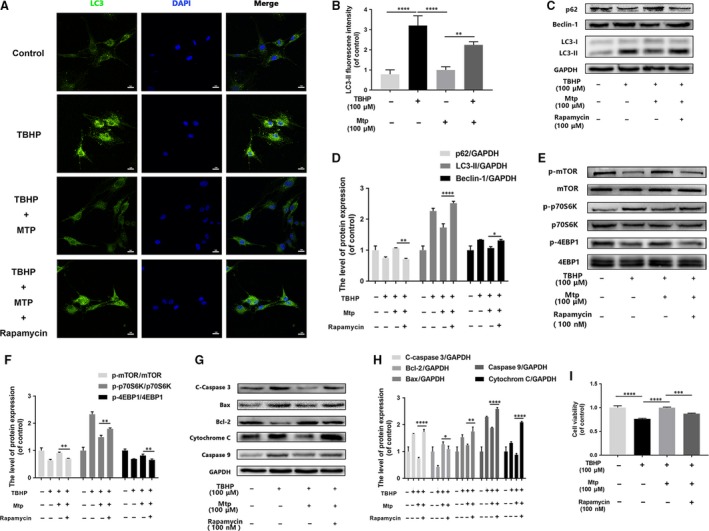
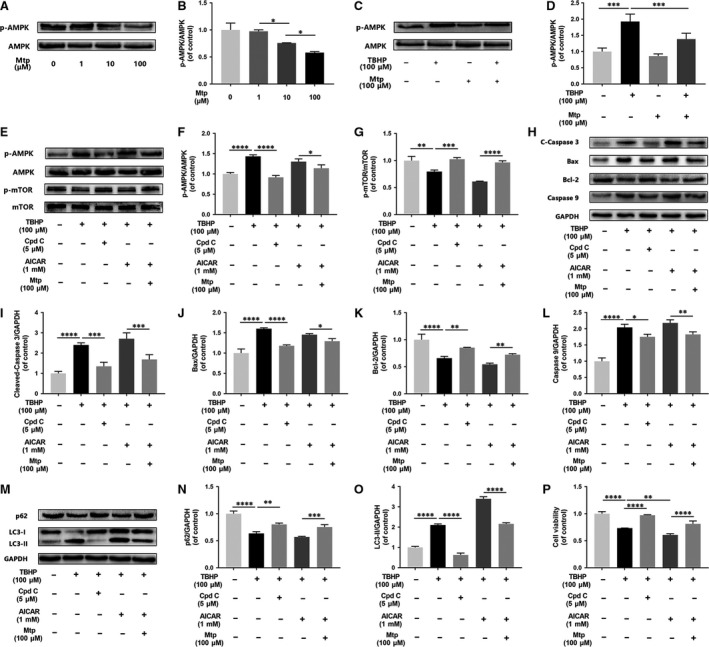
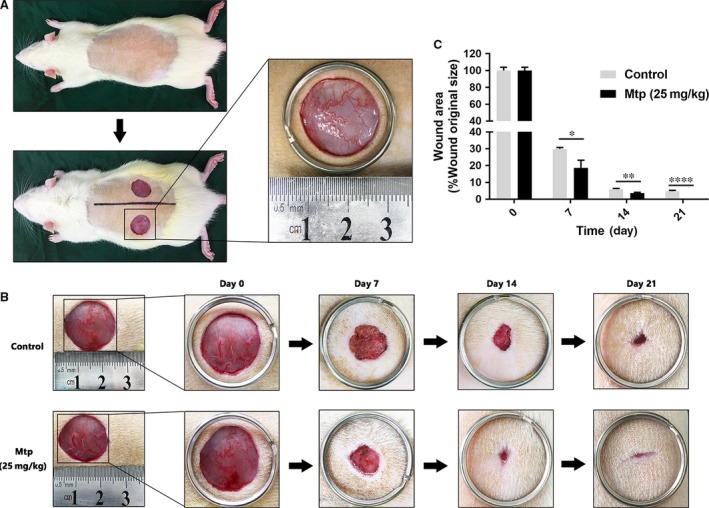
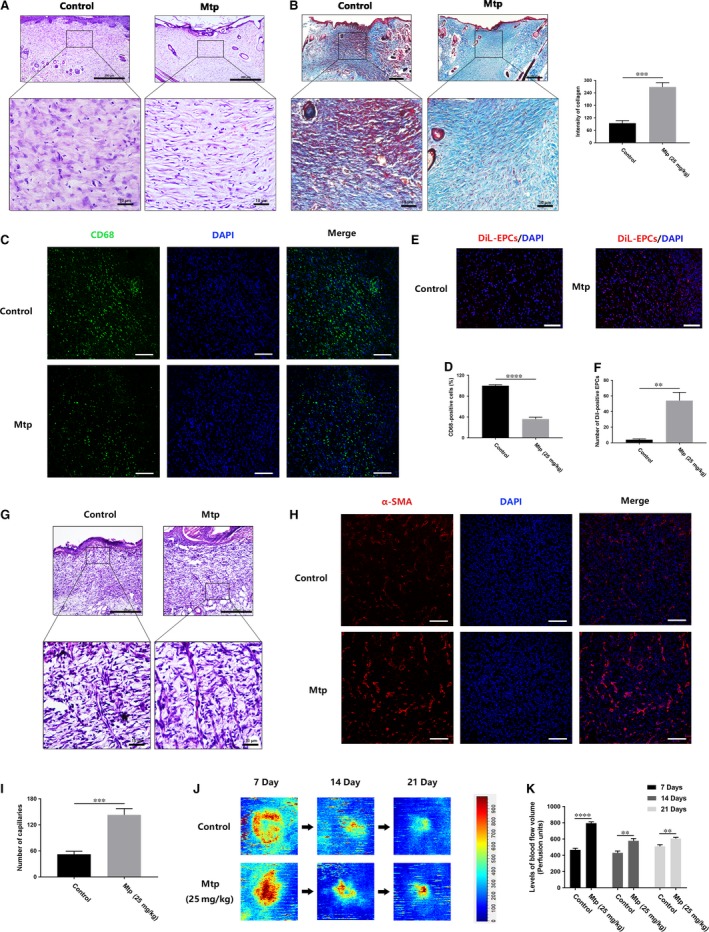
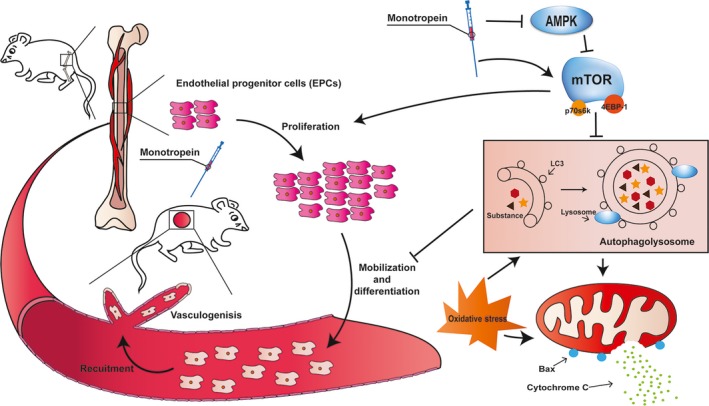
Attenuating oxidative stress-induced damage and promoting endothelial progenitor cell (EPC) differentiation are critical for ischaemic injuries. We suggested monotropein (Mtp), a bioactive constituent used in traditional Chinese medicine, can inhibit oxidative stress-induced mitochondrial dysfunction and stimulate bone marrow-derived EPC (BM-EPC) differentiation. Results showed Mtp significantly elevated migration and tube formation of BM-EPCs and prevented tert-butyl hydroperoxide (TBHP)-induced programmed cell death through apoptosis and autophagy by reducing intracellular reactive oxygen species release and restoring mitochondrial membrane potential, which may be mediated viamTOR/p70S6K/4EBP1 and AMPK phosphorylation. Moreover, Mtp accelerated wound healing in rats, as indicated by reduced healing times, decreased macrophage infiltration and increased blood vessel formation. In summary, Mtp promoted mobilization and differentiation of BM-EPCs and protected against apoptosis and autophagy by suppressing the AMPK/mTOR pathway, improving wound healing in vivo. This study revealed that Mtp is a potential therapeutic for endothelial injury-related wounds.

Keywords: angiogenesis; autophagy; endothelial progenitor cells; wound healing.


Figures

Figure 1
Figure 1
Effect of Mtp on cellular proliferation, migration, recruitment and tube formation of BMEPCs. (A) Cell proliferation results of BMEPCs treated with different concentrations of Mtp for 48 hrs. Cells proliferated evidently faster after Mtp treatment; (B, C) cell migration regulated by Mtp treatments. Scratch assay showed that EPCs migrated evidently faster in the Mtp‐treated group (scale bar: 200 μm); Data are presented as mean ± SD, & P < 0.05 versus the control group, # P < 0.05 versus the 1 μM Mtp treated group, % P < 0.05 versus the 10 μM Mtp treated group; (D, F) transwell chemotaxis assay results of BMEPCs with different treatments. BMEPCs were treated with PBS (control), 50 ng/ml bFGF and 1, 10 and 100 μM Mtp in the lower chamber for 3‐hrs incubation. Numbers of migrated cells were quantified by counting cells in 10 random fields using an inverted microscope (scale bar: 50 μm). The migration of BMEPCs was enhanced after Mtp treatment; (E, G) in vitro tube formation results of BMEPCs treated by Mtp. Cells were grown on Matrigel™ for 6 hrs under normal growth conditions, five independent fields were assessed for each well and the number of tubes were determined (scale bar: 100 μm). The tube formation ability of BMEPCs was improved after Mtp treatment. n = 3 independent experiments. *P < 0.05, **P < 0.01, ***P < 0.005, and ****P < 0.001 versus the indicated group.
Figure 2
Figure 2
Mtp increases cell–matrix adhesion and decreases cell–cell adhesion. (AD) Cell–matrix adhesion assay results of BMEPCs treated with Mtp. Cell–cell adhesion assay using Hoechst 33258 dye and calcein‐AM staining exhibited that Mtp treated for 48 hrs markedly increased cell–matrix adhesion and decreased cell–cell adhesion (scale bar: 500 μm). n = 3 independent experiments. *P < 0.05, **P < 0.01, ***P < 0.005, and ****P < 0.001 versus the indicated group.
Figure 3
Figure 3
mTOR pathway regulates chemotaxis and capillary tube formation capacity of BMEPCs. (A) Gene expression of VEGF, KDR, PECAM‐1 and VE‐cadherin in Mtp‐treated BMEPCs. Cells were cultivated with 1, 10 and 100 μM Mtp or bFGF (50 ng/ml) for 48 hrs and treated with 100 μM Mtp for 24, 48, 72 and 96 hrs. Gene levels were assessed via qRTPCR and normalized to β‐actin; related gene was up‐regulated by Mtp at 48 hrs or less; (BE) Western blot analysis of p‐mTOR, p‐p70S6K, p‐4EBP1, SQSTM1/P62 and Beclin‐1 in different doses of Mtp‐treated BMEPCs for 48 hrs. Mtp evidently increased mTOR pathway proteins and decreased autophagy level; (F, G) cell chemotaxis regulated by the treatments of rapamycin and/or Mtp. BMEPCs were treated with 100 nM rapamycin for 2 hrs prior to treatment with Mtp for 48 hrs. The numbers of migrated cells were quantified by performing cell counts of 10 random fields (scale bar: 50 μm); (H, I) in vitro tube formation results of BMEPCs treated by rapamycin and/or Mtp (scale bar: 100 μm); the densitometric analysis of all Western blot bands was normalized to the total proteins or GAPDH. n = 3 independent experiments. *P < 0.05, **P < 0.01, ***P < 0.005, and ****P < 0.001 versus the indicated group.
Figure 4
Figure 4
Mtp declines TBHP‐induced apoptosis and ROS production in BMEPCs. (AC) ROS production detected by H2 DCFDA fluorescence in BMEPCs. Cells were treated with 1, 10 and 100 μM Mtp for 48 hrs, labelled with H2 DCFDA (30 μM) and then incubated with 25, 50 and 100 μM TBHP for 3 hrs prior to fluorescence microscopic analysis (scale bar: 200 μm). Mtp significantly attenuated TBHP‐induced ROS production; (D) live/dead staining results of cells treated by Mtp and/or TBHP. Cells were treated with 1, 10 and 100 μM Mtp for 48 hrs and TBHP for 3 hrs, followed by calcein‐AM/PI double staining. Cell survival was significantly up‐regulated by the preconditioning of Mtp even with TBHP treatment (scale bar: 200; 20 μm); (E) cell viability results of BMEPCs treated with Mtp and TBHP. Cell Counting Kit‐8 (CCK‐8) assay of BMEPCs pre‐treated with 1, 10 and 100 μM Mtp for 48 hrs followed by TBHP stimulation was performed, and cell viability was evidently increased by the Mtp pre‐treatment; (F, G) TUNEL assay was performed in BMEPCs as pre‐treated with 100 μM Mtp followed by TBHP stimulation, and Mtp ameliorates apoptosis of BMEPCs induced by TBHP (scale bar: 200 μm); (H, I) Western blot analysis results of levels of cleaved‐caspase 3 in BMEPCs with different doses of TBHP treatment. BMEPCs were treated with 25, 50 and 100 μM TBHP. The protein expression of cleaved‐caspase 3 was significantly increased after TBHP treatment; (J, K) Western blot analysis results of expression of cleaved‐caspase 3 after Mtp pre‐treatment. Cells pre‐treated with 100 μM Mtp followed by TBHP stimulation. Mtp reduced cleaved‐caspase 3 protein expression of BMEPCs induced by TBHP. The densitometric analysis of all Western blot bands was normalized to the total proteins or GAPDH. n = 3 independent experiments. *P < 0.05, **P < 0.01, ***P < 0.005, and ****P < 0.001 versus the indicated group.
Figure 5
Figure 5
Mtp alleviates oxidative stress‐mediated mitochondrial dysfunction in BMEPCs. (AC) Fluorescence staining results of mitochondrial membrane potential by rhodamine 123 and ROS production by ROS probe DHE. BMEPCs were treated with 100 μM Mtp for 48 hrs and TBHP for 3 hrs and then labelled with fluorescent dyes rhodamine 123, DHE and Hoechst 33258. Representative images were taken from stained BMEPCs of indicated groups (scale bar: 30 μm). MMP significantly increased and ROS products decreased in Mtp and/or TBHP‐treated BMEPCs; (DF) immunofluorescence staining results of Bax and Bcl‐2 in Mtp and/or TBHP‐treated BMEPCs (scale bar: 50, 50 μm); (GI) Western blot analysis of protein expression of Bax, Bcl‐2, cytochrome c, caspase 9 in BMEPCs treated with 100 μM Mtp for 48 hrs and TBHP for 3 hrs. Pre‐treatment with Mtp evidently decreased the release of pro‐apoptotic proteins. The densitometric analysis of all Western blot bands was normalized to the total proteins or GAPDH. n = 3 independent experiments. *P < 0.05, **P < 0.01, ***P < 0.005, and ****P < 0.001 versus the indicated group.
Figure 6
Figure 6
Mtp provides cellular protection against apoptosis in BMEPCs via mTOR signalling pathways. (A, B) Immunofluorescence staining images and intensity of LC3‐positive autophagic vesicles (scale bar: 50 μm). LC3 autophagic vesicles were significantly decreased by Mtp pre‐treatment; (CH) protein levels of p‐mTOR, p‐p70S6K, p‐4EBP1, SQSTM1/P62, Beclin‐1 and LC3‐II, cleaved‐caspase 3, Bax, Bcl‐2, cytochrome c, caspase 9 in BMEPCs treated with 100 nM rapamycin for 2 hrs, 100 μM Mtp for 48 hrs and TBHP for 3 hrs; (I) cell viability results by CCK‐8 test of BMEPCs treated with 100 nM rapamycin for 2 hrs, 100 μM Mtp for 48 hrs and TBHP for 3 hrs. Cell viability was evidently increased by the Mtp pre‐treatment. The densitometric analysis of all Western blot bands was normalized to the total proteins or GAPDH. n = 3 independent experiments. *P < 0.05, **P < 0.01, ***P < 0.005, and ****P < 0.001 versus the indicated group.
Figure 7
Figure 7
Suppression of AMPK by Mtp attenuates oxidative stress‐mediated cell apoptosis and autophagy. (A, B) Western blot analysis of expression of p‐AMPK in different doses of Mtp treatment. BMEPCs were treated with 1, 10 and 100 μM Mtp. The protein expression of p‐AMPK was decreased after Mtp treatment; (C, D) Western blot analysis of expression of p‐AMPK after Mtp pre‐treatment. Cells were pre‐treated with 100 μM Mtp followed by TBHP stimulation. Mtp reduced p‐AMPK protein expression of BMEPCs induced by TBHP; (EO) Western blot analysis of expression of p‐AMPK, p‐mTOR, cleaved‐caspase 3, Bax, Bcl‐2, caspase 9, SQSTM1/P62 and LC3‐II. Cells were pre‐treated with 5 μM compound C or 1 mM AICAR for 2 hrs followed by 100 μM Mtp for 48 hrs and incubated with TBHP for 3 hrs. (P) Cell Counting Kit‐8 (CCK‐8) results of BMEPCs were treated under the same conditions as above. Cell viability was significantly increased by Cpd C treatment. The densitometric analysis of all Western blot band intensities was normalized to the total proteins or GAPDH. n = 3 independent experiments. *P < 0.05, **P < 0.01, ***P < 0.005, and ****P < 0.001 versus the indicated group.
Figure 8
Figure 8
Mtp accelerates wound healing in rats. (A) The wound healing model used in this study; (B) representative images of healing process in Mtp‐treated rats at different days; (C) wound healing rates at different times. Healing rates of full‐thickness cutaneous wounds were significantly increased by the Mtp treatment. n = 3 independent experiments. *P < 0.05, **P < 0.01, ***P < 0.005, and ****P < 0.001 versus the indicated group.
Figure 9
Figure 9
Mtp decreases macrophage infiltration and increases capillary formation. (A) H&E staining images of wound tissue treated with Mtp at day 21 (scale bar: 200, 10 μm); (B) Masson trichrome staining images of wound tissue treated with Mtp at day 21 and quantification of collagen intensity (scale bar: 200, 10 μm); (C, D) immunofluorescence staining images and quantification of CD68‐positive macrophages (scale bar: 100 μm); (E, F) in vivo tracing of DiL‐labelled EPCs. Red fluorescence identifies DiL‐labelled EPC and blue fluorescence indicates cell nucleus (scale bar: 100 μm); (G) H&E staining images with newly formed blood vessels at day 7 (scale bar: 200, 10 μm); (H, I) immunofluorescence staining images of α‐SMA (scale bar: 100 μm) and the number of newly formed blood vessels; (J) Laser doppler scan photographs of the wounds at days 0, 7, 14 and 21 after injury; (K) quantification of the blood flow volume using MoorLDI Review V6.1 software, scale bar: 200 μm. n = 3 independent experiments. *P < 0.05, **P < 0.01, ***P < 0.005, and ****P < 0.001 versus the indicated group.
Figure 10
Figure 10
Schematic of Mtp enhances wound healing. Mtp promotes proliferation, mobilization, differentiation and recruitment in BMEPCs, together leading to promote angiogenesis. Mtp also mitigates oxidative stress‐induced apoptosis via AMPK/mTOR pathway through suppression autophagy and mitochondrial apoptosis of EPCs, together leading to faster vascularization and wound healing in rats.

References

    1. Eberhardt RT, Raffetto JD. Chronic venous insufficiency. Circulation. 2014; 130: 333–46. - PubMed
    1. Valencia IC, Falabella A, Kirsner RS, et al Chronic venous insufficiency and venous leg ulceration. J Am Acad Dermatol. 2001; 44: 401–24. - PubMed
    1. Gurtner GC, Werner S, Barrandon Y, et al Wound repair and regeneration. Nature. 2008; 453: 314–21. - PubMed
    1. Asahara T, Kawamoto A. Endothelial progenitor cells for postnatal vasculogenesis. Am J Physiol Cell Physiol. 2004; 287: C572–9. - PubMed
    1. Bluff JE, Ferguson MW, O'Kane S, et al Bone marrow–derived endothelial progenitor cells do not contribute significantly to new vessels during incisional wound healing. Exp Hematol. 2007; 35: 500–6. - PubMed

Publication types

MeSH terms