

Comparison Study on the Estimation of the Spatial Distribution of Regional Soil Metal(loid)s Pollution Based on Kriging Interpolation and BP Neural Network
- PMID: 29278363
- PMCID: PMC5800134
- DOI: 10.3390/ijerph15010034
Comparison Study on the Estimation of the Spatial Distribution of Regional Soil Metal(loid)s Pollution Based on Kriging Interpolation and BP Neural Network
Abstract
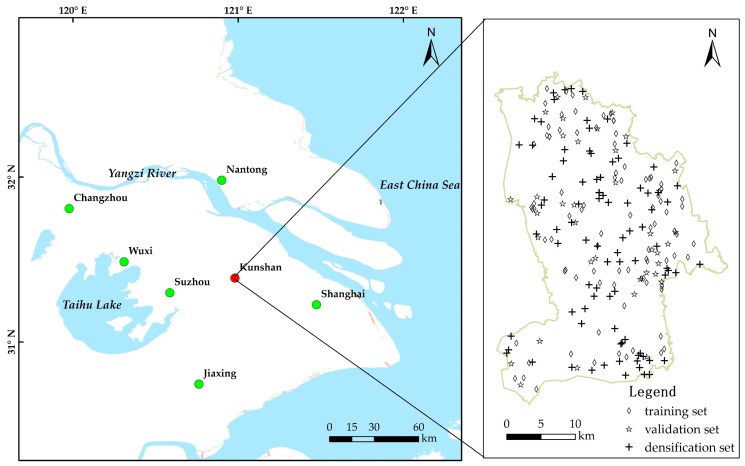
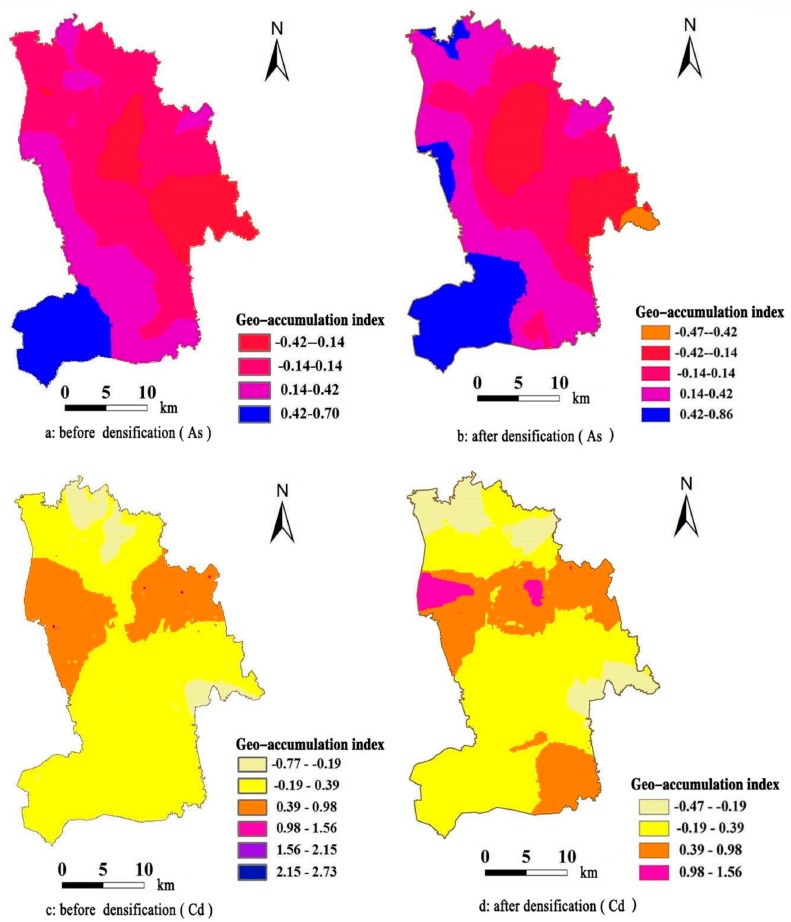
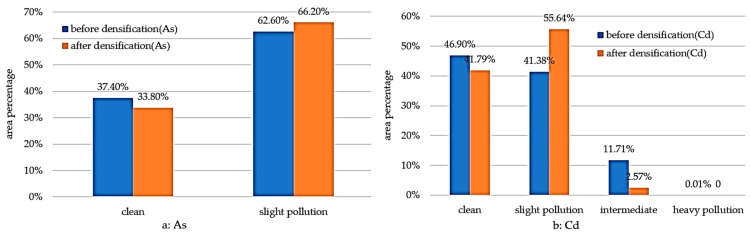
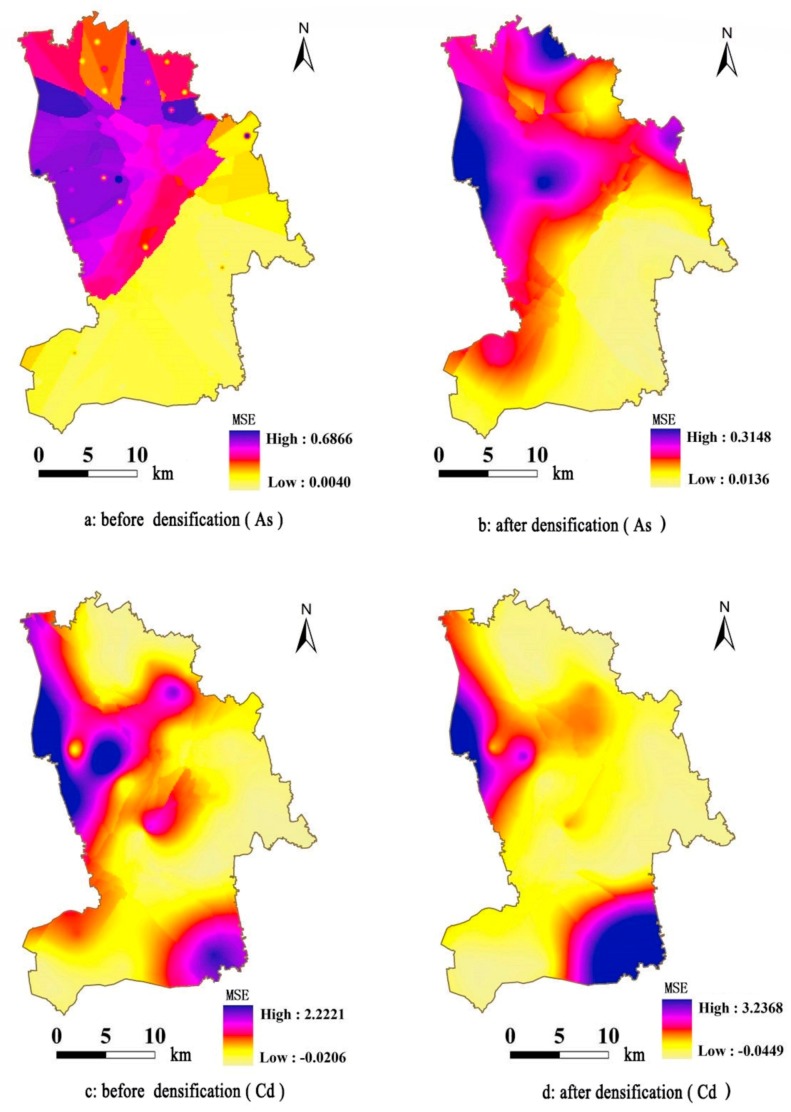
Soil pollution by metal(loid)s resulting from rapid economic development is a major concern. Accurately estimating the spatial distribution of soil metal(loid) pollution has great significance in preventing and controlling soil pollution. In this study, 126 topsoil samples were collected in Kunshan City and the geo-accumulation index was selected as a pollution index. We used Kriging interpolation and BP neural network methods to estimate the spatial distribution of arsenic (As) and cadmium (Cd) pollution in the study area. Additionally, we introduced a cross-validation method to measure the errors of the estimation results by the two interpolation methods and discussed the accuracy of the information contained in the estimation results. The conclusions are as follows: data distribution characteristics, spatial variability, and mean square errors (MSE) of the different methods showed large differences. Estimation results from BP neural network models have a higher accuracy, the MSE of As and Cd are 0.0661 and 0.1743, respectively. However, the interpolation results show significant skewed distribution, and spatial autocorrelation is strong. Using Kriging interpolation, the MSE of As and Cd are 0.0804 and 0.2983, respectively. The estimation results have poorer accuracy. Combining the two methods can improve the accuracy of the Kriging interpolation and more comprehensively represent the spatial distribution characteristics of metal(loid)s in regional soil. The study may provide a scientific basis and technical support for the regulation of soil metal(loid) pollution.
Keywords: BP neural network; cross validation; soil metal(loid)s; spatial interpolation.
Conflict of interest statement
The authors declare no conflict of interest.
Figures
References
-
- Kaldor J., Harris J.A., Glazer E., Glaser S., Neutra R., Mayberry R., Nelson V., Robinson L., Reed D. Statistical association between cancer incidence and major-cause mortality, and estimated residential exposure to air emissions from petroleum and chemical plants. Environ. Health Perspect. 1984;54:319–332. doi: 10.1289/ehp.8454319. - DOI - PMC - PubMed
-
- Kelly J., Thornton I., Simpson P.R. Urban Geochemistry: A study of the influence of anthropogenic activity on the heavy metal content of soils in traditionally industrial and non-industrial areas of Britain. Appl. Geochem. 1996;11:363–370. doi: 10.1016/0883-2927(95)00084-4. - DOI
-
- Laidlaw M.A.S., Filippelli G.M., Brown S., Paz-Ferreiro J., Reichman S.M., Netherway P., Truskewycz A., Ball A.S., Mielke H.W. Case studies and evidence-based approaches to addressing urban soil lead contamination. Appl. Geochem. 2017;83:14–30. doi: 10.1016/j.apgeochem.2017.02.015. - DOI
Publication types
MeSH terms
Substances
LinkOut - more resources
Full Text Sources
Other Literature Sources
Medical
Research Materials
