. 2018 Sep;68(3):949-963.
doi: 10.1002/hep.29764. Epub 2018 Jun 12.

Genomic perturbations reveal distinct regulatory networks in intrahepatic cholangiocarcinoma

Affiliations

Genomic perturbations reveal distinct regulatory networks in intrahepatic cholangiocarcinoma

Chirag Nepal et al. Hepatology. 2018 Sep.

Abstract

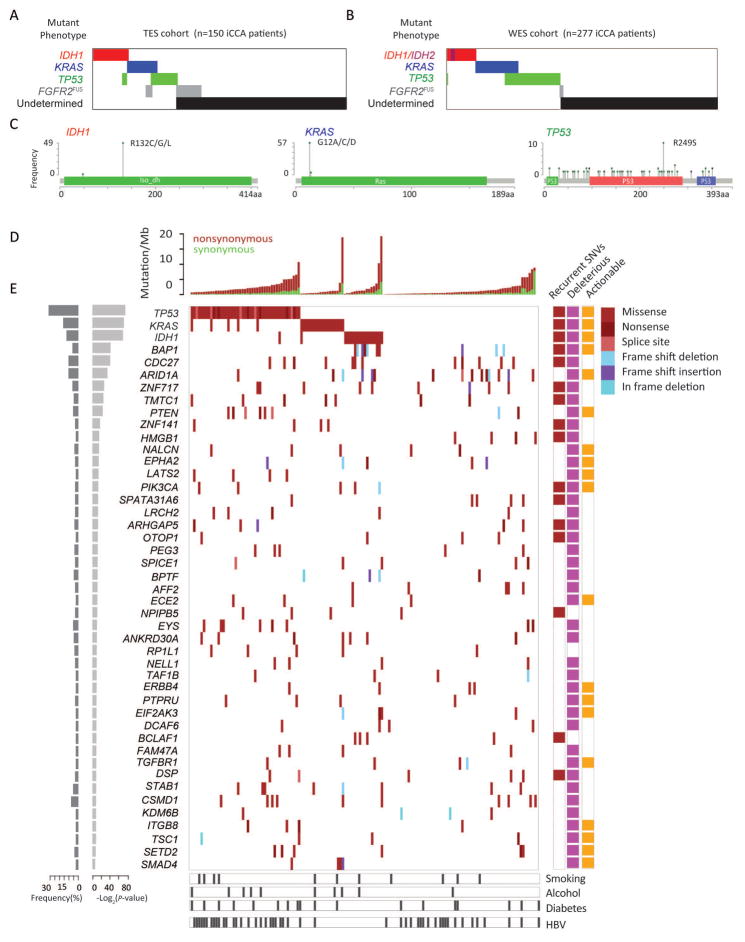
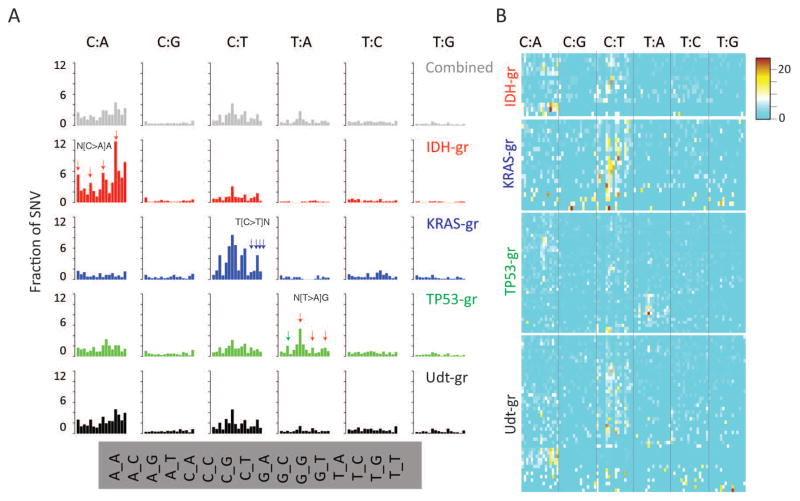
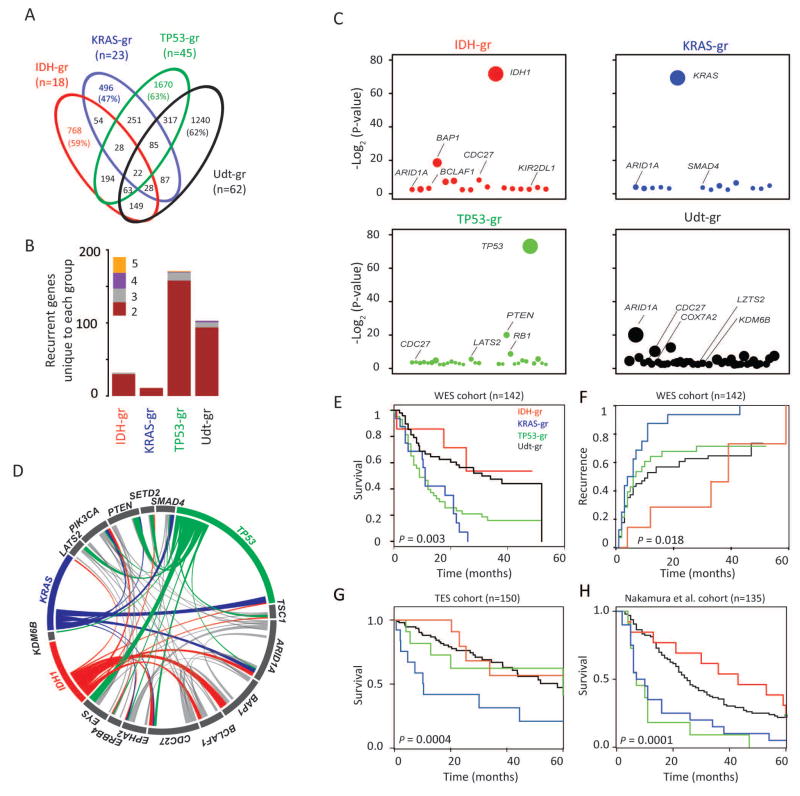
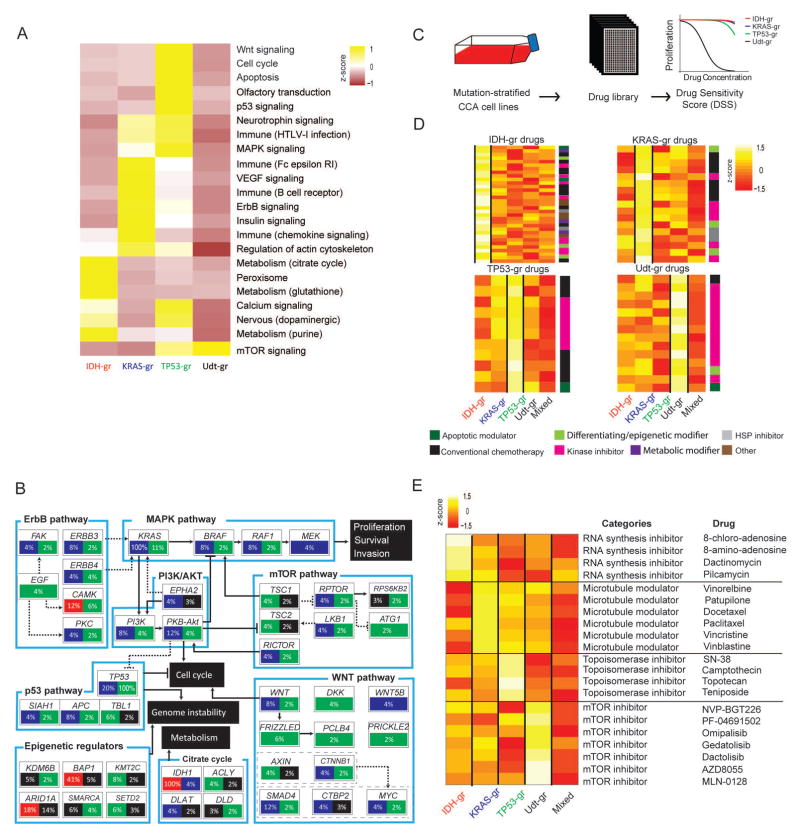
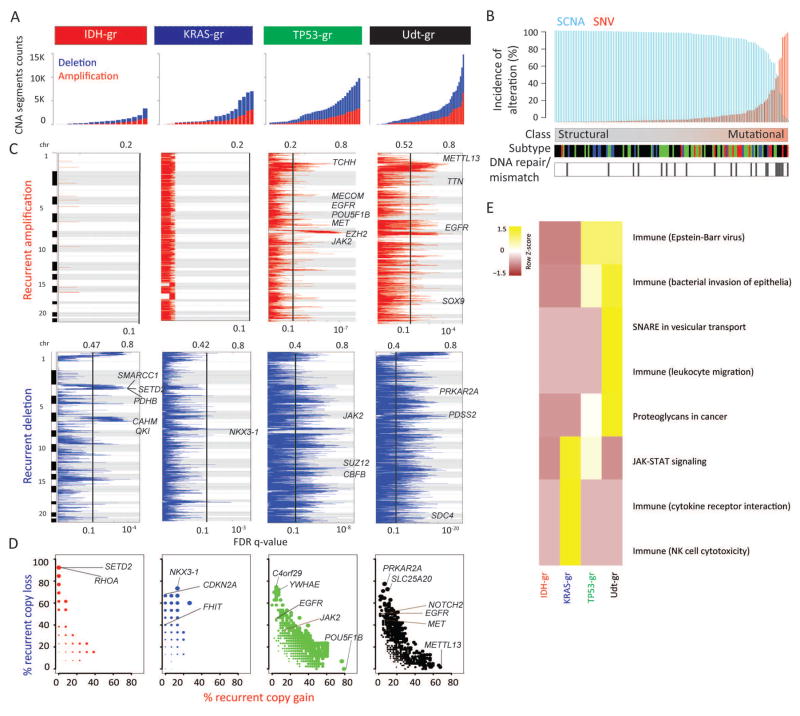
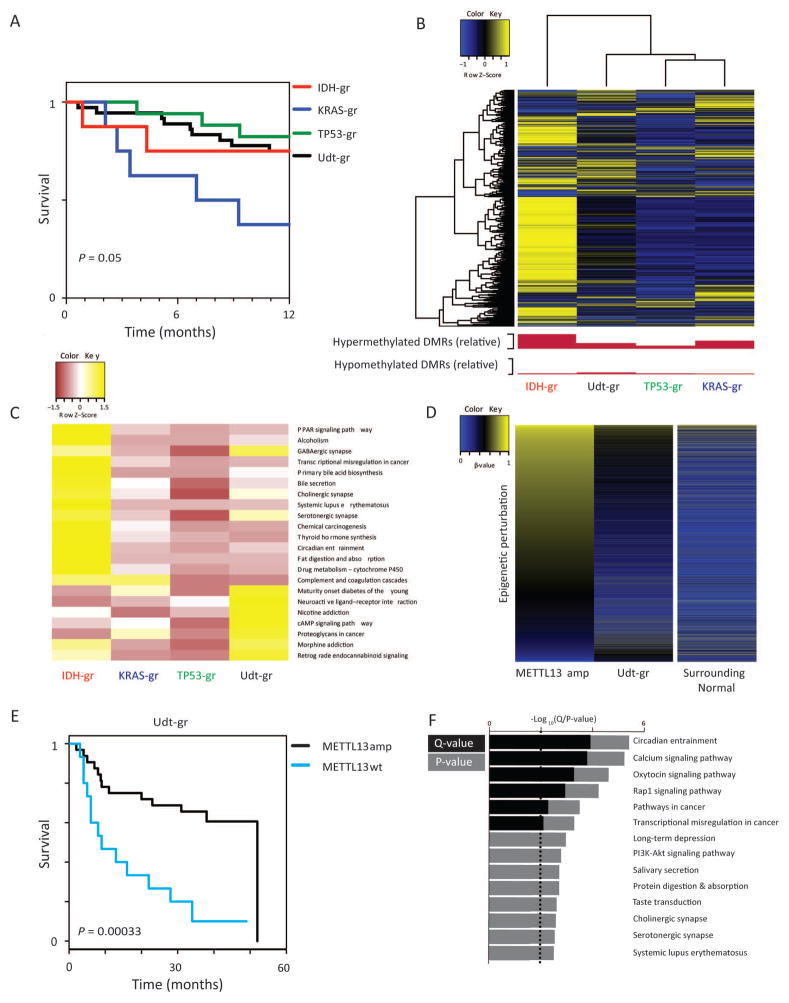
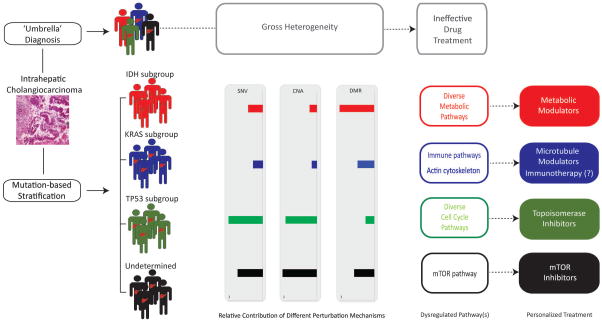
Intrahepatic cholangiocarcinoma remains a highly heterogeneous malignancy that has eluded effective patient stratification to date. The extent to which such heterogeneity can be influenced by individual driver mutations remains to be evaluated. Here, we analyzed genomic (whole-exome sequencing, targeted exome sequencing) and epigenomic data from 496 patients and used the three most recurrently mutated genes to stratify patients (IDH, KRAS, TP53, "undetermined"). Using this molecular dissection approach, each subgroup was determined to possess unique mutational signature preferences, comutation profiles, and enriched pathways. High-throughput drug repositioning in seven patient-matched cell lines, chosen to reflect the genetic alterations specific for each patient group, confirmed in silico predictions of subgroup-specific vulnerabilities linked to enriched pathways. Intriguingly, patients lacking all three mutations ("undetermined") harbored the most extensive structural alterations, while isocitrate dehydrogenase mutant tumors displayed the most extensive DNA methylome dysregulation, consistent with previous findings.

Conclusion: Stratification of intrahepatic cholangiocarcinoma patients based on occurrence of mutations in three classifier genes (IDH, KRAS, TP53) revealed unique oncogenic programs (mutational, structural, epimutational) that influence pharmacologic response in drug repositioning protocols; this genome dissection approach highlights the potential of individual mutations to induce extensive molecular heterogeneity and could facilitate advancement of therapeutic response in this dismal disease. (Hepatology 2018).


Figures

Fig. 1
Fig. 1
Genomic alteration landscape of iCCA patients. (A) Distribution of the three most prevalently mutated genes, alongside FGFR2 fusion events, in targeted sequencing (TS)- cohort (n=150). (B) Distribution of the three most prevalently mutated genes and FGFR2 fusion events in whole exome sequencing (WES)-cohort (n=277). C) Lollipop plot of mutations reveal mutational hotspots in IDH1 (R132C/G/L) and KRAS (G12A/C/D), while mutations in TP53 are spread across multiple positions. (D) Total number of somatic nonsynonymous (SNVs and short indels) and synonymous mutations in WES-cohort (n=142, paired tumor/normal). (E) Mutational catalogue of 45 genes along with their significance score (reported by MuSiC), mutation frequency and select risk factors in WES-cohort (n=142, paired tumor/normal). The genes are sorted based on significance score.
Fig. 2
Fig. 2
Mutational spectra in iCCA across four groups. (A) Distribution of the 96 substitution patterns, defined by the adjacent 5′- and 3′-sequence of the mutated nucleotide, reveal distinct mutational signatures are preferred across groups. (B) Heatmap represents the frequency of 96 substitution patterns for each patient across four mutational subgroups. The numbers of mutations are scaled to 100 and color represents the percentage.
Fig. 3
Fig. 3
Comparison of genes encoding nonsynonymous mutations across four groups. (A) A large fraction of genes mutated across four subgroups are unique to each subgroup. (B) Distribution of recurrently mutated genes that are unique to each group. (C) Significantly mutated genes reported by genome MuSiC. Each bubble represents a gene. The size of each bubble is proportional to the gene’s mutational frequency. Genes are sorted alphabetically along x-axis and y-axis indicates −log2(P-value). (D) Circos plot representing the interaction between three classifier genes and other significant genes (representing potential co-driver and passenger genes). The width of the ribbon represents the interaction count, where the smallest width represents a single interaction. (E–H) Kaplan-Meier analysis reveals differences in recurrence rates and overall survival between mutational subgroups across 3 different patient cohorts.
Fig. 4
Fig. 4
Enrichment of distinct signaling pathways and pharmacogenomic consequences across four mutational subgroups. (A) KEGG analysis indicates preferential association of distinct pathways with mutational subgroups. Z-score are computed from MuSiC P-values of the pathways by using scale function across groups in R, followed by hierarchical clustering. (B) Connectivity of mutated genes across eight pathways. The numbers in boxes represent the percentage of patients in specific mutational subgroups. Different colors represent the four groups. (C) Schematic of high-throughput drug repositioning experiments. (D) Differential sensitivity of mutational subgroups to diverse compounds. Heatmaps represent mean Drug Sensitivity Scores (DSS) per mutational subgroup, as quantified by viability effects of biologically active compounds (DSS > 10) across 7 CCA cell lines. (E) 21 drugs targeting specific pathways and processes established as enriched in specific mutational subgroups.
Fig. 5
Fig. 5
Contribution of somatic copy number alterations (SCNAs) across four mutational subgroups. (A) TP53-gr and Udt-gr have higher amplification and deletion frequencies compared to IDH-gr and KRAS-gr. (B) Frequencies of SNV and SCNA are inversely correlated. (C) Significant recurrent amplifications (red) and deletions (blue) reported by GISTIC2. X-axis on the bottom represents q-values of false discovery rate (FDR) and x-axis on top defines G-score (represents amplitude of aberration and frequency of occurrences across samples). Black horizontal line indicates FDR of 0.1. Y-axis represents the chromosomes. (D) The frequency of copy number gain and loss of genes across four subgroups. Each bubble represents a gene and the size of bubble indicates the total frequency of gain and loss. (E) Inter-group pathway-association of genes encoded in recurrent SCNA segments.
Fig. 6
Fig. 6
Genome-wide DNA methylation analysis of mutational subgroups. (A) Kaplan-Meier analysis of DNA methylation cohort. (B) Hierarchical clustering of top 1% most variable probes. Each mutational subgroup is represented by geometric mean of probe methylation within that group. Number of DMRs are scaled against most epigenetically dysregulated group. (C) KEGG pathway analysis of total DMRs by patient subgroup. Significance was set at Q-value < 0.05. (D) METTL13 amplification DNA methylation signature compared to Udt-gr and surrounding normal tissue. Probes are unique to amplification positive patients compared to surrounding normal with minimum methylation difference of 0.2 to Udt-gr. (E) Kaplan-Meier analysis of METTL13 amplification positive and negative patients in TCGA cohort. (F) KEGG pathway analysis of METTL13 amplification positive DMRs. Black bars indicate Q-value, grey bars indicate P-value. DMR: Differentially Methylated Regions.
Fig. 7
Fig. 7
Mutation-centric diversity of cholangiocarcinogenesis. Incidence of SNV, recurrent SCNA and differentially methylated regions across groups are shown as a relative ratio (scaled to 1). Integrating ‘omic’ and pathway analysis, confirmed by in vitro drug testing, suggests enhanced activity of specific compounds in specific mutational subgroups.

Comment in

References

    1. Banales JM, Cardinale V, Carpino G, Marzioni M, Andersen JB, Invernizzi P, Lind GE, et al. Expert consensus document: Cholangiocarcinoma: current knowledge and future perspectives consensus statement from the European Network for the Study of Cholangiocarcinoma (ENS-CCA) Nat Rev Gastroenterol Hepatol. 2016;13:261–280. - PubMed
    1. Yao KJ, Jabbour S, Parekh N, Lin Y, Moss RA. Increasing mortality in the United States from cholangiocarcinoma: an analysis of the National Center for Health Statistics Database. BMC Gastroenterol. 2016;16:117. - PMC - PubMed
    1. Sirica AE, Gores GJ. Desmoplastic stroma and cholangiocarcinoma: clinical implications and therapeutic targeting. Hepatology. 2014;59:2397–2402. - PMC - PubMed
    1. Razumilava N, Gores GJ. Cholangiocarcinoma. Lancet. 2014;383:2168–2179. - PMC - PubMed
    1. Claessen MM, Vleggaar FP, Tytgat KM, Siersema PD, van Buuren HR. High lifetime risk of cancer in primary sclerosing cholangitis. J Hepatol. 2009;50:158–164. - PubMed

Publication types

MeSH terms