. 2018 Feb 2;8(2):727-735.
doi: 10.1534/g3.117.300147.

Fine Mapping of QUICK ROOTING 1 and 2, Quantitative Trait Loci Increasing Root Length in Rice

Affiliations

Fine Mapping of QUICK ROOTING 1 and 2, Quantitative Trait Loci Increasing Root Length in Rice

Yuka Kitomi et al. G3 (Bethesda). .

Abstract

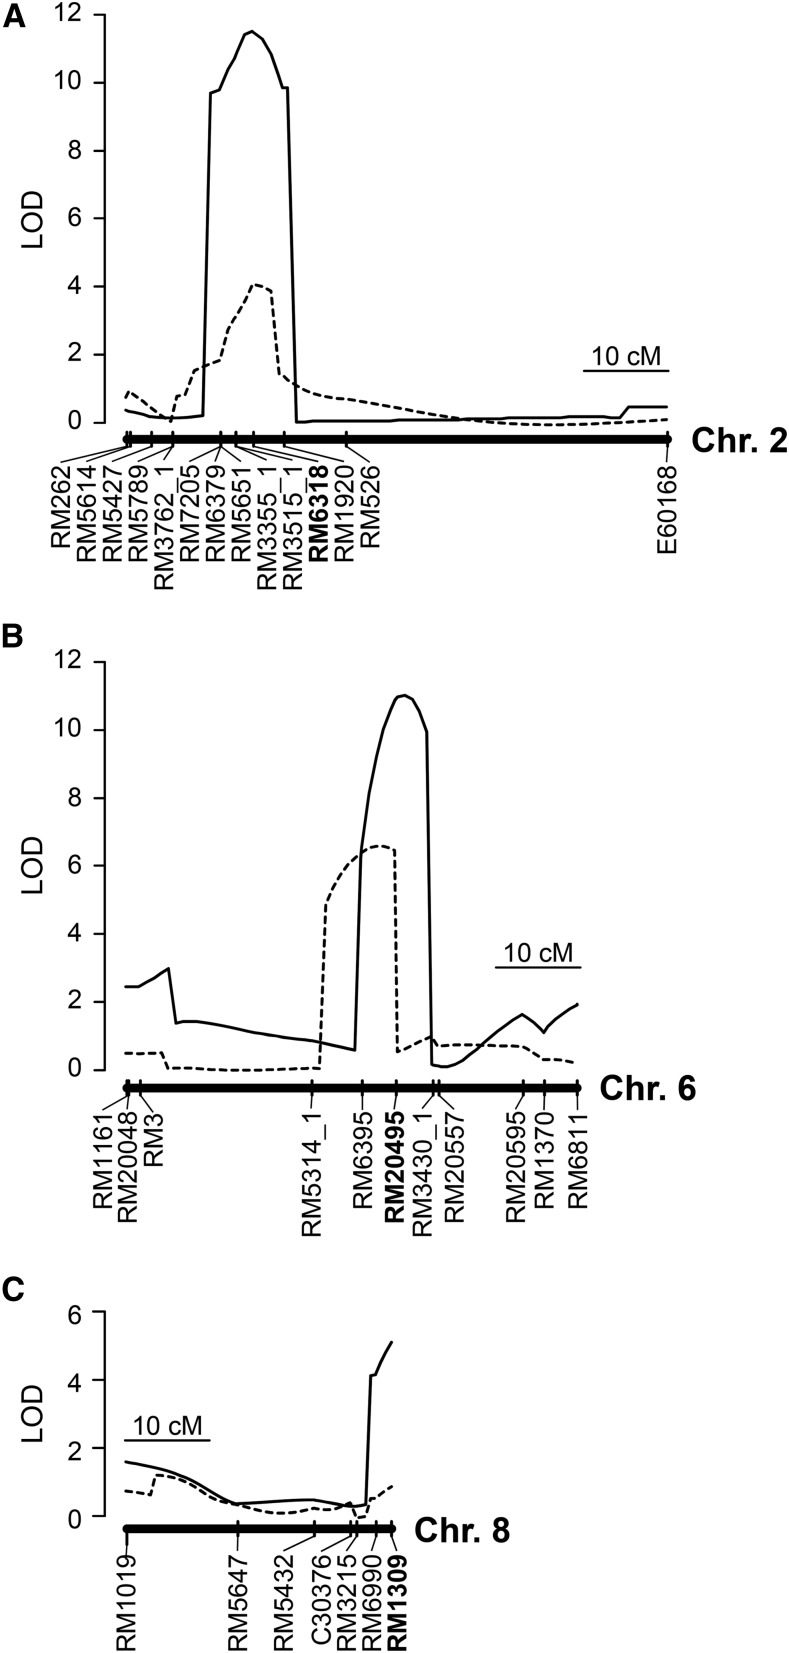
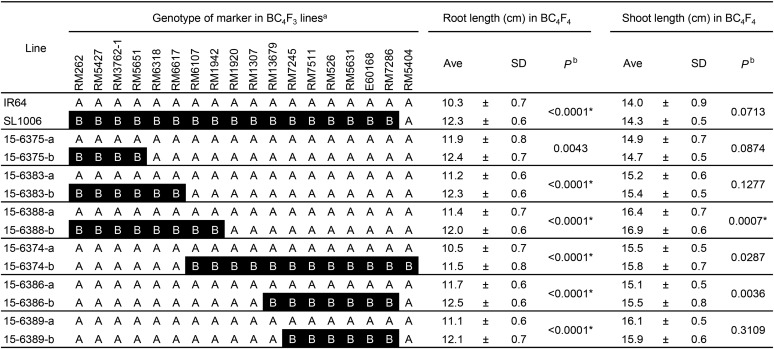
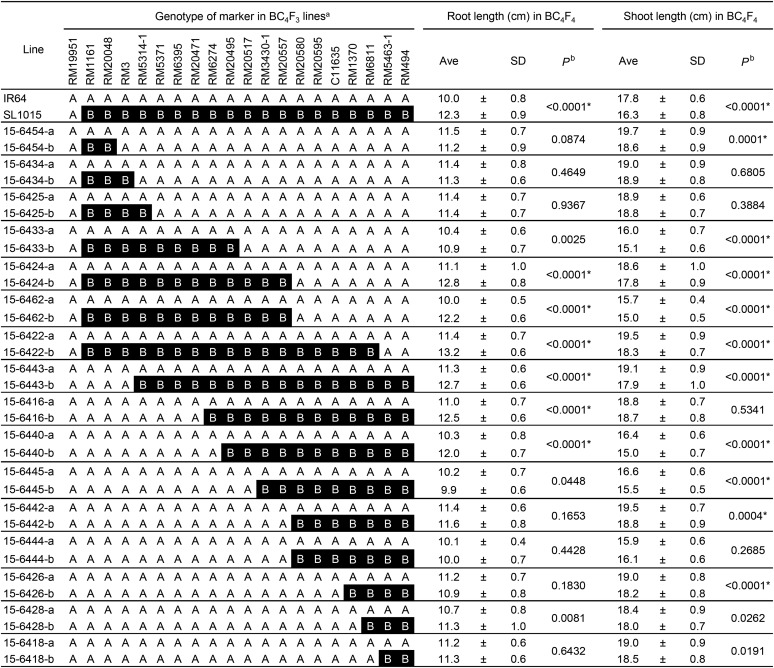
The volume that the root system can occupy is associated with the efficiency of water and nutrient uptake from soil. Genetic improvement of root length, which is a limiting factor for root distribution, is necessary for increasing crop production. In this report, we describe identification of two quantitative trait loci (QTLs) for maximal root length, QUICK ROOTING 1 (QRO1) on chromosome 2 and QRO2 on chromosome 6, in cultivated rice (Oryza sativa L.). We measured the maximal root length in 26 lines carrying chromosome segments from the long-rooted upland rice cultivar Kinandang Patong in the genetic background of the short-rooted lowland cultivar IR64. Five lines had longer roots than IR64. By rough mapping of the target regions in BC4F2 populations, we detected putative QTLs for maximal root length on chromosomes 2, 6, and 8. To fine-map these QTLs, we used BC4F3 recombinant homozygous lines. QRO1 was mapped between markers RM5651 and RM6107, which delimit a 1.7-Mb interval on chromosome 2, and QRO2 was mapped between markers RM20495 and RM3430-1, which delimit an 884-kb interval on chromosome 6. Both QTLs may be promising gene resources for improving root system architecture in rice.

Keywords: CSSLs; Oryza sativa; QTLs; root elongation; root system architecture.


Figures

Figure 1
Figure 1
Maximal root lengths of 26 IK-CSSLs, IR64, and Kinandang Patong (KP) grown in hydroponic conditions. Values are given as mean ± SD (n = 24). Black and gray bars indicate lines with longer and shorter roots, respectively, than those of IR64 (P < 0.001, Dunnett’s test). Dashed lines show the mean values of IR64. Substituted chromosome in each line is indicated at the bottom. (A) First trial (data at 9 d after germination). (B) Second trial (data at 8 d after germination).
Figure 2
Figure 2
LOD score curves of QTLs for root and shoot lengths in the three BC4F2 mapping populations. Peaks indicate the putative QTLs positions. Solid lines indicate maximal root length; dotted lines indicate shoot length. Vertical ticks indicate the genetic positions (cM) of DNA markers. DNA markers closest to LOD peaks are shown in bold. (A) Population #09-6642-34 segregating for the long arm of chromosome 2; (B) population #15-6456-7 segregating for the long arm of chromosome 6; (C) population #09-S19-1 segregating for chromosome 8.
Figure 3
Figure 3
Frequency distributions of root and shoot lengths in the three BC4F2 mapping populations, showing three genotype classes of the DNA markers closest to the detected QTLs. For each allele, an inverted triangle indicates the mean, and a horizontal bar indicates SD. The same shading is used for triangles and corresponding bars. The means labeled with different letters differ significantly (P < 0.05, Tukey’s multiple comparison test). (A) Population #09-6642-34 segregating for the long arm of chromosome 2; (B) population #15-6456-7 segregating for the long arm of chromosome 6; (C) population #09-S19-1 segregating for chromosome 8.
Figure 4
Figure 4
Genotypes of 18 DNA markers on chromosome 2 in BC4F3 lines and phenotypes of their progeny (BC4F4). aA (white background), IR64 homozygous; B (black background), Kinandang Patong homozygous. bProbability of no significant difference between lines in a pair (student’s t-test). *Significance at the 0.1% level.
Figure 5
Figure 5
Location of QRO1 on chromosome 2. (A) Graphical genotype of SL1006. White and gray boxes represent regions homozygous for the IR64 and Kinandang Patong alleles, respectively. S indicates short arm; L indicates long arm. (B) Physical map position of QRO1. Double-headed arrows indicate candidate regions of QRO1 and other putative QTLs for maximal root length. DNA markers are shown on the left side of each map; numbers in parentheses indicate physical map positions of the markers in the latest version of the RAP database. Underlines indicate no recombination with the predicted genotype of QRO1.
Figure 6
Figure 6
Genotypes of 20 DNA markers on chromosome 6 in BC4F3 lines and phenotypes of their progeny (BC4F4). aA (white background), IR64 homozygous; B (black background), Kinandang Patong homozygous. bProbability of no significant difference between lines in a pair (student’s t-test). *Significance at the 0.1% level.
Figure 7
Figure 7
Location of QRO2 on chromosome 6. (A) Graphical genotype of SL1015. White and gray boxes represent regions homozygous for the IR64 and Kinandang Patong alleles, respectively. S indicates short arm; L indicates long arm. (B) Physical map position of QRO2. A short double-headed arrow indicates the candidate region of QRO2. DNA markers are shown on the left side of each map; numbers in parentheses indicate physical map positions of the markers in the latest version of the RAP database. Underline indicates no recombination with the predicted genotype of QRO2.

References

    1. Abe J., Morita S., 1994. Growth direction of nodal roots in rice: its variation and contribution to root system formation. Plant Soil 165: 333–337.
    1. Arai-Sanoh Y., Takai T., Yoshinaga S., Nakano H., Kojima M., et al. , 2014. Deep rooting conferred by DEEPER ROOTING 1 enhances rice yield in paddy fields. Sci. Rep. 4: 5563. - PMC - PubMed
    1. Araki H., Morita S., Tatsumi J., Iijima M., 2002. Physio-morphological analysis on axile root growth in upland rice. Plant Prod. Sci. 5: 286–293.
    1. Broman K. W., Wu H., Sen S., 2003. R/qtl: QTL mapping in experimental crosses. Bioinformatics 19: 889–890. - PubMed
    1. Canadell J., Jackson R. B., Ehleringer J. B., Mooney H. A., Sala O. E., et al. , 1996. Maximum rooting depth of vegetation types at the global scale. Oecologia 108: 583–595. - PubMed

Publication types

LinkOut - more resources