. 2018 Mar 5;217(3):959-974.
doi: 10.1083/jcb.201704119. Epub 2017 Dec 26.

Structure-function insights into direct lipid transfer between membranes by Mmm1-Mdm12 of ERMES

Affiliations

Structure-function insights into direct lipid transfer between membranes by Mmm1-Mdm12 of ERMES

Shin Kawano et al. J Cell Biol. .

Abstract

The endoplasmic reticulum (ER)-mitochondrial encounter structure (ERMES) physically links the membranes of the ER and mitochondria in yeast. Although the ER and mitochondria cooperate to synthesize glycerophospholipids, whether ERMES directly facilitates the lipid exchange between the two organelles remains controversial. Here, we compared the x-ray structures of an ERMES subunit Mdm12 from Kluyveromyces lactis with that of Mdm12 from Saccharomyces cerevisiae and found that both Mdm12 proteins possess a hydrophobic pocket for phospholipid binding. However in vitro lipid transfer assays showed that Mdm12 alone or an Mmm1 (another ERMES subunit) fusion protein exhibited only a weak lipid transfer activity between liposomes. In contrast, Mdm12 in a complex with Mmm1 mediated efficient lipid transfer between liposomes. Mutations in Mmm1 or Mdm12 impaired the lipid transfer activities of the Mdm12-Mmm1 complex and furthermore caused defective phosphatidylserine transport from the ER to mitochondrial membranes via ERMES in vitro. Therefore, the Mmm1-Mdm12 complex functions as a minimal unit that mediates lipid transfer between membranes.


Figures

Figure 1.
Figure 1.
Oligomer formation and lipid binding of Mdm12. (A) A pRS314 vector containing the gene for ScMdm12 (ScMdm12WT); ScMdm12 with the mutation of I5P, I5A, I5N, or I5W; ScMdm12 lacking the N-terminal 11 residues (ΔN11); or KlMdm12(1–239) was introduced into the S. cerevisiae mdm12Δ strain by plasmid shuffling. An empty pR314 vector was introduced into the mdm12Δ strain as a control (vector). Saturated cultures of the indicated cells were diluted with 10-fold increments, spotted on SCD (−Trp, +FOA) or SCLac (−Trp, +FOA) plates, and incubated at 30°C or 37°C for 2 or 3 d, respectively. (B) Dimeric arrangement found in the crystal structures of KlMdm12. Structures of KlMdm12(1–239), residues 1–239 of KlMdm12 without modification (left), and KlMdm12dmLys, dimethyl-lysine–modified KlMdm12(1–239) (right) are shown in ribbon form. (C) Interlocking dimers found in ScMdm12 (left; Jeong et al., 2016) and KlMdm12dmLys crystallized in the presence of FOS-MEA-10 (right). The domain-swapped regions are shown by black squares. (D) The indicated proteins were purified from E. coli cells and subjected to gel-filtration analyses using a HiLoad26/600 Superdex 200 pg column. Absorption at 280 nm is plotted against elution volume, and positions of molecular mass (kilodalton) marker proteins are indicated. Apparent molecular masses of the Mdm12 derivatives estimated from the peak tops (indicated with arrowheads) of the elution profiles (gel filtration) and calculated molecular masses for the monomeric derivatives (calculated) are shown in the right table. H-TEV–ScMdm12, ScMdm12 with the N-terminally attached His10 tag followed by the TEV protease recognition sequence; H-thrombin-KlMdm12, KlMdm12 with the N-terminally attached His6 tag followed by the thrombin protease recognition sequence; H-thrombin–ScMdm12, ScMdm12 with the N-terminally attached His6 tag followed by the thrombin protease recognition sequence; KlMdm12TEV-H, KlMdm12 followed by the TEV protease recognition sequence and the C-terminally attached His6 tag; ScMdm12TEV-H, ScMdm12 followed by the TEV protease recognition sequence and the C-terminally attached His6 tag.
Figure 2.
Figure 2.
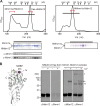
Hetero-oligomer formation of K. lactis Mdm12 and Mmm1. (A) KlMdm12 and Mmm1s form hetero-oligomeric complexes when expressed in E. coli cells. Mmm1s and N-terminally His6-tagged KlMdm12 (HMdm12) and N-terminally His6-tagged K. lactis Mmm1s (HMmm1s) and KlMdm12 were expressed in E. coli cells and affinity purified using a Ni-NTA column. Eluted fractions were then pooled and subjected to gel filtration by a Superdex 200 column (left: Mmm1s-HMdm12; right: HMmm1s-Mdm12). Fractions indicated with black bars in the elution profiles (top) were fractionated and analyzed by SDS-PAGE and Coomassie staining (bottom) or immunoblotting with the indicated antibodies. Fractions indicated with red bars are collected for further analyses for lipid transfer. Positions of molecular mass (kilodalton) marker proteins are indicated. The presence of the His6 tag at the N terminus of either Mmm1 or Mdm12 affects the gel-filtration elution profiles of the Mmm1s–Mdm12 hetero-oligomers. Apparent sizes of the HMmm1s–Mdm12 and Mmm1s–HMdm12 complexes are ∼200 kD and ∼500–600 kD, respectively. (B) Left: The position of I5 in KlMdm12 is shown. Two forms (free KlMdm12 and KlMdm12 complexed with Mmm1s) of I5C mutant KlMdm12 were purified and modified with NMBP to introduce a photoreactive benzophenone group into the sulfhydryl group of C5. Samples were then treated with or without UV irradiation. Proteins were analyzed by SDS-PAGE followed by immunoblotting with the indicated antibodies. The arrow points to cross-linked product; asterisks indicate nonspecific signals.
Figure 3.
Figure 3.
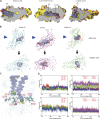
Bottom of the hydrophobic pocket in KlMdm12 is tightly closed. (A) Structural comparison of the KlMdm12–PE complex (left), the complex of E-SYT2 with PE and Triton X-100 (TX100; middle), and the ScMdm12–PE complex (right). Proteins are represented by the molecular surface (C, yellow; O, red; and N, blue) with cutaway views to show cavities and the bound substrates in space-filling form. (B) Solvent-accessible pockets (light blue surface) and main-chain foldings of KlMdm12 (left), human E-SYT2 (middle), and ScMdm12 (right). The solvent-accessible pockets were searched by query in the POCASSA server (http://altair.sci.hokudai.ac.jp/g6.service/pocassa/; Yu et al., 2010) and visualized. Pockets were defined as the region between the protein surface and the “probe surface,” which is generated by a probe sphere with diameter of 4 Å rolling along the protein surface. Blue cones indicate the directions of the views for the bottom panels. Openings of the pockets are indicated by transparent red areas. Note that the cavity in E-SYT2 has multiple separate openings that make up a continuing cavity through the molecule. The volumes of the cavities are 1,242 Å3, 2,086 Å3, and 2,152 Å3 for KlMdm12, E-SYT2 (monomer), and ScMdm12, respectively. N and C indicate the N and C termini, respectively. (C and D) MD simulation of the PE-bound KlMdm12 structure. MD simulation was used to test whether the bottom of the lipid-binding pocket is stably closed. The distances from the terminal methyl C atoms of the 1-palmitoyl group (C1) and of 2-oleoyl group (C2) to the hydrophobic side chains of the indicated residues (C) at the bottom of the lipid-binding pocket of KlMdm12 were traced down for 160 ns in the top and bottom panels, respectively (D).
Figure 4.
Figure 4.
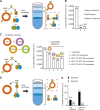
Mmm1–Mdm12 can extract lipids from membranes and insert them into membranes. (A) Fluorescent lipid extraction by a protein from liposomes. Liposomes consisting of PC and NBD-PE (PC/NBD-PE = 80/20) were incubated with free KlMdm12, MBP–HMmm1s, or HMmm1s–Mdm12 and then separated by sucrose step-gradient centrifugation. The orange and blue ovals indicate Mdm12 and Mmm1s, respectively. (B) Lipid-extraction activities as fluorescence intensity in the protein fraction in the assay in A (broken-line square) are plotted by bars and figures above the bar. Bars show means ± SE of three independent experiments. (C) Competition of HMmm1s–Mdm12–mediated fluorescent lipid extraction from liposome by nonfluorescent liposomes. 200 µM liposomes (PC/NBD-PE = 80/20) were incubated with HMmm1s–Mdm12 in the presence or absence of 200 µM PC liposomes (orange), PC/PE (50/50; purple), PC/PA (50/50; yellow orange), or PC/PS (50/50; yellow green) liposomes and separated by sucrose step-gradient centrifugation. The molar ratio of transferred NBD-PE to HMmm1s–Mdm12 was plotted by bars and figures above the bars. Bars show means ± SE of three independent experiments. Total NBD-PE fluorescence intensity was estimated by solubilizing NBD-PE–containing liposomes with Triton X-100. (D) Lipid transfer from a protein preloaded with a fluorescent lipid to liposomes. Free form of Mdm12 (free Mdm12) or HMmm1s–Mdm12 preloaded with NBD-PE was incubated with PC liposomes and then separated by Nycodenz step-gradient centrifugation. (E) Lipid-transfer activities (protein to liposomes) as fluorescence intensity in the floating liposome fraction normalized by the fluorescence intensity in total fractions are plotted by bars and figures above the bars. Bars show means ± SE of three independent experiments. We confirmed that the added proteins did not stably bind to liposomes in these assays.
Figure 5.
Figure 5.
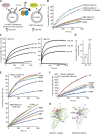
Mmm1–Mdm12 can transfer lipids between lipid membranes. (A) A schematic diagram of the fluorescent-based NBD-PE transfer between liposomes. 12.5 µM donor liposomes contain NBD-PE and Rhod-PE, and NBD fluorescence is quenched by FRET to Rhod. Once NBD-PE is transferred to acceptor liposomes (50 µM), NBD fluorescence increases, which is monitored in B. (B) NBD-PE transfer activities of the 50 nM HMmm1s–Mdm12 complex, the FOS-MEA-10–treated HMmm1s–Mdm12 complex, MBP-HMmm1s, and HMdm12 were measured at 25°C by the assay shown in A. At 0 s, the protein or buffer was added to the reaction mixture, and NBD fluorescence intensities were set to 0 at 0 s. (C) Transfer of NBD-PE and NBD-PS between liposomes by different concentrations of HMmm1s–Mdm12 was compared by the assays as in B. (D) The amounts of NBD-PE and NBD-PS transferred from 12.5 µM donor liposomes containing NBD-PE or NBD-PS with Rhod-PE to 50 µM acceptor liposomes after 10 s reaction. Total NBD-PE or NBD-PS fluorescence intensities were estimated by solubilizing NBD-PE or NBD-PS containing liposomes with Triton X-100. Bars show means ± SD of three independent experiments. (E) NBD-PE transfer activities of the 50 nM HMmm1s–Mdm12 complex and 1,000 nM MBP-HMmm1s containing K. lactis wild-type Mmm1s (WT) or the indicated K. lactis Mmm1s mutants (measured as in A and B). Total NBD-PE fluorescence intensity was estimated by solubilizing NBD-PE–containing liposomes with Triton X-100. (F) NBD-PE transfer activities of the 500 nM ScHMmm1s–ScMdm12 complex analyzed as in E. The curves for the mutations at the same positions between the Mmm1 model structure (E) and Mdm12 x-ray structure (F) are indicated with the same colors. (G) Positions of the mutated hydrophobic residues in the S. cerevisiae Mdm12 structure (Jeong et al., 2016) and in the homology model of K. lactis Mmm1s (KlMmm1s, main-chain folding in green) are shown by space-filling form in yellow. E255 in the S. cerevisiae structure is shown by space-filling form in cyan. The positions of POPE in the ScMdm12 structure and in the model structure of KlMmm1s are shown in space-filling form. Homology modeling of KlMmm1s based on the KlMdm12 structure was performed using Modeller software (Šali and Blundell, 1993). The predicted model structure of KlMmm1s resembles KlMdm12 and possesses a hydrophobic (likely phospholipid-binding) pocket. To assess the significance of the hydrophobic pockets of Mmm1 and Mdm12 in lipid transfer activity by mutational analyses, three residues were chosen according to their positions at the entrance, middle, and bottom part of the pocket: L10, V125, and V214 in ScMdm12 and V190, L274, and I369 (KlMmm1 numbering) in KlMmm1.
Figure 6.
Figure 6.
Mmm1 and Mdm12 mediate PS transport from the ER to mitochondria. (A) A schematic diagram of the PS transfer/conversion pathway involving the ER and mitochondria (MT). The indicated phospholipids were analyzed in this assay. PDME, phosphatidyldimethylethanolamine. (B) In vitro PS transport assays were performed using the HMFs isolated from mmm1Δ cells expressing Vps13-D716H with S. cerevisiae wild-type (WT) or mutant Mmm1 (V190S [190], L274S [274], L369S [369], or L274S/L369S [274/369]) or without Mmm1 derivatives (V). Total phospholipids were extracted and analyzed by TLC and radioimaging. Amounts of PS, PE, and PDME+PC relative to total phospholipids and PDME+PC relative to PE were quantified after 30 min of incubation. Bars show mean ± SE of three independent experiments. The amount of total phospholipids synthesized with wild-type cells after 40-min incubation was set to 100% (total). The amounts of PS/total reflect PS transport from the ER to mitochondria. (C) In vitro PS transport assays were performed using the HMFs isolated from mdm12Δ cells expressing Vps13-D716H with S. cerevisiae wild-type (WT) or mutant Mdm12 (L10S [10], V125S [125], V214S [214], or E255R [255]) or without Mdm12 derivatives (V) as in B. The amounts of PS/total reflect PS transport from the ER to mitochondria. The bars for the mutations at the same positions between the Mmm1 model structure (B) and Mdm12 x-ray structure (C) are indicated with the same colors.
Figure 7.
Figure 7.
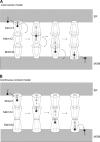
Models of phospholipid transfer by ERMES between the ER and mitochondrial OMs. (A) Lipid carrier model assumes that Mmm1, Mdm12, and Mdm34 have a hydrophobic lipid-binding pocket with an outlet only at the head of the molecules for binding to a phospholipid molecule. They pass the lipid molecule sequentially from Mmm1 at the ER membrane to Mdm34 at the mitochondrial OM via Mdm12 for the lipid transport from the ER to mitochondria. To achieve efficient transfer of lipid molecules between each ERMES component, they have to change their orientations and positions relative to the other components to put the outlet of the lipid-binding pocket of one component close to the one of the other component. (B) The continuous conduit model assumes the presence of the hydrophobic lipid-binding tunnels with two outlets at the head and tail of the molecules of Mmm1, Mdm12, and Mdm34. These tunnels are connected with each other to form a continuous lipid-moving conduit running from Mmm1 to Mdm34 via Mdm12. For lipid transport from the ER to mitochondria, a lipid molecule extracted from the ER membrane by Mmm1 will enter the hydrophobic tunnel in Mmm1 and diffuse through the tunnel to reach the one in Mdm12 and then the one in Mdm34. Finally, the lipid molecule will be released from the other outlet of the tunnel of Mdm34 for insertion into the mitochondrial OM.

References

    1. Adams P.D., Afonine P.V., Bunkóczi G., Chen V.B., Davis I.W., Echols N., Headd J.J., Hung L.-W., Kapral G.J., Grosse-Kunstleve R.W., et al. . 2010. PHENIX: a comprehensive Python-based system for macromolecular structure solution. Acta Crystallogr. D Biol. Crystallogr. 66:213–221. 10.1107/S0907444909052925 - DOI - PMC - PubMed
    1. AhYoung A.P., Jiang J., Zhang J., Khoi Dang X., Loo J.A., Zhou Z.H., and Egea P.F.. 2015. Conserved SMP domains of the ERMES complex bind phospholipids and mediate tether assembly. Proc. Natl. Acad. Sci. USA. 112:E3179–E3188. 10.1073/pnas.1422363112 - DOI - PMC - PubMed
    1. Berendsen H.J.C., Postma J.P.M., van Gunsteren W.F., DiNola A., and Haak J.R.. 1984. Molecular dynamics with coupling to an external bath. J. Chem. Phys. 81:3684–3690. 10.1063/1.448118 - DOI
    1. Berger K.H., Sogo L.F., and Yaffe M.P.. 1997. Mdm12p, a component required for mitochondrial inheritance that is conserved between budding and fission yeast. J. Cell Biol. 136:545–553. 10.1083/jcb.136.3.545 - DOI - PMC - PubMed
    1. Bhattacharya D., and Cheng J.. 2013. 3Drefine: consistent protein structure refinement by optimizing hydrogen bonding network and atomic-level energy minimization. Proteins. 81:119–131. 10.1002/prot.24167 - DOI - PMC - PubMed

Publication types

MeSH terms