. 2018 Mar 1;78(5):1275-1292.
doi: 10.1158/0008-5472.CAN-17-1833. Epub 2017 Dec 26.

GADD45β Loss Ablates Innate Immunosuppression in Cancer

Affiliations

GADD45β Loss Ablates Innate Immunosuppression in Cancer

Daniela Verzella et al. Cancer Res. .

Abstract

T-cell exclusion from the tumor microenvironment (TME) is a major barrier to overcoming immune escape. Here, we identify a myeloid-intrinsic mechanism governed by the NF-κB effector molecule GADD45β that restricts tumor-associated inflammation and T-cell trafficking into tumors. In various models of solid cancers refractory to immunotherapies, including hepatocellular carcinoma and ovarian adenocarcinoma, Gadd45b inhibition in myeloid cells restored activation of proinflammatory tumor-associated macrophages (TAM) and intratumoral immune infiltration, thereby diminishing oncogenesis. Our results provide a basis to interpret clinical evidence that elevated expression of GADD45B confers poor clinical outcomes in most human cancers. Furthermore, they suggest a therapeutic target in GADD45β for reprogramming TAM to overcome immunosuppression and T-cell exclusion from the TME.Significance: These findings define a myeloid-based immune checkpoint that restricts T-cell trafficking into tumors, with potentially important therapeutic implications to generally improve the efficacy of cancer immunotherapy. Cancer Res; 78(5); 1275-92. ©2017 AACR.


Conflict of interest statement

COMPETING FINANCIAL INTERESTS

The authors declare no competing financial interests.

DISCLOSURE OF CONFLICTS OF INTEREST

The authors declare no conflicts of interest.

Figures
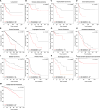
Figure 1
Figure 1. The Widespread Correlation between Elevated GADD45B Expression and Poor Clinical Outcome across Human Cancer Types
(A–M) Relapse-free survival (RFS) and overall survival (OS) in patients with the indicated malignant pathologies, representing thirteen out of the top fifteen solid cancers for mortality worldwide and deposited in the following publicly available datasets: The Cancer Genome Atlas (TCGA) program (A, B, C, F, G, H, K, L and M); the French National Cartes d’Identité des Tumeurs (CIT) program (D); the Tumour Banks in the UK and Canada (E); the Chungbuk National University Hospital (I); and the Australian Ovarian Cancer Study, Royal Brisbane Hospital, Westmead Hospital and Netherlands Cancer Institute (J). Patients in each series were stratified at diagnosis in two groups on the basis of the GADD45B mRNA expression in the tumour tissues, as shown. p values are indicated.
Figure 2
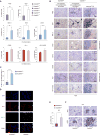
Figure 2. Reduced DEN-Induced HCC Development with Increased Intratumoural Immunoinflammatory Infiltrates and TLS Formation in Gadd45b−/− Mice
(A–C) Number of tumours (≥0.5 mm) (A), tumour surface area (B), and maximum tumour diameter (C) in livers of Gadd45b+/+ (n=9) and Gadd45b−/− (n=12) C57BL/6J males 9 months after DEN injection (20 mg/kg). Values denote means ± SEM. (D) Gross liver morphology in representative mice from (A–C). Arrowheads indicate tumours. (E) Images of H&E staining showing the liver histology in representative mice from (A–C). Hatched lines (top) indicate tumour areas. Solid lines (top) denote the areas magnified in the bottom panels. The arrowhead (bottom, right) indicates a typical immunoinflammatory aggregate. Scales and magnifications are shown. (F) Number of histologically confirmed HCCs per examined liver sections from individual mice in (A–C). Each symbol represents an individual mouse. Horizontal lines denote means. (G and H) Percentages of HCCs (G) and combined HCCs and preneoplastic foci (H) containing TLSs in Gadd45b+/+ (n=19) and Gadd45b−/− (n=26) 129/SvJxC57BL/6J males 11 months after DEN injection (5 mg/kg). Each symbol represents an individual mouse. Horizontal lines denote means. (I) Immunohistochemical (IHC) analysis showing the percentage of positive area or number of positive cells per field at 400x, as stated, of the indicated immune cell populations in HCCs from (G). Values denote means ± SEM (IBA-1: Gadd45b+/+, n=47; Gadd45b−/−, n=34. CD8: Gadd45b+/+, n=37; Gadd45b−/−, n=33. All other markers: Gadd45b+/+, 24≤n≤26; Gadd45b−/−, n=26 or n=27). (J) Images of H&E and IHC staining of representative tumour sections from (I). Scales and magnifications are shown. (A-C and F-I) *, p<0.05; **, p<0.01; ***, p<0.001. See also Figure S1 and Figure S2.
Figure 3
Figure 3. Gadd45b Loss Increases Macrophage Infiltration and Proinflammatory TAM Activation within HCCs
(A) IHC analysis showing the percentage of positive area or number of positive cells per field at 400x, as stated, for the indicated macrophage (F4/80, IBA-1) and proinflammatory and antiinflammatory activation markers in HCCs from Figures 2A-2C. (B) Images of IHC staining of representative tumour sections from (A). Images of Gadd45b−/− HCCs are shown for non-organised immunoinflammatoty cell clusters (middle) and well-organised TLSs (right). Insets denote magnified areas at the top right corners. (C) Immunofluorescence analysis showing the percentages of IBA-1+ macrophages expressing MHC-II per field at 400x in HCCs from Figures 2A-2C. (D) Images of immunofluorescence staining of representative tumour sections from (C). Red, anti-IBA-1; green, anti-MHC-II; blue, DAPI. (E) IHC analysis showing the percentage of IDO-positive area per field at 400x in Gadd45b+/+ and Gadd45b−/− HCCs from (A). (F) Images of IHC staining of representative tumour sections from (E). (A, C and E) Values denote means ± SEM (Gadd45b+/+, 14≤n≤30; Gadd45b−/−, 12≤n≤15). *, p<0.05; **, p<0.01; ***, p<0.001. (B, D and F) Scales and magnifications are shown. See also Figure S2 and Figure S3.
Figure 4
Figure 4. Reduction of DEN-Induced HCC Development by Gadd45b Deletion in BM-Derived Cells
(A) Summary of the treatment schedule used for Protocol A. (B) Numbers of tumours (≥0.5 mm) in livers of WTBM:WTHost (n=40), KOBM:KOHost (n=25), KOBM:WTHost (n=36) and WTBM:KOHost (n=35) BM chimaeras at the time shown in (A). (C) Gross liver morphology in representative mice from (B). (D) Summary of the treatment schedule used for Protocol B. (E) Numbers of tumours (≥0.5 mm) in livers of WTBM:WTHost (n=24), KOBM:KOHost (n=23), KOBM:WTHost (n=24) and WTBM:KOHost (n=29) BM chimaeras at the time shown in (D). (F) Gross liver morphology in representative mice from (E). (A–F) WT, Gadd45b+/+; KO, Gadd45b−/−. BM chimaeras are identified as per “bone marrow donor:recipient” genotypes. (B and E) Values denote means ± SEM. *, p<0.05; **, p<0.01; ***, p<0.001; ****, p<0.0001. (C and F) Arrowheads denote tumours. See also Figure S4.
Figure 5
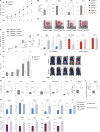
Figure 5. Increased Intratumoural Immunoinflammatory Infiltration, Proinflammatory TAM Activation and Reduced Fibrosarcoma and Ovarian Carcinoma Growth in Gadd45b−/− mice
(A) Volumes of subcutaneous MCA-203 fibrosarcoma allografts in Gadd45b+/+ (n=10) and Gadd45b−/− (n=9) mice at the times shown. (B) IHC analysis showing the percentage of positive areas per field at 400x of the indicated immune cell populations in MCA-203 tumours from Gadd45b+/+ (n=7) and Gadd45b−/− (n=8) mice 19 days after tumour cell injection. (C) Volumes of subcutaneous MCA-203 fibrosarcoma allografts in Gadd45b+/+ and Gadd45b−/− mice treated with anti-CD8 or isotype control antibody, as shown, at the times indicated. Gadd45b+/+: anti-CD8 (n=9), isotype (n=7); Gadd45b−/: anti-CD8 (n=9), isotype (n=4). (D) Images of representative tumours from (C) at day 20. (E) IHC analysis showing the percentage of positive areas per field at 400x of the indicated proinflammatory and antiinflammatory activation markers in the tumours from (B). (F) Relative luminescence units (RLU) of intraperitoneal ID8-Luc ovarian tumour allografts in Gadd45b+/+ (n=10) and Gadd45b−/− (n=10) mice at the times shown after tumour cell injection. (G) Bioluminescence images of representative mice from (F) presented as a pseudocolor scale, whereby red and blue denote the highest and lowest photon flux, respectively. (H) FACS analysis showing the percentage of the indicated intratumoural immune cell populations in Gadd45b+/+ (n=12) and Gadd45b−/− (n=13) mice 60 days after ID8-Luc tumour cell injection. (I) FACS analysis showing the percentage of CD11b+ and F4/80+ double positive TAMs expressing high MHC-II levels (MHC-IIhigh) in ID8-Luc tumours from (H). (J) FACS analysis showing the median MHC-II fluorescence intensity of CD11b+ and F4/80+ double positive TAMs in ID8-Luc tumours from (H). (H–J) Boxes span between the highest values of the first and third quartiles; whiskers extend to the highest and lowest values within 1.5x of the inter-quartile range. Lines within boxes denote medians. (K and L) qRT-PCR showing the relative mRNA levels of the indicated proinflammatory activation markers (K) and immune checkpoint molecules (L) in CD11b+ TAMs from Gadd45b+/+ (n=22) and Gadd45b−/− (n=10 or n=12) mice 10 weeks after ID8-Luc cell injection. (A-C, E, F, K and L) Values denote means ± SEM. (A-C, E, F, and H-L) *, p<0.05; **, p<0.01; ***, p<0.001. See also Figure S5.
Figure 6
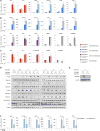
Figure 6. Gadd45b Loss Increases Proinflammatory Macrophage Activation by Enhancing p38 Signalling
(A) qRT-PCR showing the relative mRNA levels of the indicated proinflammatory and antiinflammatory genes in BMDMs from Gadd45b+/+ and Gadd45b−/− mice after a 24-hr co-culture with MCA-203 cells. (B) qRT-PCR showing the relative mRNA levels of the indicated proinflammatory, NF-κB-regulated and immune checkpoint molecule-coding genes in BMDMs from Gadd45b−/− and Gadd45b+/+ mice after a 4-hr (Nfkbia, Tnfaip3 and Gadd45b) or 12-hr (all other genes) stimulation with LPS and IFNγ. (C) qRT-PCR showing the relative mRNA levels of the indicated antiinflammatory genes after a 26-hr stimulation with IL-4 and IL-13. (D and E) Western blots showing total and phosphorylated (P) proteins in Gadd45b+/+ and Gadd45b−/− BMDMs after stimulation with LPS and IFNγ for the times indicated. β-actin is shown as loading control. (F) qRT-PCR showing the relative mRNA levels of the indicated proinflammatory genes in Gadd45b−/− BMDMs left untreated (−) or treated with LPS and IFNγ (+) for 12 hr in the presence (+) or absence (−) of the p38 inhibitor, Vx745 (20 µM). (A-C and F) Values denote means ± SEM (A, B [top] and F, n=4; B [bottom] and C, n=3). *, p<0.05; **, p<0.01; ***, p<0.001. See also Figure S6.
Figure 7
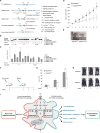
Figure 7. Suppression of Oncogenesis by Macrophage-Specific Gadd45b Deletion
(A) The targeting strategy for generating the loxP-flanked Gadd45b allele (Gadd45bF). (B) PCR detecting the wild-type (Gadd45b+), Gadd45bF or excised (Gadd45bΔ) Gadd45b alleles in the indicated tissues from Gadd45b+/+ (+/+), Gadd45b+/F (+/F), Gadd45bF/F (F/F) or Gadd45bF/F;LysM-cre (ΔMM) mice. (C) qRT-PCR showing the relative Gadd45b mRNA levels in the indicated tissues isolated from Gadd45bF/F (F/F) or Gadd45bF/F;LysM-cre (ΔMM) mice. (D) Volumes of subcutaneous MCA-203 fibrosarcoma allografts in Gadd45bΔM/ΔM (n=9) and Gadd45bF/F(n=8) mice at the times shown. (E) Images of representative tumours from (D) at day 21. (F) Summary of the cell injection schedule used in (G and H). (G) RLUs of intraperitoneal ID8-Luc ovarian tumour allografts in Gadd45b+/+ mice at the times indicated after intraperitoneal injection of Gadd45b+/+ (n=9) or Gadd45b−/− (n=12) BMDM pools. (H) Bioluminescence images of representative mice from (G) presented as a pseudocolor scale as in Figure 5G. (I) Schematic representation of the oncogenic function of Gadd45β in macrophages. (C, D, and G) Values denote means ± SEM. *, p<0.05; **, p<0.01. See also Figure S7.

References

    1. Hanahan D, Weinberg RA. Hallmarks of cancer: the next generation. Cell. 2011;144:646–674. - PubMed
    1. Grivennikov SI, Greten FR, Karin M. Immunity, inflammation, and cancer. Cell. 2010;140:883–899. - PMC - PubMed
    1. Joyce JA, Fearon DT. T cell exclusion, immune privilege, and the tumor microenvironment. Science. 2015;348:74–80. - PubMed
    1. Topalian SL, Drake CG, Pardoll DM. Immune checkpoint blockade: a common denominator approach to cancer therapy. Cancer Cell. 2015;27:450–461. - PMC - PubMed
    1. Gajewski TF, Schreiber H, Fu YX. Innate and adaptive immune cells in the tumor microenvironment. Nat. Immunol. 2013;14:1014–1022. - PMC - PubMed

Publication types

MeSH terms