. 2018 Feb 15;78(4):985-1002.
doi: 10.1158/0008-5472.CAN-17-2129. Epub 2017 Dec 26.

Adaptive and Reversible Resistance to Kras Inhibition in Pancreatic Cancer Cells

Affiliations

Adaptive and Reversible Resistance to Kras Inhibition in Pancreatic Cancer Cells

Pan-Yu Chen et al. Cancer Res. .

Abstract

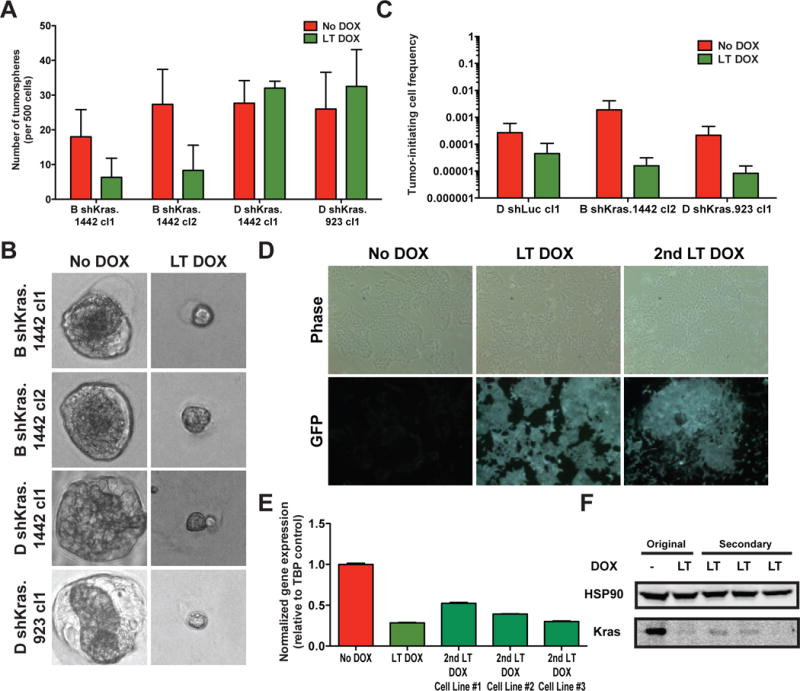
Activating mutations in KRAS are the hallmark genetic alterations in pancreatic ductal adenocarcinoma (PDAC) and the key drivers of its initiation and progression. Longstanding efforts to develop novel KRAS inhibitors have been based on the assumption that PDAC cells are addicted to activated KRAS, but this assumption remains controversial. In this study, we analyzed the requirement of endogenous Kras to maintain survival of murine PDAC cells, using an inducible shRNA-based system that enables temporal control of Kras expression. We found that the majority of murine PDAC cells analyzed tolerated acute and sustained Kras silencing by adapting to a reversible cell state characterized by differences in cell morphology, proliferative kinetics, and tumor-initiating capacity. While we observed no significant mutational or transcriptional changes in the Kras-inhibited state, global phosphoproteomic profiling revealed significant alterations in cell signaling, including increased phosphorylation of focal adhesion pathway components. Accordingly, Kras-inhibited cells displayed prominent focal adhesion plaque structures, enhanced adherence properties, and increased dependency on adhesion for viability in vitro Overall, our results call into question the degree to which PDAC cells are addicted to activated KRAS, by illustrating adaptive nongenetic and nontranscriptional mechanisms of resistance to Kras blockade. However, by identifying these mechanisms, our work also provides mechanistic directions to develop combination strategies that can help enforce the efficacy of KRAS inhibitors.Significance: These results call into question the degree to which pancreatic cancers are addicted to KRAS by illustrating adaptive nongenetic and nontranscriptional mechanisms of resistance to Kras blockade, with implications for the development of KRAS inhibitors for PDAC treatment. Cancer Res; 78(4); 985-1002. ©2017 AACR.


Conflict of interest statement

Conflict of Interest: The authors declare there are no conflict of interest.

Figures

Figure 1
Figure 1. Sustained Kras knockdown in murine PDAC cells in vitro
A. Schematic of lentiviral constructs used to express the reverse tetracycline transactivator (rtTA) and doxycycline-inducible shRNA system. PLTR = 5′-Long Terminal Repeat promoter from MSCV backbone. PPGK = mouse phosphoglycerate kinase promoter. Hygro = hygromycin resistance gene. PTRE = tetracycline-response element minimal promoter. GFP = green fluorescent protein. Puro = puromycin resistance gene. GFP mRNA and hairpins are on the same transcript. B. Kras mRNA levels following short-term (ST DOX, 4 days) or long-term (LT DOX, 21 days) DOX treatment of shLuc- or shKras-transduced cells. Gene expression is normalized to untreated condition with TATA binding protein (TBP) control. Average normalized Kras expression +/− 95% confidence intervals (n=3) of three independent clones from D parental cell line, using two independent hairpins and shLuc as control, is shown. C. Western blot showed sustained Kras protein knockdown following LT DOX treatment. D. Cell viability following ST (5 days) Kras knockdown normalized to untreated (No DOX) condition. Average cell viability +/− s.d. (n=4) is shown. *** p<0.001, two-tailed student t-test. E. Phase-contrast images reveal morphological changes associated with ST and LT DOX treatment. F. Growth curves of untreated (No DOX) and LT DOX cells transduced with shKras or shLuc. Average cell viability (normalized to day 0) +/− s.d. (n=4) is plotted.
Figure 2
Figure 2. The Kras-inhibited state is adaptive and reversible
A. Clonal efficiency of Kras knockdown in four independent shKras clones (two from B line, two from D line, of which one harbors shKras.923 and the other harbors shKras.1442) based on the presence or absence of cells in wells plated with single cells. Clonal efficiency appeared parental line- but not clone- or hairpin-dependent. D line showed no difference in clonal efficiency in the presence or absence of DOX. B line showed a 25-35% decrease under DOX treatment. The majority of cells appeared to survive Kras knockdown. ****p<0.0001, chi-square test. B. Quantitation of clone size 21 days after clonal expansion showed decreased clone size in LT DOX cells. Quantitation is based on solubilizaton of crystal violet stain and measurement of absorbance at 540 nm shown as box plots with 5-95% confidence. **** p<0.0001, two-tailed student’s t-test with Welch correction for unequal variance. C. Kras mRNA levels following DOX withdrawal (DOX WD) from LT DOX cells. Gene expression is normalized to untreated condition withTBP control. Average normalized Kras expression +/− 95% confidence intervals (n=3) of three independent clones from D line, using two independent Kras hairpins and shLuc as control, is shown. D. Reversal of cell morphology following DOX WD. LT DOX images are same as Fig. 1F, as DOX WD cells are derived from LT DOX cells. E. Reversal of proliferative rates by colony forming assay following DOX WD. F. Re-induced sensitivity to Kras knockdown with DOX treatment in reverted cells. Cell viability following ST (5 days) Kras re-knockdown normalized to untreated (No DOX) condition. Average cell viability +/− s.d. (n=4) is shown. *** p<0.001, unpaired student t-test comparing to No DOX condition.
Figure 3
Figure 3. Characterization of tumor-initiating properties of Kras-inhibited PDAC cells
A. Quantitation showing parental cell line variation in the efficiency of tumorsphere formation in matrigel-based 3D cultures with Kras knockdown. Average number of tumorspheres formed +/− s.d. (n=3) per 500 cells plated is shown. B. Tumorspheres imaged 12 days after plating demonstrated decreased size in LT DOX. C. Quantitation of tumor-initiating cell (TIC) number showed decreased TIC in LT DOX shKras-expressing cell lines. D. Secondary cell lines derived from LT DOX-treated shKras-expressing tumors retained GFP expression. Phase-contrast and fluorescence images of representative secondary cell line at 18 days post-tumor dissociation (2nd LT DOX) are shown compared to the original cell line either untreated (No DOX) or treated with DOX for >21 days (LT DOX) in vitro. E. Kras mRNA levels of pre-transplant and secondary cell lines derived from LT DOX-transplanted cells. Gene expression is normalized to untreated (No DOX) condition with TBP control. Average normalized Kras expression +/− 95% confidence intervals (n=3) is shown. F. Western blot of cell lines in (E) demonstrated decreased Kras protein levels in secondary cell lines comparable to original cell line treated with DOX in vitro prior to transplant.
Figure 4
Figure 4. Gene expression analysis of Kras-inhibited cells shows minimal transcriptional changes
A. Unsupervised hierarchical clustering across all expressed genes from RNA-sequencing data demonstrated segregation based on parental cell line and clone rather than Kras knockdown status (red box = no DOX, uninhibited; green box = LT DOX, Kras-inhibited). Multiple boxes of the same DOX condition for the same clone are replicates, which cluster together. B. Heatmaps of DOX and Kras knockdown (KD) signatures derived from independent component analysis of clone pairs in (A). Columns represent distinct gene expression patterns (signatures), where colors encode directionality of gene expression and color intensity denotes strength of signature (Z-score) for each sample. C. DOX signature profile of individual cell line groups based on hairpin (shKras vs. shLuc) and DOX treatment conditions. Higher scores indicate greater correlation of individual cell lines with DOX signature. *p<0.05, Mann-Whitney U-test, comparing shKras/shLuc LT DOX vs. shKras/shLuc No DOX. D. Kras knockdown signature profile of individual cell line groups based on hairpin (shKras vs. shLuc) and DOX treatment. Higher scores indicate greater correlation of individual cell lines with DOX signature. *p<0.05, Mann-Whitney U-test, comparing shKras LT DOX vs. other groups. E. Network representation of overlapping enriched GSEA/MSigDB gene sets in the Kras knockdown signature (p<0.05, FDR<0.25). Each circle represents a gene set with circle size corresponding to gene set size and intensity corresponding to enrichment significance. Red is upregulated and blue is downregulated. Each line corresponds to a minimum 50% mutual overlap with line thickness corresponding to the degree of overlap. Cellular processes associated with related gene sets are listed.
Figure 5
Figure 5. Unbiased phosphoproteomic analysis of signaling alterations in Kras-inhibited cells
A. Western blot of total phospho-tyrosine levels (total pY) showed increased total pY in Kras-inhibited cells. Blue arrows indicate protein bands exhibiting increased intensity in Kras-inhibited cells. B. Overlap of pY peptides between 3 technical replicates of iTRAQ experiments. Criteria for such peptides are that they are unambiguously assigned, can be unique or not unique to a protein, phosphorylated, with an isolation interference ≤25 (low chance of contaminating or co-eluting peptides), and have a Mascot score of ≥25 (high confidence in the identification of the peptide). C. Scatter plot of the ratio (LT DOX/No DOX) of the abundance of pY sites identified in at least 2 iTRAQ experiments. Focal adhesion-associated proteins containing upregulated pY sites in the LT DOX state in both B (B shKras.923 cl1) and D (D shKras.1442 cl2) lines are labeled (green). Changes in peptide abundance significantly correlated between the two subclones analyzed (p<0.0001, R2 = 0.1875, Pearson correlation). D. Scatter plot of the log2 ratio (LT DOX/No DOX) of the abundance of pY sites identified in SILAC. Focal adhesion-associated proteins containing upregulated pY sites in the LT DOX state in both B and D lines are labeled (green). Changes in peptide abundance did not significantly correlate between the two subclones (p=0.4601, R2=0.004755, Pearson correlation).
Figure 6
Figure 6. Kras-inhibited cells exhibit enhanced adherence properties and dependence
A. Immunofluorescence of vinculin revealed the distribution of focal adhesion plaques of No DOX and LT DOX cells. Scale bar indicates 20μm. B. Quantitation of the percentage of cells containing focal adhesion plaques. Average % +/− s.d. (n=12) is shown. **** p<0.0001, two-tailed student’s t-test, LT DOX vs. No DOX. C. Quantitation of focal adhesions per cell area (μm2). Average +/− s.d. (n=8) is shown. * p<0.05, Mann-Whitney U-test, LT DOX vs. No DOX. D. Normalized cell number (LT DOX vs. No DOX) +/− s.d. (n=5) of adherent cells one hour after plating of single-cell suspension for shLuc and shKras-transduced clones derived from A and D lines. *** p<0.001, **** p<0.0001, two-tailed student’s t-test, LT DOX vs. No DOX. E. Phase-contrast images of Kras-uninhibited (No DOX) and -inhibited (LT DOX) clone pairs 1 hour after treatment with the actin polymerization inhibitor latrunculin B. F. Western blot showed increased expression of the apoptotic marker cleaved-caspase 3 (CC3) in Kras-inhibited cells after forced suspension growth for 48 hours. G. Normalized cell viability +/− s.e.m. (n=6) of cells grown in suspension with or without 2% matrigel. Brightfield and fluorescence images of LT DOX tumorspheres maintaining GFP expression are shown.
Figure 7
Figure 7. KRAS-inhibited 8988T cells exhibit altered cell proliferation and enhanced adherence properties and dependence
A. KRAS mRNA levels for no DOX, DOX-treated (10 days), and WD DOX (DOX for 5 days, no DOX for 5 days) of shLACZ.1650- or shKRAS.407-transduced 8988T cells. Gene expression is normalized to untreated condition with beta-actin (ACTB) control. Average normalized Kras expression +/− s.e.m. (n=2) is shown. B. Cell viability following ST (5 days) KRAS knockdown normalized to untreated (No DOX) condition for 8988T cells transduced with inducible shLACZ.1650 (iLACZ) or shKRAS.407 (iKRAS). WD: 8988T iKRAS-transduced cells treated with DOX for 5 days and then taken off DOX for 5 days restoring proliferation. WD cells exhibited reduced cell viability following repeat DOX treatment and KRAS knockdown. Average cell viability +/− s.d. (n=5) is shown. *** p<0.001, two-tailed student t-test comparing to No DOX condition). C. KRAS knockdown decreases colony forming ability of 8988T cells, which is partially reversed (proportional to the increase in KRAS expression in (A)) following DOX withdrawal (WD). D. Immunofluorescence of vinculin revealed the distribution of focal adhesion plaques of No DOX and LT DOX cells. Scale bar indicates 20μm. E. Western blot showed increased expression of the apoptotic marker cleaved-PARP (cPARP) in KRAS-inhibited cells after forced suspension growth for 48 hours. F. Quantitation of the percentage of cells containing focal adhesion plaques. Average % +/− s.d. (n=12) is shown. **** p<0.0001, two-tailed student’s t-test for designated comparisons. G. Quantitation of the number of focal adhesions per cell area (μm2). Average +/− s.d. (n=8) is shown. ** p<0.01, **** p<0.0001, two-tailed t-test for designated comparisons.

References

    1. Ryan DP, Hong TS, Bardeesy N. Pancreatic Adenocarcinoma. NEJM. 2014;371:1039–49. - PubMed
    1. American Cancer Society. Cancer Facts and Figures 2017. Atlanta: A; 2017.
    1. Conroy T, Desseigne F, Ychou M, Bouché O, Guimbaud R, Bécouarn Y, et al. FOLFIRINOX versus gemcitabine for metastatic pancreatic cancer. N Engl J Med. 2011;364:1817–25. - PubMed
    1. Von Hoff DD, Ervin T, Arena FP, Chiorean EG, Infante J, Moore M, et al. Increased Survival in Pancreatic Cancer with nab-Paclitaxel plus Gemcitabine. N Engl J Med. 2013;369:1691–703. - PMC - PubMed
    1. Jones S, Zhang X, Parsons DW, Lin JC-H, Leary RJ, Angenendt P, et al. Core signaling pathways in human pancreatic cancers revealed by global genomic analyses. Science. 2008;321:1801–6. - PMC - PubMed

Publication types

MeSH terms

Substances