Review
. 2017 Dec 18:16:Doc03.
doi: 10.3205/cto000142. eCollection 2017.

Diagnostics and therapy of vestibular schwannomas - an interdisciplinary challenge

Affiliations
Review

Diagnostics and therapy of vestibular schwannomas - an interdisciplinary challenge

Steffen Rosahl et al. GMS Curr Top Otorhinolaryngol Head Neck Surg. .

Abstract

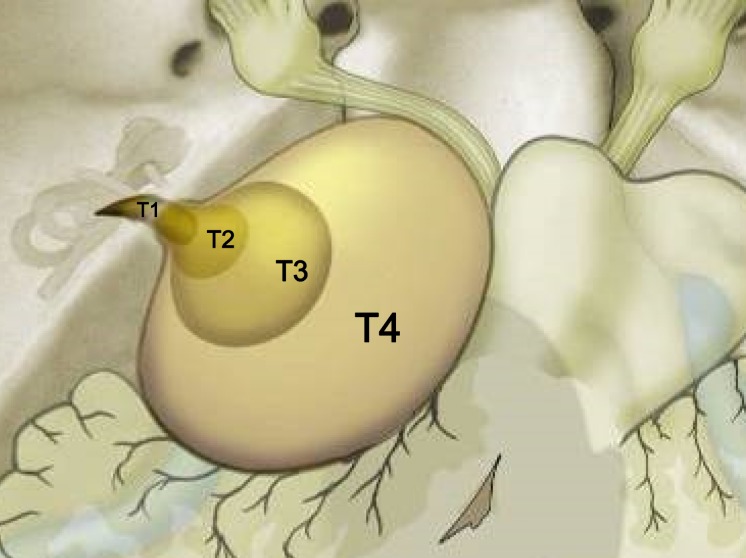
Vestibular schwannomas (VS) expand slowly in the internal auditory canal, in the cerebellopontine angle, inside the cochlear and the labyrinth. Larger tumors can displace and compress the brainstem. With an annual incidence of 1:100,000 vestibular schwannoma represent 6-7% of all intracranial tumors. In the cerebellopontine angle they are by far the most neoplasm with 90% of all lesions located in this region. Magnetic resonance imaging (MRI), audiometry, and vestibular diagnostics are the mainstays of the clinical workup for patients harboring tumors. The first part of this paper delivers an overview of tumor stages, the most common grading scales for facial nerve function and hearing as well as a short introduction to the examination of vestibular function. Upholding or improving quality of life is the central concern in counseling and treating a patient with vestibular schwannoma. Preservation of neuronal function is essential and the management options - watchful waiting, microsurgery and stereotactic radiation - should be custom-tailored to the individual situation of the patient. Continuing interdisciplinary exchange is important to monitor treatment quality and to improve treatment results. Recently, several articles and reviews have been published on the topic of vestibular schwannoma. On the occasion of the 88th annual meeting of the German Society of Oto-Rhino-Laryngology, Head and Neck surgery a special volume of the journal "HNO" will be printed. Hence this presentation has been designed to deviate from the traditional standard which commonly consists of a pure literature review. The current paper was conceptually woven around a series of interdisciplinary cases that outline examples for every stage of the disease that show characteristic results for management options to date. Systematic clinical decision pathways have been deduced from our experience and from results reported in the literature. These pathways are graphically outlined after the case presentations. Important criteria for decision making are size and growth rate of the tumor, hearing of the patient and the probability of total tumor resection with preservation of hearing and facial nerve function, age and comorbidity of the patient, best possible control of vertigo and tinnitus and last but not least the patient's preference and choice. In addition to this, the experience and the results of a given center with each treatment modality will figure in the decision making process. We will discuss findings that are reported in the literature regarding facial nerve function, hearing, vertigo, tinnitus, and headache and reflect on recent studies on their influence on the patient's quality of life. Vertigo plays an essential role in this framework since it is an independent predictor of quality of life and a patient's dependence on social welfare. Pathognomonic bilateral vestibular schwannomas that occur in patients suffering from neurofibromatosis typ-2 (NF2) differ from spontaneous unilateral tumors in their biologic behavior. Treatment of neurofibromatosis type-2 patients requires a multidisciplinary team, especially because of the multitude of separate intracranial and spinal lesions. Off-label chemotherapy with Bevacizumab can stabilize tumor size of vestibular schwannomas and even improve hearing over longer periods of time. Hearing rehabilitation in NF2 patients can be achieved with cochlear and auditory brainstem implants.

Keywords: acoustic neuroma; management; microsurgery; quality of life; radiosurgery; vestibular schwannoma.


Conflict of interest statement

The authors declare that they have no competing interests.

Figures

Table 1
Table 1. Grading of the facial nerve function, simplified according to House & Brackmann [105] mentioning the percentage of the deficit.
Table 2
Table 2. Decision matrix with hypothetical data on the treatment of a patient
Figure 1
Figure 1. Options for the management of patients with vestibular schwannomas.
Generally, for individual patients a combination of the 3 management pillars and at different times a switch from one modality to another is possible. So a primarily growing and then micro- or radiosurgically treated vestibular schwannoma may first be observed and in cases of recurrent growth, the other treatment procedure may be applied.
Figure 2
Figure 2. Tumor stages according to Samii [9, 20].
T1: intracanalicular; T2: intra-/extrameatal; T3: tumor reaches the brainstem; T4: tumor compresses the brainstem.
Figure 3
Figure 3. Cross-table with hypothetic data for displaying study results after interventions in cases of vestibular schwannomas.
The columns represent the percentage of the changes of speech discrimination, the lines represent the average level changes in the speech range of the tone audiogram. An improvement of the hearing ability is improbable; hence the results are in the inferior left quadrant (modified according to [22]).
Figure 4
Figure 4. Upper row: preoperative MRI, T1-w + CM, A transversal; B coronal; C CISS transversal. Lower row: postoperative MRI, T1-w + CM; D transversal; E coronal; F transversal CISS.
Figure 5
Figure 5. MRI, T1 FS + CM; A axila; B coronal. Intra- und slightly extrameatal vestibular on the right measuring 9x5x5 mm.
Figure 6
Figure 6. MRI, T1 FS + CM; A, C axial; B, D coronal; A, B 3 months after surgery; C, D 5 years after surgery. No hint for residual or recurrent tumor in the internal auditory meatus on the right side. Postoperative changes in the right temporal region.
Figure 7
Figure 7. Preoperative MRI, T1 + CM; A axial; B coronal; 6x4x3 mm measuring intrameatal vestibular schwannoma on the right side. MRT, T1 + CM axial; C 5 months after surgery no hint for residual tumor or recurrent after translabyrinthine resection.
Figure 8
Figure 8. Upper row: preoperative MRI, T1-w + CM; A transversal, B coronal, C CISS transversal. Lower row: postoperative MRI, T1-w + contrast agent, D transversal; E coronal; F CISS transversal.
Figure 9
Figure 9. MRI, ; A axial, initial findings; T1 FS + CM, control after 4 months without therapy (B axial, C coronal).
Figure 10
Figure 10. MRI 3 months after surgery, axial, T1 FS + CM.
No recurrence after translabyrinthine resection 3 months after surgery.
Figure 11
Figure 11. Preoperative MRI, T1-w + CM; A transversal; B. Postoperative MRI, T1-w + CM; C transversal, D coronal.
Figure 12
Figure 12. Upper row: MRI follow-up over more than 4 years; A T1-w + CM axial; lower roe: B T2 (FIESTA) transversal before surgery; T1-w + CM; C axial and D coronal postoperative.
Figure 13
Figure 13. Preoperative MRI, T1-w + CM; A transversal; B coronal. The tumor reaches the fundus of the internal auditory meatus and the brainstem. MRI 4 months after surgery, T1-w + CM; C transversal; D coronal.
Figure 14
Figure 14. Upper row: preoperative MRI, T1-w + CM; A transversal; B coronal; C surgery site before complete resection of a residual tumor. Facial and cochlear nerves are less adherent, the labyrinthine artery is well seen. Lower row: postoperative MRI, T1-w FS + CM; D transversal; E coronal. Preoperative (green) and postoperative (red) tone audiogram. The linear contrast enhancement at the posterior wall of the right internal auditory meatus and extrameatal meningeal is a consequence of the fistula covering and not a hint to residual tumor.
Figure 15
Figure 15. Preoperative MRI, T1-w + CM; A transversal; B coronal. 2 years after surgery, MRI T1-w + CM; C transversal; D coronal; liquor pad in the surgical pathway, linear homogeneous contrast enhancement in the left internal auditory meatus corresponding to the residual tumor.
Figure 16
Figure 16. Preoperative MRI, T1-w + CM; A transversal; B coronal. 1 year after surgery, MRI, T1-w + CM; C transversal; D coronal; gliosis zone in the left cerebellar peduncle as consequence of the compression by the tumor. The hydrocephalus regressed, the ventricular system is again normally wide.
Figure 17
Figure 17. Upper row: preoperative MRI (T1-w + CM; A transversal) and follow-up MRI. 3 months after the 1st surgery, there is still a larger residual tumor in situ. After 19 months is has slightly increased, also 2 years after irradiation, the tumor is progressive, the brainstem is compressed. Lower row: MRI 6 months after the 2nd resection. T1-w + contrast agent application; B transversal; C coronal.
Figure 18
Figure 18. Preoperative MRI, T1-w + CM; A transversal; B coronal. MRI 9 years after surgery, T1-w + CM; C transversal; D coronal. Intensive homogeneous contrast enhancement of the residual tumor.
Figure 19
Figure 19. Up to now, the postoperative MRI follow-up (T1-w + CM, axial) did not show any growth of the residual tumor.
Figure 20
Figure 20. Intrameatal vestibular schwannoma, growing after 7 months from 4x4 mm to 8x6 mm; T1-w + CM, axial; A initial findings; B MRI control after 7 months.
Figure 21
Figure 21. The MRI follow-up control (T1-w + CM, axial) after therapy first show a minimal growth with cystic transformation of the tumor and in the further course a reduced volume.
Figure 22
Figure 22. The MRI follow-up examinations (T1-w + CM) show progressive tumor shrinking. The pink line corresponds to the tumor size 18 months after radiosurgery.
Figure 23
Figure 23. The MRI follow-up examinations (T1-w + CM) show progressive shrinking of the tumor at 7 months after RS onwards.
Figure 24
Figure 24. The MRI follow-up examinations (T1-w + CM) show progressive tumor shrinking. Already prior to therapy, the tumor is inhomogeneous, after RS further regressive central contrast enhancement. In the follow-up, regression of tumor size up to 3 years after RS, then constant tumor size over >8 years.
Figure 25
Figure 25. The MRI follow-up examinations (T1-w + CM) show progressive tumor shrinking.
Figure 26
Figure 26. The MRI follow-up examinations (T1-w + CM) show an increased tumor after 1 year.
Figure 27
Figure 27. The MRI follow-up examinations (T1-w + CM) show first a clear growth of the tumor with low marginal contrast enhancement 3 months after RS, in the further course, shrinking of the tumor and again homogeneous contrast agent application.
Figure 28
Figure 28. The MRI follow-up examinations (T1-w + CM) first show a nearly constant tumor size with only low marginal contrast enhancement (1 year after RS), in the following years, progressive tumor shrinking with increasing contrast enhancement.
Figure 29
Figure 29. 10 months after SRT, the MRI follow-up controls (T1-w + CM) show a shrinking of the tumor with only low marginal contrast enhancement, in the following years, progressive tumor shrinking with increasing contrast enhancement.
Figure 30
Figure 30. In the first years, the MRI follow-up examinations (T1-w + CM) show a growing tumor with nearly unchanged inhomogeneous contrast enhancement, only after 3.5 years, the tumor is shrinking.
Figure 31
Figure 31. In the first years, the MRI follow-up control (T1-w + CM + contrast agent application) show a growing tumor with nearly unchanged contrast enhancement, only after 6 years, the tumor volume decreases.
Figure 32
Figure 32. After 3 years, the MRI follow-up examinations (T1-w + CM) only show minimal size reduction, after 4.5 years, clear regression, the extrameatal part has nearly completely disappeared.
Figure 33
Figure 33. The MRI follow-up controls (T1-w + CM) show an increased size after 5 months with regressive central contrast enhancement, after 8 months only marginal contrast enhancement and constant size. After 3 years, shrinking tumor with again homogeneous and intensive contrast enhancement.
Figure 34
Figure 34. The MRI follow-up controls (T1-w + CM) show an inhomogeneous contrast enhancement of the tumor before therapy. After 6 months, minimal shrinking with slightly reduced contrast enhancement. After 17 months, again increased contrast enhancement with unchanged tumor size. After 3.5 years again tumor growth to 2.1 cm³. After second radiosurgery with 12 Gy margin dose (80%) again central contrast decrease and reduction of the tumor size to 0.12 cm³.
Figure 35
Figure 35. The MRI follow-up controls (T1-w + CM) show an inhomogeneous contrast enhancement of the tumor before therapy. 7 months after SRT, increased size and surrounding edema, centrally reduced contrast enhancement. After 1 year, constant size with again increased contrast enhancement. In the further course, regressing tumor volume. After 4.5 years, again tumor progress (the orange line corresponds to the tumor size at the time of 1st SRT).
Figure 36
Figure 36. Best clinical condition and MRI findings up to 2.5 years after irradiation further marginal tumor regression. 4 years later, again significant tumor growth to 14.2 cm³. Meanwhile, the patient had to undergo dialysis because of renal failure. She strictly refused surgery. Upon her urgent wish, again SRT with 22x1.8 Gy was started that had to be interrupted after the 16th fraction because of a fall with bilateral fractures of the ischium and the pubic bones and intensive care that was necessary because of metabolic imbalance. The patient dies of multiorgan failure.
Figure 37
Figure 37. Axial MRI, T1–w + CM; constant size of a vestibular schwannoma during a follow-up of 6.5 years.
Figure 38
Figure 38. MRI 1.5 T; CISS axial; 0.8 mm slice thickness. Upper row: 5 years after diagnosis; 4 years after diagnosis; 3 years after diagnosis. Lower row: 2 years after diagnosis; 1 years after diagnosis; initial diagnosis.
Figure 39
Figure 39. Axial and coronal MRI; T1–w + CM . Mostly constant size of a vestibular schwannoma during an observation time of 3.5 years.
Figure 40
Figure 40. Decision algorithm for patients with a tumor diameter of more than 25 mm.
Figure 41
Figure 41. Decision algorithm for patients with a tumor diameter of less than 25 mm.
Figure 42
Figure 42. Possible constellations and treatment options in the management of vestibular schwannomas with neurofibromatosis type 2; A bilaterally large tumors and bilaterally functional hearing ability; B bilaterally large tumors and only unilaterally functional hearing ability; C bilaterally large tumors and bilaterally no functional hearing ability; D different tumor sizes and bilaterally functional hearing ability; E significantly different tumor sizes and hearing loss on the side of the smaller tumor; F significantly different tumor sizes and bilateral hearing loss.

References

    1. Böcker W, Denk H, Heitz PU, Moch H. Pathologie. 4 ed. Münschen, Jena: Urban & Fischer Verlag/Elsevier GmbH; 2008.
    1. Probst R, Grevers G, Iro H. Hals-Nasen-Ohren-Heilkunde. 3 ed. Stuttgart: Thieme; 2008.
    1. Neurofibromatosis. Conference statement. National Institutes of Health Consensus Development Conference. Arch Neurol. 1988 May;45(5):575–578. - PubMed
    1. Baser ME, Friedman JM, Joe H, Shenton A, Wallace AJ, Ramsden RT, Evans DG. Empirical development of improved diagnostic criteria for neurofibromatosis 2. Genet Med. 2011 Jun;13(6):576–581. doi: 10.1097/GIM.0b013e318211faa9. Available from: http://dx.doi.org/10.1097/GIM.0b013e318211faa9. - DOI - DOI - PubMed
    1. Evans DG, Huson SM, Donnai D, Neary W, Blair V, Newton V, Harris R. A clinical study of type 2 neurofibromatosis. Q J Med. 1992 Aug;84(304):603–618. - PubMed