. 2017 Dec 22;4(6):ENEURO.0392-17.2017.
doi: 10.1523/ENEURO.0392-17.2017. eCollection 2017 Nov-Dec.

Combinatorial Inputs to the Ventral Striatum from the Temporal Cortex, Frontal Cortex, and Amygdala: Implications for Segmenting the Striatum

Affiliations

Combinatorial Inputs to the Ventral Striatum from the Temporal Cortex, Frontal Cortex, and Amygdala: Implications for Segmenting the Striatum

Eun Young Choi et al. eNeuro. .

Abstract

The canonical striatal map, based predominantly on frontal corticostriatal projections, divides the striatum into ventromedial-limbic, central-association, and dorsolateral-motor territories. While this has been a useful heuristic, recent studies indicate that the striatum has a more complex topography when considering converging frontal and nonfrontal inputs from distributed cortical networks. The ventral striatum (VS) in particular is often ascribed a "limbic" role, but it receives diverse information, including motivation and emotion from deep brain structures, cognition from frontal cortex, and polysensory and mnemonic signals from temporal cortex. Using anatomical tract-tracing in 17 male adult monkeys (Macaca nemestrina, Macaca fascicularis, Macaca mulatta), we build upon this striatal map by systematically mapping inputs from frontal cortex, amygdala, temporal pole, and medial temporal cortex. We find that the VS contains heterogeneous subregions that become apparent when considering both the identities and strengths of inputs. We parcellated the VS into a ventromedial sector receiving motivation and emotion-related information from regions including area TG, ventromedial PFC, ACC, and amygdala; and a more functionally diverse dorsolateral sector that receives this information coupled to cognitive and sensorimotor information from dorsolateral PFC, ventrolateral PFC, premotor cortex, area TAr, and area TEr. Each sector was further parcellated into smaller regions that had different proportions of these inputs. Together, the striatum contains complex, selective input combinations, providing substrates for myriad associations. This VS parcellation provides a map that can guide and interpret functional interactions in healthy individuals and those with psychiatric disorders, and may be useful in targeting treatments for specific psychiatric conditions.

Keywords: anatomic connections; basal ganglia; circuit integration; corticostriatal circuitry.


Figures

Figure 1.
Figure 1.
Ventral striatum. The boundary between the VSd and VSv and the ventral border of the VSv were based on AChE (A, B) and CB (C) staining identifying the shell of the NAc and olfactory tubercle. D, The dorsal border of the VSd was based on corticostriatal projection zones from emotion-processing prefrontal cortical regions (vmPFC, ACC, OFC). E, Schematic of VSd and VSv boundaries (dashed lines) and six striatal retrograde injection sites. OT, olfactory tubercle; IC, internal capsule; Ca, caudate; Pu, putamen.
Figure 2.
Figure 2.
Temporal pole, adjacent areas, and medial temporal cortex. Coronal slices of areas and structures within TP+ stained with WFA (A) or NeuN (B). C, D, Sagittal slices of TP+ stained with PV. Slice locations for A–D shown in inset of A. Coronal slices of the anterior MTC (E) and posterior MTC (F) stained with NeuN. G, Orbital view of temporal lobe showing schematic of 11 anterograde injections placed in TP+ (area TG, TEr) and MTC (EC, 36, TH, TL/TF, TF). Lines indicate slice locations for E, F. Short black lines in A–F and dashed lines in G indicate areal boundaries. Am, amygdala; CA, cornu ammonis; Hip, hippocampus; LI, limen insula; PaS, parasubiculum; ProS, prosubiculum; S, subiculum; acf, anterior calcarine fissure; amts, anterior middle temporal sulcus; ots, occipital temporal sulcus; rs, rhinal sulcus; sts, superior temporal sulcus.
Figure 3.
Figure 3.
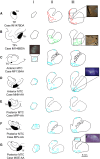
Temporal inputs to the striatum: anterograde labeling. Anterograde tracer injections in the TP (A), TEr in the rostral inferior temporal cortex (B), and the anterior (C, D) and posterior (E, G) MTC show three broad patterns (red, green, cyan) of dense terminal projections in the striatum. Note the split in projections from MTC to the dorsal and ventral striatum.
Figure 4.
Figure 4.
MTC projections to the striatum. 3D model of aggregate striatal projections (cyan) from anterograde injections in the anterior and posterior MTC (EC, areas 36, TH, TL/TF, and TF). Note the split in projections to the dorsal and ventral striatum and their convergence in the rostral pole of the caudate.
Figure 5.
Figure 5.
Temporal inputs to the striatum: retrograde labeling. Coronal sections of TP+ and MTC from four tracer injections in the VS (A–D) and two injections in the dorsal caudate (E, F). All parts of the VS receive strong projections from the TP and MTC. Rostral inferior temporal cortex (area TEr) sends projections primarily to the VSv and central and lateral VSd.
Figure 6.
Figure 6.
Overlap of temporal, frontal, and amygdala projections in the striatum. Outlines (black) of dense projections from TP+ and MTC are overlaid on schematic composites of dense projections (filled) from various frontal regions. Temporal injection sites shown above. Ca, caudate; Pu, putamen; NAc, nucleus accumbens.
Figure 7.
Figure 7.
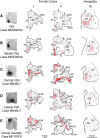
Frontal and amygdala inputs to the striatum: retrograde labeling. A–D, Four retrograde tracer injections in VS. E, One injection in the rostral dorsal caudate. Coronal sections of the frontal cortex (i, ii) and amygdala (iii). AB, accessory basal nucleus; B, basal nucleus; L, lateral nucleus. Aiii, Ciii, and Diii are reprinted with minor stylistic edits from Fudge et al. (2002) with permission from Elsevier, Inc.
Figure 8.
Figure 8.
Relative contributions (percentage) of TP+, MTC, and frontal cortical inputs to the striatum. Thick black lines separate temporal and frontal cortical areas. See Table 2 for percentage values. Same cases as in Fig. 7.

References

    1. Amaral DG, Bassett JL (1989) Cholinergic innervation of the monkey amygdala: an immunohistochemical analysis with antisera to choline acetyltransferase. J Comp Neur 281:337–361. 10.1002/cne.902810303 - DOI - PubMed
    1. Averbeck BB, Lehman J, Jacobson M, Haber SN (2014) Estimates of projection overlap and zones of convergence within frontal-striatal circuits. J Neurosci 34:9497–9505. 10.1523/JNEUROSCI.5806-12.2014 - DOI - PMC - PubMed
    1. Barnes KA, Cohen AL, Power JD, Nelson SM, Dosenbach YB, Miezin FM, Petersen SE, Schlaggar BL (2010) Identifying basal ganglia divisions in individuals using resting-state functional connectivity MRI. Front Syst Neurosci 4:18. 10.3389/fnsys.2010.00018 - DOI - PMC - PubMed
    1. Blatt GJ, Pandya DN, Rosene DL (2003) Parcellation of cortical afferents to three distinct sectors in the parahippocampal gyrus of the rhesus monkey: an anatomical and neurophysiological study. J Comp Neur 466:161–179. 10.1002/cne.10866 - DOI - PubMed
    1. Bohanna I, Georgiou-Karistianis N, Egan GF (2011) Connectivity-based segmentation of the striatum in Huntington’s disease: vulnerability of motor pathways. Neurobiol Dis 42:475–481. 10.1016/j.nbd.2011.02.010 - DOI - PubMed

Publication types

LinkOut - more resources