

Association of Short-term Exposure to Air Pollution With Mortality in Older Adults
- PMID: 29279932
- PMCID: PMC5783186
- DOI: 10.1001/jama.2017.17923
Association of Short-term Exposure to Air Pollution With Mortality in Older Adults
Abstract
Importance: The US Environmental Protection Agency is required to reexamine its National Ambient Air Quality Standards (NAAQS) every 5 years, but evidence of mortality risk is lacking at air pollution levels below the current daily NAAQS in unmonitored areas and for sensitive subgroups.
Objective: To estimate the association between short-term exposures to ambient fine particulate matter (PM2.5) and ozone, and at levels below the current daily NAAQS, and mortality in the continental United States.
Design, setting, and participants: Case-crossover design and conditional logistic regression to estimate the association between short-term exposures to PM2.5 and ozone (mean of daily exposure on the same day of death and 1 day prior) and mortality in 2-pollutant models. The study included the entire Medicare population from January 1, 2000, to December 31, 2012, residing in 39 182 zip codes.
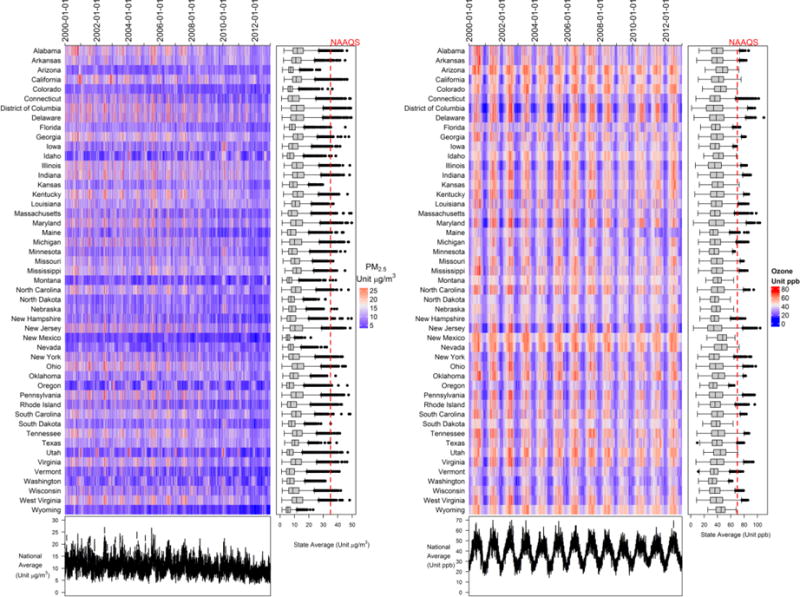
Exposures: Daily PM2.5 and ozone levels in a 1-km × 1-km grid were estimated using published and validated air pollution prediction models based on land use, chemical transport modeling, and satellite remote sensing data. From these gridded exposures, daily exposures were calculated for every zip code in the United States. Warm-season ozone was defined as ozone levels for the months April to September of each year.
Main outcomes and measures: All-cause mortality in the entire Medicare population from 2000 to 2012.
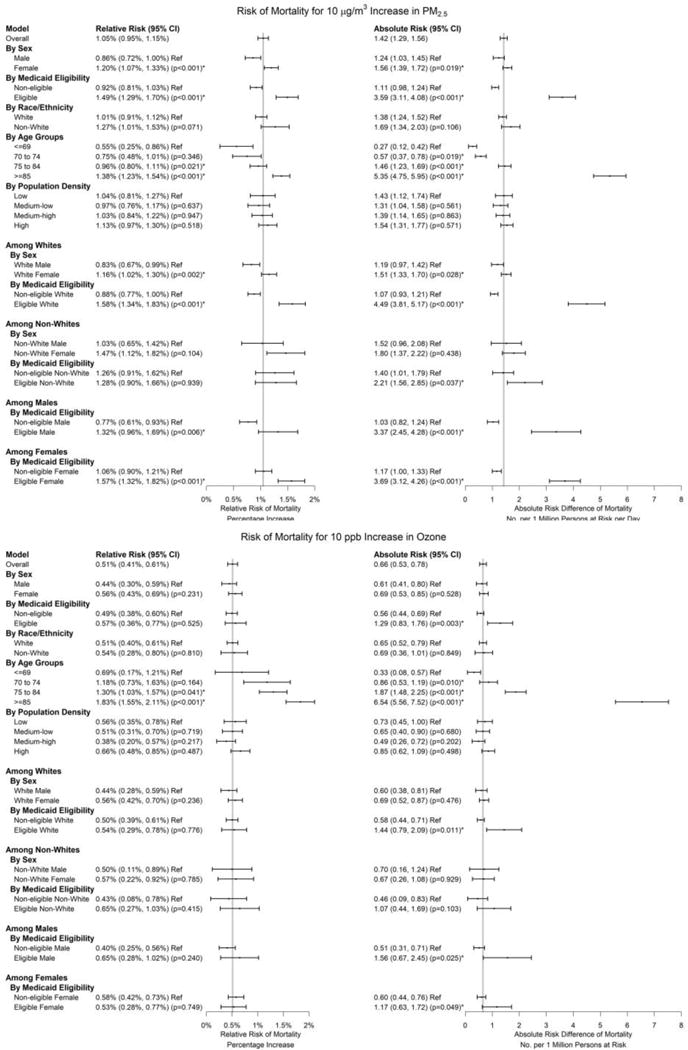
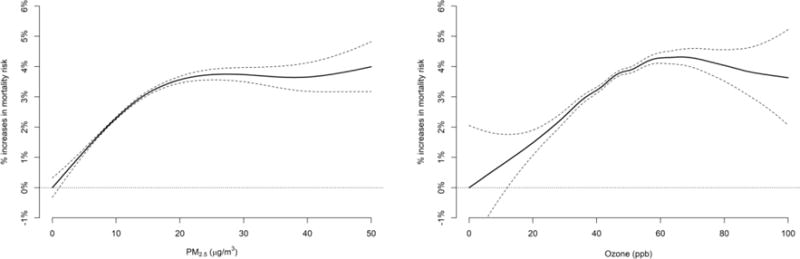
Results: During the study period, there were 22 433 862 million case days and 76 143 209 control days. Of all case and control days, 93.6% had PM2.5 levels below 25 μg/m3, during which 95.2% of deaths occurred (21 353 817 of 22 433 862), and 91.1% of days had ozone levels below 60 parts per billion, during which 93.4% of deaths occurred (20 955 387 of 22 433 862). The baseline daily mortality rates were 137.33 and 129.44 (per 1 million persons at risk per day) for the entire year and for the warm season, respectively. Each short-term increase of 10 μg/m3 in PM2.5 (adjusted by ozone) and 10 parts per billion (10-9) in warm-season ozone (adjusted by PM2.5) were statistically significantly associated with a relative increase of 1.05% (95% CI, 0.95%-1.15%) and 0.51% (95% CI, 0.41%-0.61%) in daily mortality rate, respectively. Absolute risk differences in daily mortality rate were 1.42 (95% CI, 1.29-1.56) and 0.66 (95% CI, 0.53-0.78) per 1 million persons at risk per day. There was no evidence of a threshold in the exposure-response relationship.
Conclusions and relevance: In the US Medicare population from 2000 to 2012, short-term exposures to PM2.5 and warm-season ozone were significantly associated with increased risk of mortality. This risk occurred at levels below current national air quality standards, suggesting that these standards may need to be reevaluated.
Conflict of interest statement
Dr. Joel Schwartz received funding from the US Department of Justice. The authors have completed ICMJE forms and do not have any additional potential conflicts of interest.
Figures
Comment in
-
Low-Level Air Pollution Associated With Death: Policy and Clinical Implications.JAMA. 2017 Dec 26;318(24):2431-2432. doi: 10.1001/jama.2017.18948. JAMA. 2017. PMID: 29279908 No abstract available.
-
Air Pollution and Mortality in the Medicare Population.JAMA. 2018 May 22;319(20):2134-2135. doi: 10.1001/jama.2018.3923. JAMA. 2018. PMID: 29800166 No abstract available.
-
Air Pollution and Mortality in the Medicare Population.JAMA. 2018 May 22;319(20):2135. doi: 10.1001/jama.2018.3927. JAMA. 2018. PMID: 29800167 No abstract available.
-
Air Pollution and Mortality in the Medicare Population.JAMA. 2018 May 22;319(20):2133-2134. doi: 10.1001/jama.2018.3939. JAMA. 2018. PMID: 29800168 No abstract available.
References
-
- U.S. Environmental Protection Agency. Process of Reviewing the National Ambient Air Quality Standards. 2017 https://www.epa.gov/criteria-air-pollutants/process-reviewing-national-a.... Accessed Nov 1, 2017.
-
- U.S. Environmental Protection Agency. Integrated Review Plan for the National Ambient Air Quality Standards for Particulate Matter. 2016 https://www3.epa.gov/ttn/naaqs/standards/pm/data/201612-final-integrated.... Accessed May 30, 2017.
Publication types
MeSH terms
Substances
Grants and funding
LinkOut - more resources
Full Text Sources
Other Literature Sources
Medical
Miscellaneous
