. 2018 Feb;26(2):310-317.
doi: 10.1002/oby.22090. Epub 2017 Dec 27.

Tissue Sodium Content is Elevated in the Skin and Subcutaneous Adipose Tissue in Women with Lipedema

Affiliations

Tissue Sodium Content is Elevated in the Skin and Subcutaneous Adipose Tissue in Women with Lipedema

Rachelle Crescenzi et al. Obesity (Silver Spring). 2018 Feb.

Abstract

Objective: To test the hypothesis that tissue sodium and adipose content are elevated in patients with lipedema; if confirmed, this could establish precedence for tissue sodium and adipose content representing a discriminatory biomarker for lipedema.

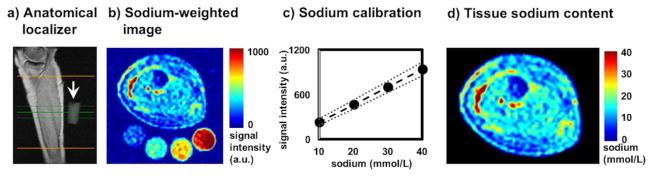
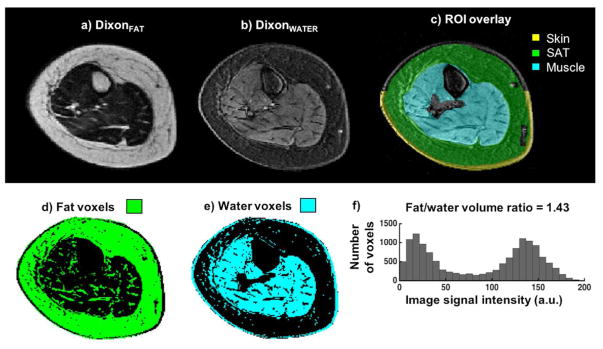
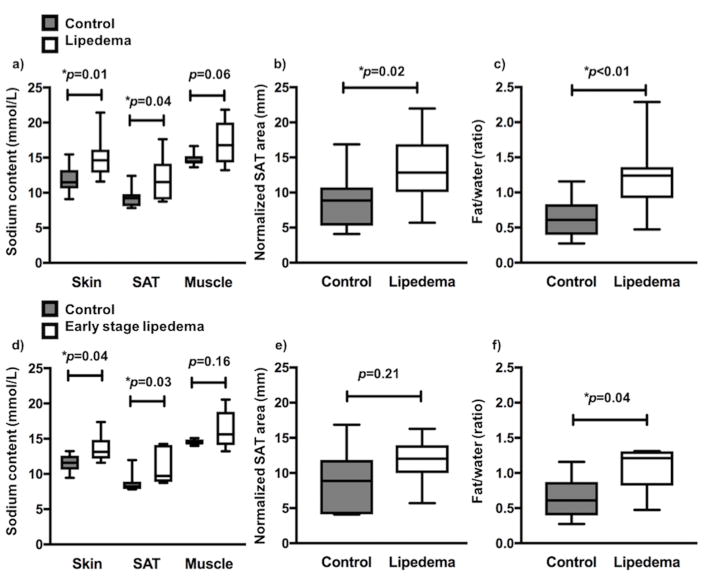
Methods: Participants with lipedema (n = 10) and control (n = 11) volunteers matched for biological sex, age, BMI, and calf circumference were scanned with 3.0-T sodium and conventional proton magnetic resonance imaging (MRI). Standardized tissue sodium content was quantified in the calf skin, subcutaneous adipose tissue (SAT), and muscle. Dixon MRI was employed to quantify tissue fat and water volumes of the calf. Nonparametric statistical tests were applied to compare regional sodium content and fat-to-water volume between groups (significance: two-sided P ≤ 0.05).

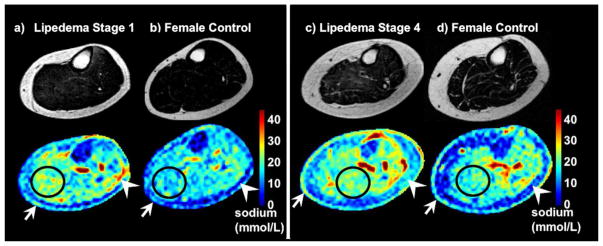
Results: Skin (P = 0.01) and SAT (P = 0.04) sodium content were elevated in lipedema (skin: 14.9 ± 2.9 mmol/L; SAT: 11.9 ± 3.1 mmol/L) relative to control participants (skin: 11.9 ± 2.0 mmol/L; SAT: 9.4 ± 1.6 mmol/L). Relative fat-to-water volume in the calf was elevated in lipedema (1.2 ± 0.48 ratio) relative to control participants (0.63 ± 0.26 ratio; P < 0.001). Skin sodium content was directly correlated with fat-to-water volume (Spearman's rho = 0.54; P = 0.01).

Conclusions: Internal metrics of tissue sodium and adipose content are elevated in patients with lipedema, potentially providing objective imaging-based biomarkers for differentially diagnosing the under-recognized condition of lipedema from obesity.


Conflict of interest statement

Disclosure: The authors have no conflicts of interest to disclose.

Figures

Figure 1
Figure 1
Sodium MRI and analysis of tissue sodium content. a) Sagittal anatomical image for localization of the calf showing standard sodium solutions below the calf (white arrow). The outer green lines signify the sodium slice thickness (3 cm) and the central green line corresponds to the center of the sodium slice. b) Transverse sodium image (magnitude of sodium signal intensity, arbitrary units, a.u.) with standards below (concentrations from left to right are 10, 20, 30, 40 mmol/L). c) Sodium image signal intensity (a.u.) in the standard solutions has a linear relationship with known sodium concentrations (mmol/L). The graph represents the mean slope from all subjects’ data (23.7, standard deviation=4.7) and the dotted lines represent the 95% confidence intervals of the slope (upper 25.4, lower 22.0) based on the standard error of the mean (0.88). d) Each subject’s sodium image is calibrated individually, and applied voxel-wise to produce a quantitative map of tissue sodium content (mmol/L).
Figure 2
Figure 2
Anatomical images used for segmentation of regions of interest and analysis of fat tissue content. a–b) Example fat-weighted (DixonFAT) and water-weighted (DixonWATER) images. c) ROIs were segmented manually from the DixonWATER image, including the skin and total muscle; the subcutaneous adipose tissue (SAT) region was defined as the area between the inner border of the skin and the outer border of the muscle. The bone and large blood vessels were removed from all ROIs. d–e) Colored masks represent the voxels containing fat or water defined above or below a threshold of the DixonFAT image. f) A histogram of the DixonFAT image shows two distinct compartments; a k-means clustering algorithm was used to set a threshold between higher and lower signal intensity compartments corresponding to fat and water tissue, respectively. The fat/water volume ratio was calculated as a ratio of the number of voxels within each tissue.
Figure 3
Figure 3
Group results of a) tissue sodium content (mmol/L) in the skin, subcutaneous adipose tissue (SAT), and muscle regions; b) SAT area (mm2) normalized by calf circumference (mm) has units of mm; and c) tissue composition in terms of fat/water volume ratio. d–f) These trends and significant differences in the skin and SAT are observed in a subset of patients with early stages of lipedema (Stages 1 or 2). Significant group differences (*p≤0.05, two-sided) were determined by a Mann-Whitney test.
Figure 4
Figure 4
The DixonFAT image (top row) and corresponding map of tissue sodium content (bottom row) in patients with lipedema adjacent to matched female controls. a) A patient with Stage 1 lipedema is 37 years old and has a BMI of 21.3 kg/m2. She is similar in age, race, and BMI to the female control (b) who is 33 years old with a BMI of 23.8 kg/m2. Structural measures of calf circumference and subcutaneous adipose tissue (SAT) area are also similar (lipedema vs. control values, calf circumference 36.8 vs. 37.2 cm, normalized SAT area 5.7 vs. 5.4 mm). However, the tissue sodium content is higher in the skin (14.4 vs. 9.1 mmol/L, arrow), SAT (14.1 vs. 9.2 mmol/L, arrowhead) and muscle (17.9 vs. 13.6 mmol/L, circle). The fat/water volume ratio in the calf is also greater (0.47 vs. 0.35 ratio). c–d) A patient with Stage 4 lipedema is 55 years old and has a BMI of 37.2 kg/m2. She is similar in age, race, and BMI to the female control who is 49 years old with a BMI of 36.4 kg/m2. Structural measures of calf circumference and SAT area are also similar (lipedema vs. control values, calf circumference 41.0 vs. 41.6 cm, normalized SAT area 11.2 vs. 11.8 mm). The tissue sodium content is higher in the patient with lipedema in all regions, including skin (15.7 vs. 12.6 mmol/L, arrow), SAT (13.3 vs. 8.2 mmol/L, arrowhead), and muscle (19.8 vs. 14.3 mmol/L, circle). The fat/water volume ratio in the calf is also higher (0.95 vs. 0.87 ratio) in the patient with lipedema compared to the matched female control.

Similar articles

Cited by

References

    1. Herbst KL. Rare adipose disorders (RADs) masquerading as obesity. Acta Pharmacologica Sinica. 2012;33(2):155–172. - PMC - PubMed
    1. Fife CE, Maus EA, Carter MJ. Lipedema: a frequently misdiagnosed and misunderstood fatty deposition syndrome. Adv Skin Wound Care. 2010;23(2):81–92. - PubMed
    1. Lontok E, Briggs L, Donlan M, Kim Y, Mosley E, Riley EAU, Stevens M. Lipedema: A Giving Smarter Guide. A publication of the Milken Institute Center for Strategic Philanthropy. 2017:1–40.
    1. Peled AW, Kappos EA. Lipedema: diagnostic and management challenges. Int J Womens Health. 2016;8:389–95. - PMC - PubMed
    1. Lohrmann C, Foeldi E, Langer M. MR imaging of the lymphatic system in patients with lipedema and lipo-lymphedema. Microvasc Res. 2009;77(3):335–9. - PubMed

Publication types

LinkOut - more resources