. 2018 Apr;57(4):536-548.
doi: 10.1002/mc.22778. Epub 2018 Jan 25.

Suppression of STAT3 NH2 -terminal domain chemosensitizes medulloblastoma cells by activation of protein inhibitor of activated STAT3 via de-repression by microRNA-21

Affiliations

Suppression of STAT3 NH2 -terminal domain chemosensitizes medulloblastoma cells by activation of protein inhibitor of activated STAT3 via de-repression by microRNA-21

Sutapa Ray et al. Mol Carcinog. 2018 Apr.

Abstract

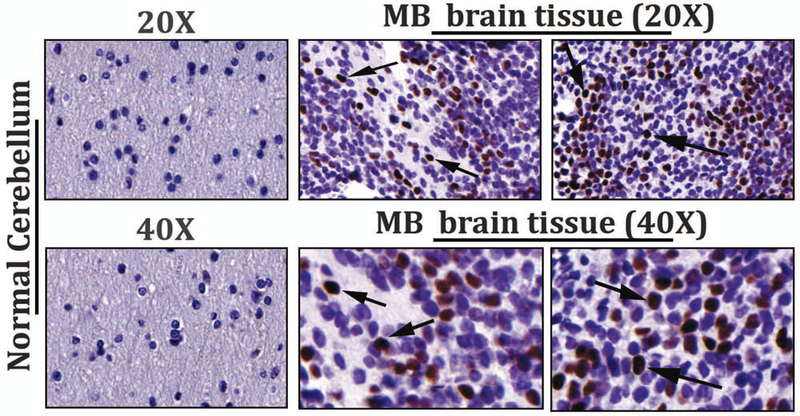
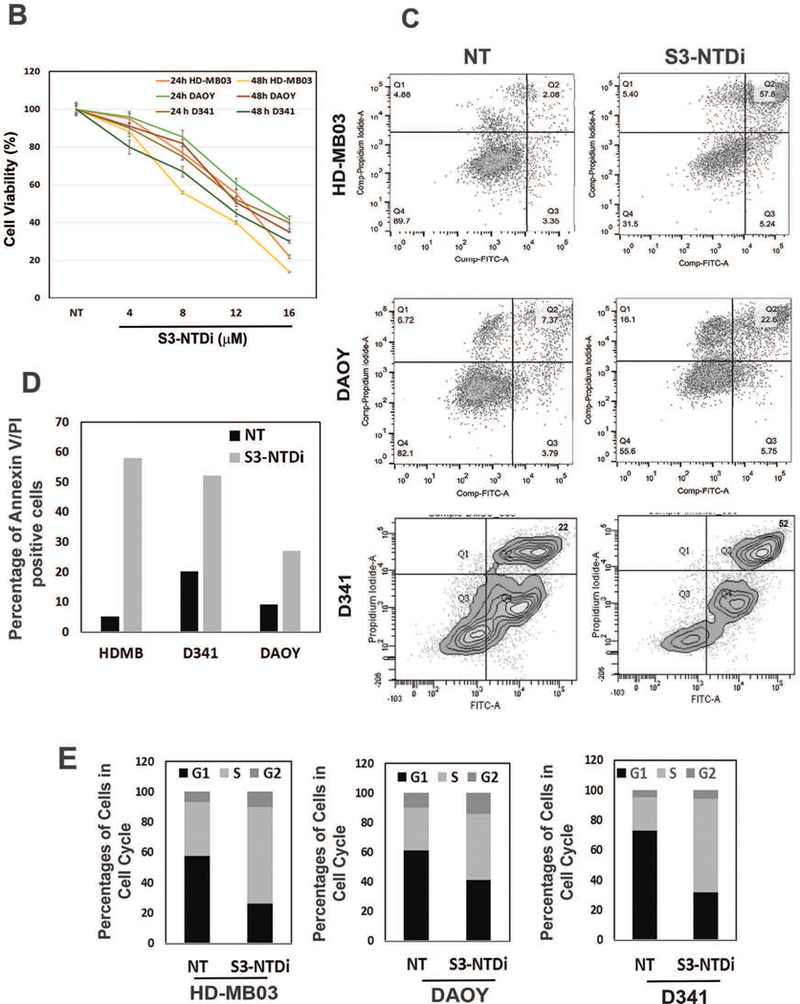
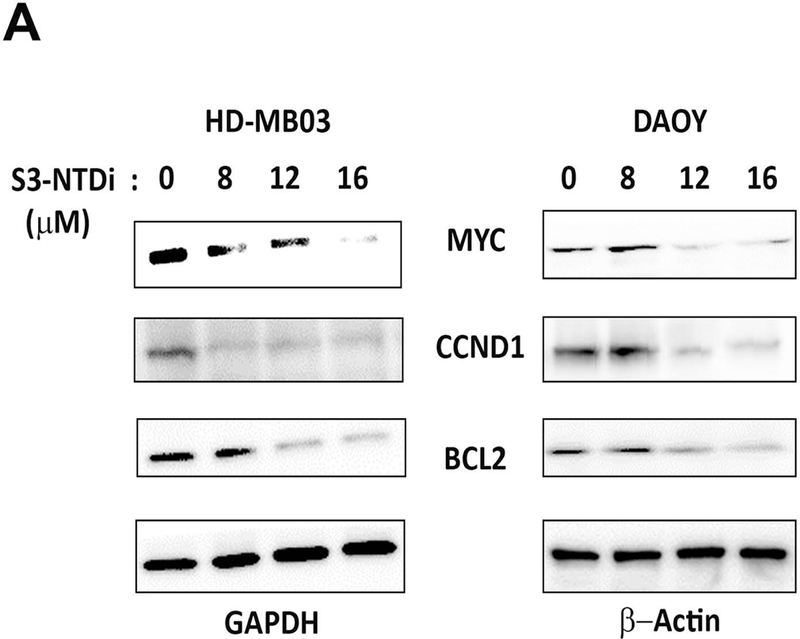
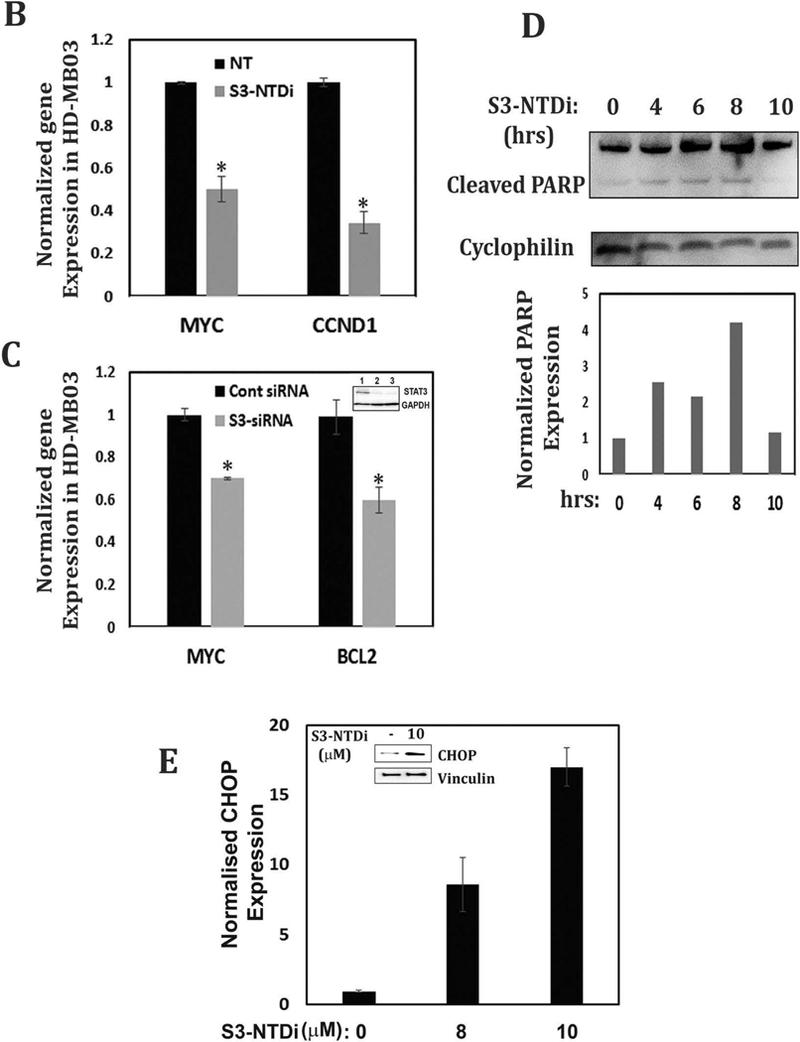
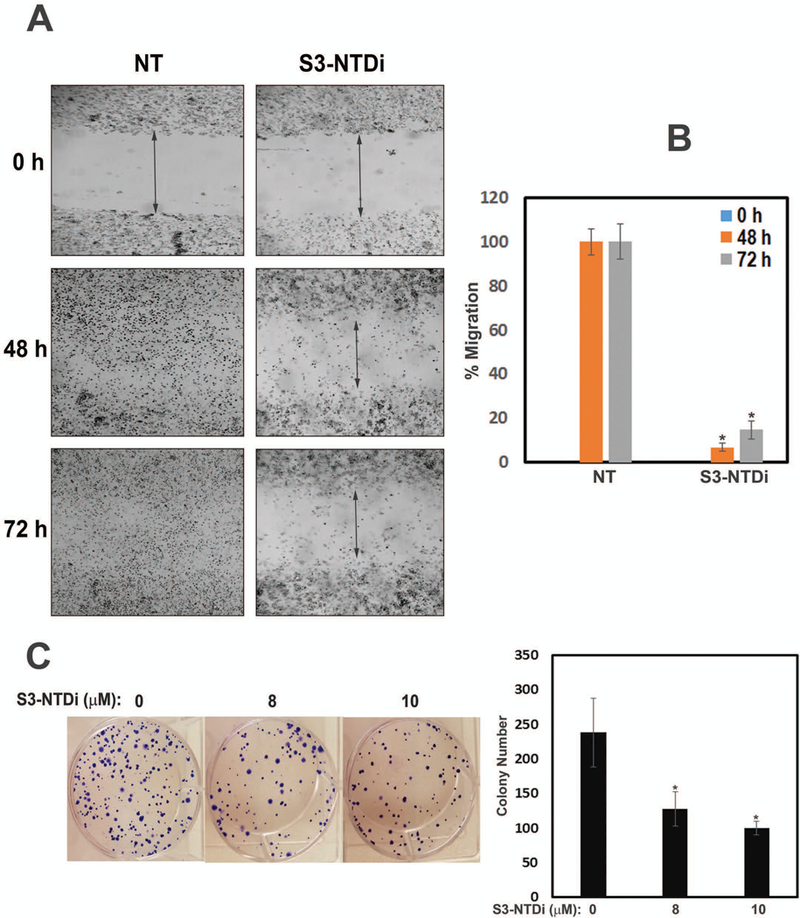
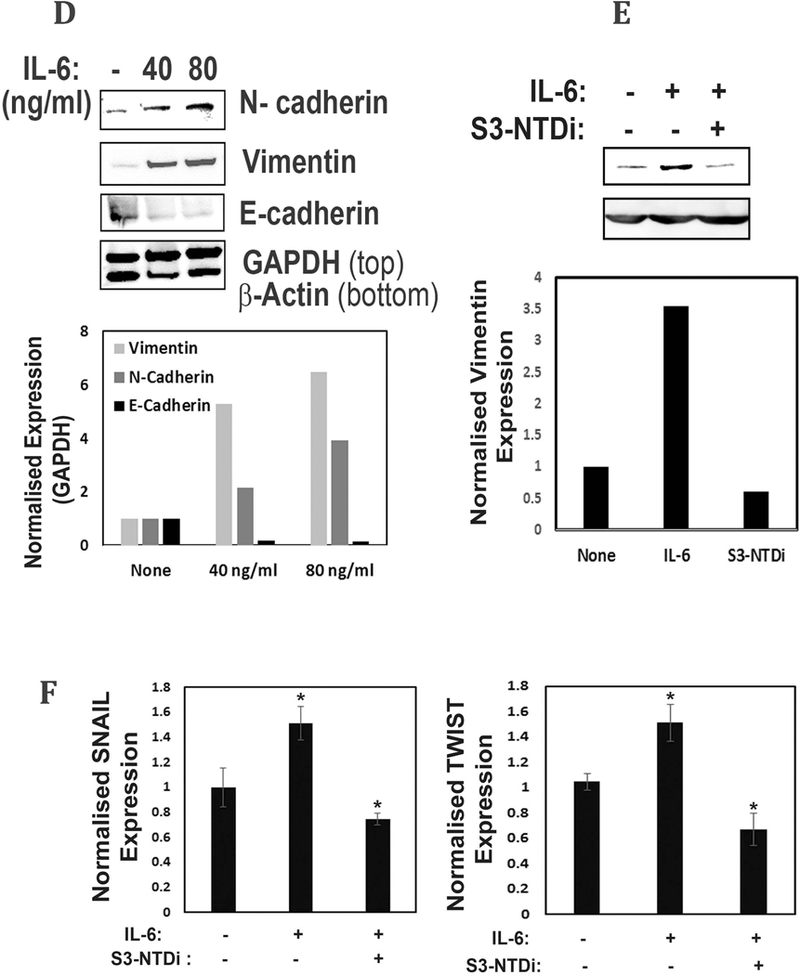
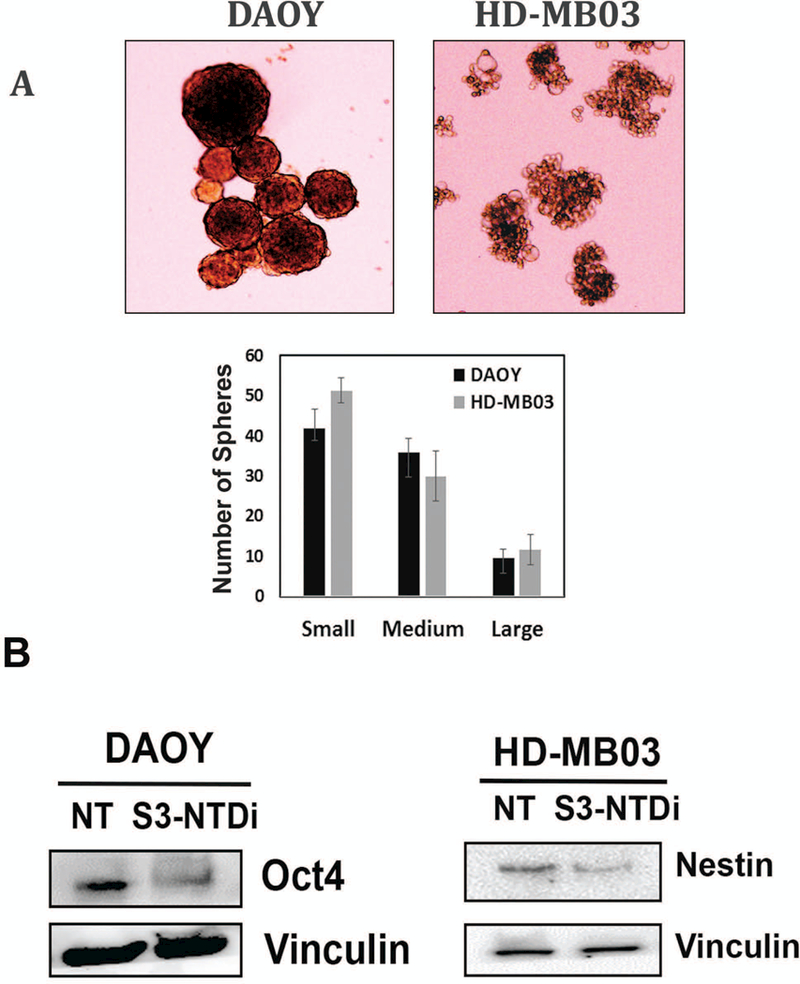
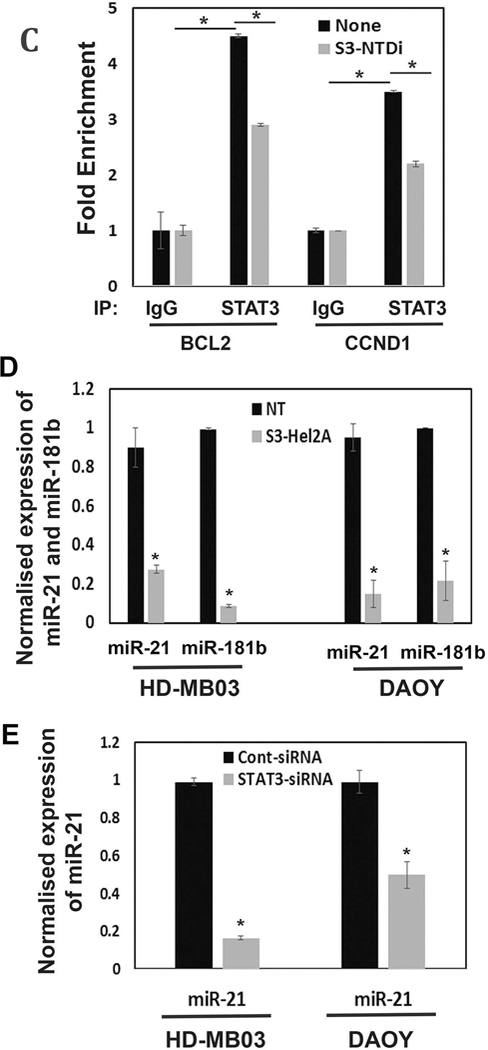
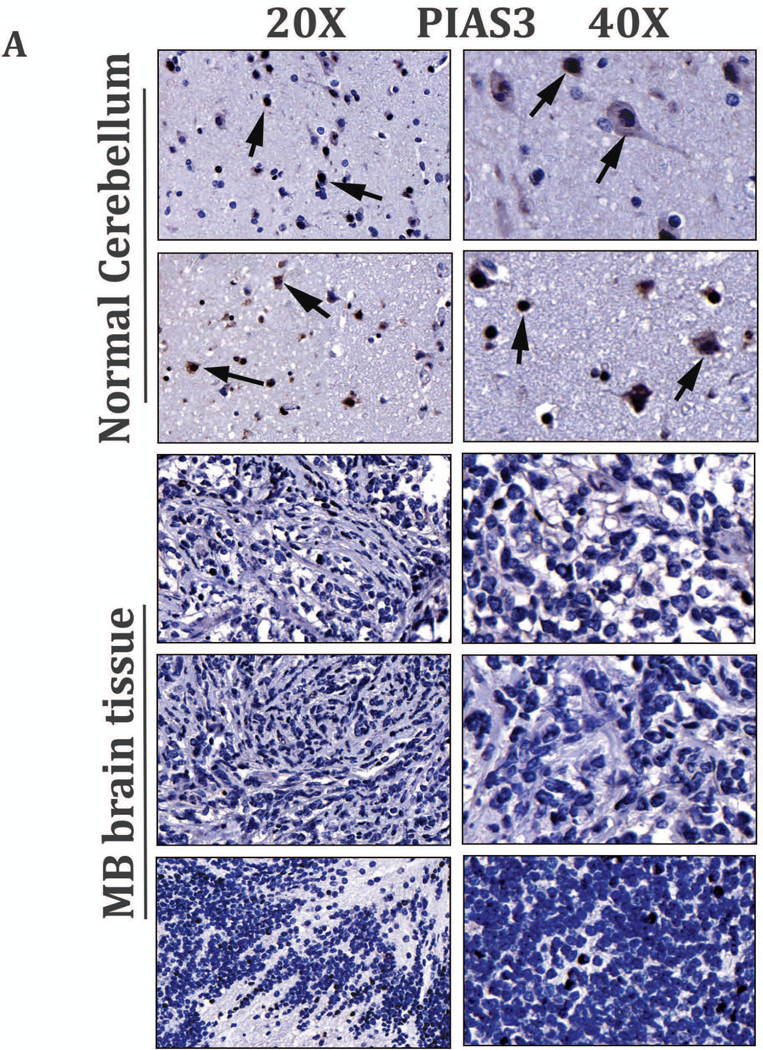
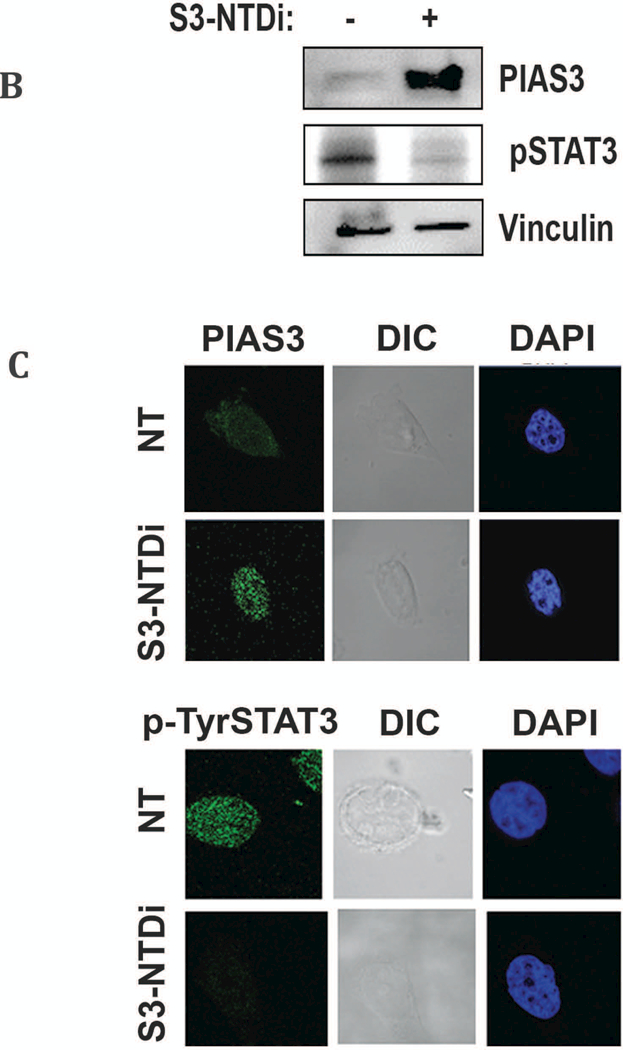
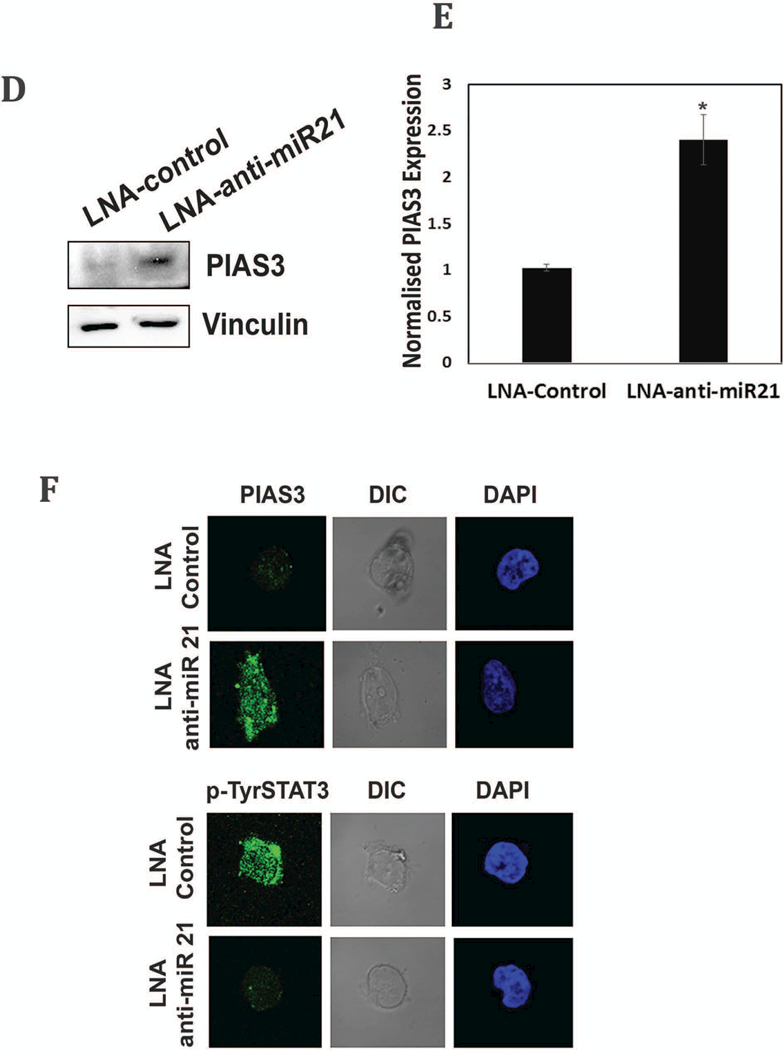
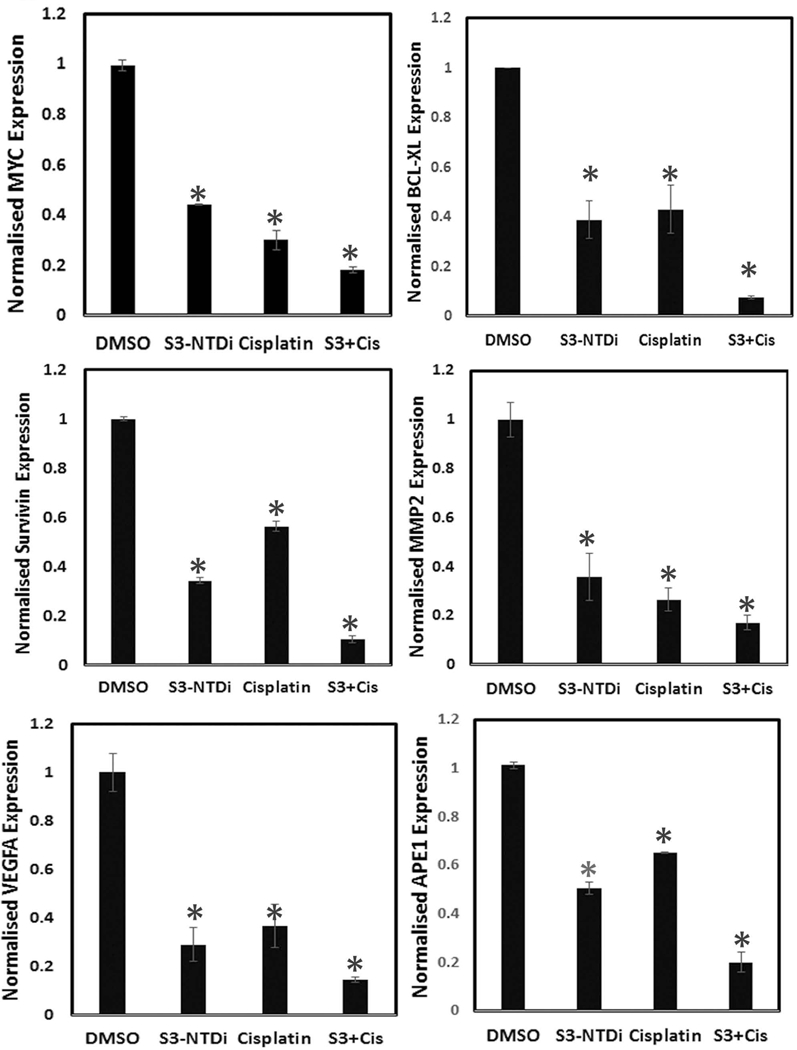
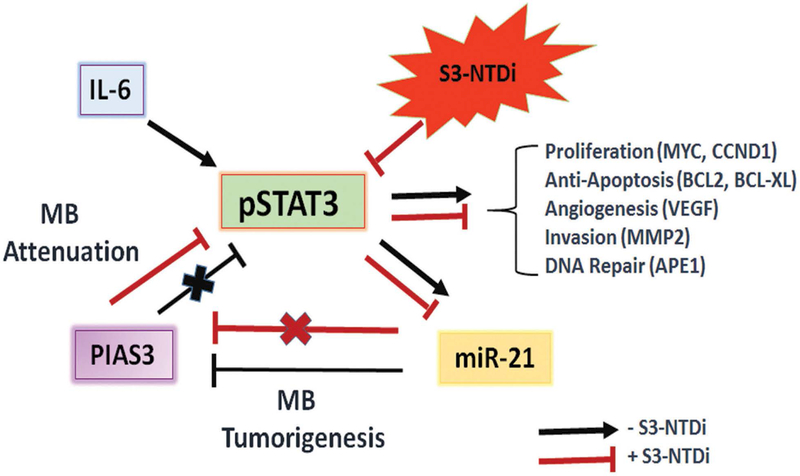
Medulloblastoma (MB) is a malignant pediatric brain tumor with poor prognosis. Signal transducers and activators of transcription-3 (STAT3) is constitutively activated in MB where it functions as an oncoprotein, mediating cancer progression and metastasis. Here, we have delineated the functional role of activated STAT3 in MB, by using a cell permeable STAT3-NH2 terminal domain inhibitor (S3-NTDi) that specifically perturbs the structure/function of STAT3. We have implemented several biochemical experiments using human MB tumor microarray (TMA) and pediatric MB cell lines, derived from high-risk SHH-TP53-mutated and MYC-amplified Non-WNT/SHH tumors. Treatment of MB cells with S3-NTDi leads to growth inhibition, cell cycle arrest, and apoptosis. S3-NTDi downregulated expression of STAT3 target genes, delayed migration of MB cells, attenuated epithelial-mesenchymal transition (EMT) marker expressions and reduced cancer stem-cell associated protein expressions in MB-spheres. To elucidate mechanisms, we showed that S3-NTDi induce expression of pro-apoptotic gene, C/EBP-homologous protein (CHOP), and decrease association of STAT3 to the proximal promoter of CCND1 and BCL2. Of note, S3-NTDi downregulated microRNA-21, which in turn, de-repressed Protein Inhibitor of Activated STAT3 (PIAS3), a negative regulator of STAT3 signaling pathway. Furthermore, combination therapy with S3-NTDi and cisplatin significantly decreased highly aggressive MYC-amplified MB cell growth and induced apoptosis by downregulating STAT3 regulated proliferation and anti-apoptotic gene expression. Together, our results revealed an important role of STAT3 in regulating MB pathogenesis. Disruption of this pathway with S3-NTDi, therefore, may serves as a promising candidate for targeted MB therapy by enhancing chemosensitivity of MB cells and potentially improving outcomes in high-risk patients.

Keywords: MYC; PIAS3; STAT3; medulloblastoma; miR-21.


Figures

Figure 1.
Figure 1.
Effects of S3-NTDi on MB cell viability, apoptosis and cell cycle. (A) Representative images of pSTAT3 expression in MB tumor microarrays (TMA), performed by immunohistochemical staining (IHC) staining with p-Tyr705 STAT3 Ab (Cell Signaling, # 9145). Normal cerebellar tissues (20X, top left and 40X, bottom left) and MB tumors (20X, top and 40X, bottom) are shown. Arrowheads show the strong nuclear staining for activated STAT3. (B) MB cell line, DAOY, HD-MB03 and D341 treated either with S3-NTDi at a concentration of 4, 8, 12 and 16 μM or left untreated (NT: non-treated vehicle control). The growth of these cells was determined at 24 and 48 hours using MTT assays. The average absorbance of NT control was regressed against the concentration of the inhibitor and thus allowed us to calculate IC50 for S3-NTDi. The values represent the means ± SD from five wells of a 96-well plates. (C) Each MB cell lines were treated with S3-NTDi at a concentration of 10 μM for overnight. The percentage of cells undergoing apoptosis was determined using annexin-V-FITC apoptosis detection kit. Figure shows representative scatter diagram for the apoptotic cells. NT: non-treated control. (D) Quantification of the apoptotic cells (% Annexin-V/PI double positive) from one of three independent experiments following treatment with S3-NTDi in MB cells were shown. (E) MB cells were treated with 10 μM of S3-NTDi for overnight and cell cycle analysis was performed by labeling cells with PI followed by flow cytometry. The percentage of MB cell populations in the G1, G2, and S phases of cell cycle are shown in the bar diagram. NT: non-treated control.
Figure 1.
Figure 1.
Effects of S3-NTDi on MB cell viability, apoptosis and cell cycle. (A) Representative images of pSTAT3 expression in MB tumor microarrays (TMA), performed by immunohistochemical staining (IHC) staining with p-Tyr705 STAT3 Ab (Cell Signaling, # 9145). Normal cerebellar tissues (20X, top left and 40X, bottom left) and MB tumors (20X, top and 40X, bottom) are shown. Arrowheads show the strong nuclear staining for activated STAT3. (B) MB cell line, DAOY, HD-MB03 and D341 treated either with S3-NTDi at a concentration of 4, 8, 12 and 16 μM or left untreated (NT: non-treated vehicle control). The growth of these cells was determined at 24 and 48 hours using MTT assays. The average absorbance of NT control was regressed against the concentration of the inhibitor and thus allowed us to calculate IC50 for S3-NTDi. The values represent the means ± SD from five wells of a 96-well plates. (C) Each MB cell lines were treated with S3-NTDi at a concentration of 10 μM for overnight. The percentage of cells undergoing apoptosis was determined using annexin-V-FITC apoptosis detection kit. Figure shows representative scatter diagram for the apoptotic cells. NT: non-treated control. (D) Quantification of the apoptotic cells (% Annexin-V/PI double positive) from one of three independent experiments following treatment with S3-NTDi in MB cells were shown. (E) MB cells were treated with 10 μM of S3-NTDi for overnight and cell cycle analysis was performed by labeling cells with PI followed by flow cytometry. The percentage of MB cell populations in the G1, G2, and S phases of cell cycle are shown in the bar diagram. NT: non-treated control.
Figure 2.
Figure 2.
S3-NTDi downregulates expression of STAT3 target genes. (A) HD-MB03 and DAOY cells were treated with increasing concentrations of S3-NTDi (0, 8, 12 and 16 μM) for 24 h. Cells were stimulated with IL-6/sIL-6Rα (50/25 ng/ml) for 20 mins prior to making whole cell extracts (WCE). Expression of MYC, CCND1 and BCl2 were analyzed by Western immunoblot analysis and GAPDH and β-Actin were used as a loading control. (B) HD-MB03 cells were treated with 10 μM S3-NTDi for overnight or left untreated. Cells were stimulated with IL-6/sIL-6Rα for 20 mins prior to harvest. STAT3 regulated gene expressions were analyzed by qRT-PCR. * represents p<0.001, NT: non-treated control. (C) STAT3 activity is knockdown by 75 nM siRNA (SMARTpool) in HD-MB03 cells for 72 h (inset figure) and STAT3 regulated gene expressions was analyzed by qRT-PCR. * represents p<0.005. (D) Expression of PARP cleavage in HD-MB03 cells, treated with 10 μM of S3-NTDi for 0, 4, 6, 8 and 10 h are shown by Western blot. Intensity of cleaved PARP is shown in bar diagram (bottom). (E) HD-MB03 cells were treated with 0, 8 and 10 μM of S3-NTDi overnight. Total RNA isolated from these cells was subjected to qRT-PCR for CHOP expression. The inset figure shows Western blot of CHOP expression. * represents p<0.001.
Figure 2.
Figure 2.
S3-NTDi downregulates expression of STAT3 target genes. (A) HD-MB03 and DAOY cells were treated with increasing concentrations of S3-NTDi (0, 8, 12 and 16 μM) for 24 h. Cells were stimulated with IL-6/sIL-6Rα (50/25 ng/ml) for 20 mins prior to making whole cell extracts (WCE). Expression of MYC, CCND1 and BCl2 were analyzed by Western immunoblot analysis and GAPDH and β-Actin were used as a loading control. (B) HD-MB03 cells were treated with 10 μM S3-NTDi for overnight or left untreated. Cells were stimulated with IL-6/sIL-6Rα for 20 mins prior to harvest. STAT3 regulated gene expressions were analyzed by qRT-PCR. * represents p<0.001, NT: non-treated control. (C) STAT3 activity is knockdown by 75 nM siRNA (SMARTpool) in HD-MB03 cells for 72 h (inset figure) and STAT3 regulated gene expressions was analyzed by qRT-PCR. * represents p<0.005. (D) Expression of PARP cleavage in HD-MB03 cells, treated with 10 μM of S3-NTDi for 0, 4, 6, 8 and 10 h are shown by Western blot. Intensity of cleaved PARP is shown in bar diagram (bottom). (E) HD-MB03 cells were treated with 0, 8 and 10 μM of S3-NTDi overnight. Total RNA isolated from these cells was subjected to qRT-PCR for CHOP expression. The inset figure shows Western blot of CHOP expression. * represents p<0.001.
Figure 3.
Figure 3.
S3-NTDi inhibits MB cell migration, reduced colony formation and IL-6 mediated EMT. (A) Wound healing assays performed by seeding HD-MB03 cells into CytoSelect™ 24-Well assay plates (Cell Biolabs Inc) until a monolayer formed, at which time the inserts were removed and a cell-free gap (0.9mm) is created in which the cell migration was analyzed either in presence of vehicle or 10 μM S3-NTDi. Images of cell migration were taken after every 12 h for 72 h. Representative images taken at 0, 48 and 72 h are shown. NT: non-treated control. (B) The percentage of cells migrated to fill the gap area were calculated according to the manufacture’s instruction. Percent migration is shown in bar diagram. NT: non-treated control, * represents p<0.001 (C) HD-MB03 cells were treated with either 0, 8 or 10 μM S3-NTDi for 8h. Equal numbers of cells were reseeded in 6-well plates and allowed to grow for 2 weeks in normal media. Colonies formed from single cell were fixed with acetic acid/methanol 1:7 (vol/vol) and stained with 0.5% crystal violet solution. Number of colonies counted from three independent experiments is shown in bar diagram (right). * represents p<0.005. (D) HD-MB03 cells were treated with either 0, 40/20 ng/ml of IL-6/sIL-6Rα or 80/40 ng/ml of IL-6/sIL-6Rα and WCE were subjected to Western immunoblots with N-cadherin, Vimentin and E-cadherin Ab. GAPDH and β-Actin were used as a loading control. Bar diagram below shows the quantitation of normalized expression of the proteins. (E) HD-MB03 cells were treated with or without 10 μM S3-NTDi along with 80/40 ng/ml of IL-6/sIL-6Rα for overnight. WCE were then subjected to Western immunoblot with Vimentin Ab. Vinculin was used as loading control. Below shows the band intensity of vimentin normalized with Vinculin. (F) HD-MB03 cells were either treated with10 μM S3-NTDi or left untreated in the presence of IL-6/sIL-6Rα (40/20 ng/ml) for overnight. EMT related transcription factor expressions were measured by qRT-PCR. * represents p<0.005.
Figure 3.
Figure 3.
S3-NTDi inhibits MB cell migration, reduced colony formation and IL-6 mediated EMT. (A) Wound healing assays performed by seeding HD-MB03 cells into CytoSelect™ 24-Well assay plates (Cell Biolabs Inc) until a monolayer formed, at which time the inserts were removed and a cell-free gap (0.9mm) is created in which the cell migration was analyzed either in presence of vehicle or 10 μM S3-NTDi. Images of cell migration were taken after every 12 h for 72 h. Representative images taken at 0, 48 and 72 h are shown. NT: non-treated control. (B) The percentage of cells migrated to fill the gap area were calculated according to the manufacture’s instruction. Percent migration is shown in bar diagram. NT: non-treated control, * represents p<0.001 (C) HD-MB03 cells were treated with either 0, 8 or 10 μM S3-NTDi for 8h. Equal numbers of cells were reseeded in 6-well plates and allowed to grow for 2 weeks in normal media. Colonies formed from single cell were fixed with acetic acid/methanol 1:7 (vol/vol) and stained with 0.5% crystal violet solution. Number of colonies counted from three independent experiments is shown in bar diagram (right). * represents p<0.005. (D) HD-MB03 cells were treated with either 0, 40/20 ng/ml of IL-6/sIL-6Rα or 80/40 ng/ml of IL-6/sIL-6Rα and WCE were subjected to Western immunoblots with N-cadherin, Vimentin and E-cadherin Ab. GAPDH and β-Actin were used as a loading control. Bar diagram below shows the quantitation of normalized expression of the proteins. (E) HD-MB03 cells were treated with or without 10 μM S3-NTDi along with 80/40 ng/ml of IL-6/sIL-6Rα for overnight. WCE were then subjected to Western immunoblot with Vimentin Ab. Vinculin was used as loading control. Below shows the band intensity of vimentin normalized with Vinculin. (F) HD-MB03 cells were either treated with10 μM S3-NTDi or left untreated in the presence of IL-6/sIL-6Rα (40/20 ng/ml) for overnight. EMT related transcription factor expressions were measured by qRT-PCR. * represents p<0.005.
Figure 4.
Figure 4.
Effect of S3-NTDi on MB-spheres formation, STAT3 target gene promoter binding and miR-21 expression. (A) Representative morphology of MB-spheres from DAOY and HD-MB03 cells grown in serum free media are shown. Small, medium and large spheres from DAOY and HD-MB03 were enumerated and sizes measured and are shown below. (B) DAOY and HD-MB03 MB-spheres were treated with 10 μM S3-NTDi for 24h and Western blot analyses for OCT4 and Nestin expression were analyzed respectively. Vinculin was used as a loading control. NT: non-treated control (C) HD-MB03 cells were treated with10μM S3-NTDi overnight and then treated with IL-6/sIL-6Rα for 20min, prior to protein-protein and protein-DNA crosslinking. STAT3 binding to the BCL2 and CCND1 gene promoters in HD-MB03 cells was demonstrated by ChIP-qPCR. IgG Ab were used as a negative control. SimpleChIP® Human Bcl-2 Promoter Primers (# 12924) and SimpleChIP® Human CCND1 Promoter Primers (#12531) purchased from cell signaling, were used for quantitative genomic PCR. * represents p≤0.005; t-test. (D) HD-MB03 and DAOY cells were either treated with 10 μM S3-NTDi for overnight, or left untreated. Cells were stimulated with IL-6/sIL-6α for 20 mins prior to harvesting miRNAs. Expression of miR-21 and miR-181b were measured by qRT-PCR. NT: non-treated control and * represents p≤0.001 (E) Expression of miR-21 in HD-MB03 and DAOY in the presence of either control siRNA or STAT3 siRNA was measured by qRT-PCR. * represents p≤0.001, t-test.
Figure 4.
Figure 4.
Effect of S3-NTDi on MB-spheres formation, STAT3 target gene promoter binding and miR-21 expression. (A) Representative morphology of MB-spheres from DAOY and HD-MB03 cells grown in serum free media are shown. Small, medium and large spheres from DAOY and HD-MB03 were enumerated and sizes measured and are shown below. (B) DAOY and HD-MB03 MB-spheres were treated with 10 μM S3-NTDi for 24h and Western blot analyses for OCT4 and Nestin expression were analyzed respectively. Vinculin was used as a loading control. NT: non-treated control (C) HD-MB03 cells were treated with10μM S3-NTDi overnight and then treated with IL-6/sIL-6Rα for 20min, prior to protein-protein and protein-DNA crosslinking. STAT3 binding to the BCL2 and CCND1 gene promoters in HD-MB03 cells was demonstrated by ChIP-qPCR. IgG Ab were used as a negative control. SimpleChIP® Human Bcl-2 Promoter Primers (# 12924) and SimpleChIP® Human CCND1 Promoter Primers (#12531) purchased from cell signaling, were used for quantitative genomic PCR. * represents p≤0.005; t-test. (D) HD-MB03 and DAOY cells were either treated with 10 μM S3-NTDi for overnight, or left untreated. Cells were stimulated with IL-6/sIL-6α for 20 mins prior to harvesting miRNAs. Expression of miR-21 and miR-181b were measured by qRT-PCR. NT: non-treated control and * represents p≤0.001 (E) Expression of miR-21 in HD-MB03 and DAOY in the presence of either control siRNA or STAT3 siRNA was measured by qRT-PCR. * represents p≤0.001, t-test.
Figure 5.
Figure 5.
Activation of PIAS3 by S3-NTDi treatment via inhibition of miR-21. (A) Representative images of PIAS3 expression in MB tumor microarray (TMA) were performed by IHC staining with PIAS3 Ab (Abcam, # ab58406). Normal cerebellar tissues (two rows from top, 20X on left and 40X on right) and MB tumors (rows 3–5 from top, 20X, left, top and 40X, right) are shown. Arrowheads show the nuclear staining for PIAS3. (B) Expression of PIAS3 and pSTAT3 in HD-MB03 following treatment of 10 μM S3-NTDi for 24 h are shown by Western blot. Vinculin used as loading control. (C) Expression of PIAS3 (top panel) and p-Tyr705 STAT3 (bottom panel) in HD-MB03 in the presence of 10 μM S3-NTDi is shown by confocal microscopy. NT: non-treated control. (D) HD-MB03 cells were treated either with LNA-control or LNA-anti-miR-21 oligonucleotides (50 nM). PIAS3 expression was detected after 72 h by Western blot and (E) by qRT-PCR. *p<0.001. (F) Expression of PIAS3 (top panel) and p-Tyr705 STAT3 (bottom panel) in HD-MB03 cells in the presence of either LNA-control or LNA-anti-miR-21 is shown by confocal microscopy.
Figure 5.
Figure 5.
Activation of PIAS3 by S3-NTDi treatment via inhibition of miR-21. (A) Representative images of PIAS3 expression in MB tumor microarray (TMA) were performed by IHC staining with PIAS3 Ab (Abcam, # ab58406). Normal cerebellar tissues (two rows from top, 20X on left and 40X on right) and MB tumors (rows 3–5 from top, 20X, left, top and 40X, right) are shown. Arrowheads show the nuclear staining for PIAS3. (B) Expression of PIAS3 and pSTAT3 in HD-MB03 following treatment of 10 μM S3-NTDi for 24 h are shown by Western blot. Vinculin used as loading control. (C) Expression of PIAS3 (top panel) and p-Tyr705 STAT3 (bottom panel) in HD-MB03 in the presence of 10 μM S3-NTDi is shown by confocal microscopy. NT: non-treated control. (D) HD-MB03 cells were treated either with LNA-control or LNA-anti-miR-21 oligonucleotides (50 nM). PIAS3 expression was detected after 72 h by Western blot and (E) by qRT-PCR. *p<0.001. (F) Expression of PIAS3 (top panel) and p-Tyr705 STAT3 (bottom panel) in HD-MB03 cells in the presence of either LNA-control or LNA-anti-miR-21 is shown by confocal microscopy.
Figure 6.
Figure 6.
S3-NTDi confers MB cells sensitive to chemotherapy. (A) A representative bar graph shows HD-MB03 cell viability in the presence of either S3-NTDi or cisplatin alone or in combination, at specified concentrations for 24 and (B) 48 h by MTT assay. (C) Representative scatter diagram for the apoptotic cell analyses in HD-MB03, following treatment of either S3-NTDi (12 μM) or cisplatin (2.5 μM) alone or in combination for 24h. NT: non-treated control. (D) STAT3 target gene expression (as mentioned in the figure) were analyzed in HD-MB03 by qRT-PCR either in the presence of S3-NTDi (12 μM) or cisplatin (2.5 μM) alone or in combination. * represents p≤0.005, t-test. NT: non-treated control. (E) Schematic diagram of STAT3 mediated MB pathogenesis. IL6 stimulated pSTAT3 activation in MB upregulates STAT3 target genes that control proliferation, anti-apoptosis, invasion and angiogenesis. STAT3 also directly induces miR-21, which in turn represses PIAS3, a cellular STAT3 inhibitor, forming a positive feedback loop. S3-NTDi downregulates miR-21 expression, thereby activating PIAS3 which negatively regulates activated STAT3 signaling and attenuating MB tumorigenesis.
Figure 6.
Figure 6.
S3-NTDi confers MB cells sensitive to chemotherapy. (A) A representative bar graph shows HD-MB03 cell viability in the presence of either S3-NTDi or cisplatin alone or in combination, at specified concentrations for 24 and (B) 48 h by MTT assay. (C) Representative scatter diagram for the apoptotic cell analyses in HD-MB03, following treatment of either S3-NTDi (12 μM) or cisplatin (2.5 μM) alone or in combination for 24h. NT: non-treated control. (D) STAT3 target gene expression (as mentioned in the figure) were analyzed in HD-MB03 by qRT-PCR either in the presence of S3-NTDi (12 μM) or cisplatin (2.5 μM) alone or in combination. * represents p≤0.005, t-test. NT: non-treated control. (E) Schematic diagram of STAT3 mediated MB pathogenesis. IL6 stimulated pSTAT3 activation in MB upregulates STAT3 target genes that control proliferation, anti-apoptosis, invasion and angiogenesis. STAT3 also directly induces miR-21, which in turn represses PIAS3, a cellular STAT3 inhibitor, forming a positive feedback loop. S3-NTDi downregulates miR-21 expression, thereby activating PIAS3 which negatively regulates activated STAT3 signaling and attenuating MB tumorigenesis.

Similar articles

Cited by

References

    1. Gilbertson RJ, Ellison DW: The origins of medulloblastoma subtypes. Annu Rev Pathol 2008, 3:341–365. - PubMed
    1. Northcott PA, Jones DT, Kool M, Robinson GW, Gilbertson RJ, Cho YJ, Pomeroy SL, Korshunov A, Lichter P, Taylor MD et al.: Medulloblastomics: the end of the beginning. Nat Rev Cancer 2012, 12(12):818–834. - PMC - PubMed
    1. Dasgupta A, Gupta T, Jalali R: Indian data on central nervous tumors: A summary of published work. South Asian J Cancer 2016, 5(3):147–153. - PMC - PubMed
    1. Bromberg JF: Activation of STAT proteins and growth control. Bioessays 2001, 23(2):161–169. - PubMed
    1. Darnell JE, Jr., Kerr IM, Stark GR: Jak-STAT pathways and transcriptional activation in response to IFNs and other extracellular signaling proteins. Science 1994, 264(5164):1415–1421. - PubMed

Publication types

MeSH terms