. 1989 Feb;413(4):336-42.
doi: 10.1007/BF00584480.

Temporal fluctuations in regional myocardial flows

Affiliations

Temporal fluctuations in regional myocardial flows

R B King et al. Pflugers Arch. 1989 Feb.

Abstract

Considerable spatial heterogeneity has been observed in regional myocardial blood flow in isolated hearts and in both anesthetized and conscious animals. In order to study how local blood flow varies with time, the data obtained by King et al. (1985) from ten awake, healthy baboons were analyzed to estimate the role of temporal fluctuations. Four to six distributions of regional flows were estimated at intervals of 4 min to 27 h, using 15 mu diameter microspheres and dividing each heart into 204 locatable pieces (average piece mass = 0.17 g). The technique averages over the 40 s of the injection giving no measure of fluctuations over a few seconds. The temporal variation in regional blood flow, expressed as the relative dispersion (SD/mean) of the temporally separated measurements about the mean flow for each piece and corrected for methodological noise, was 12% for the whole heart (10828 observations). For the left ventricle, the temporal variation was 10% (8806 observations), for the right ventricle 14% (1455 observations), and for the atria 22% (567 observations). On a relative basis, temporal fluctuation was greatest in regions having low flows. Since the magnitude of the changes in flow distributions was the same after 4 min as it was in several hours, we conclude that much of the "twinkling" is a high frequency phenomenon occurring over seconds to a few minutes. Further, it is concluded that regional myocardial blood flow in conscious primates is relatively stable with time, temporal fluctuations causing only about one third of the variation between regions.


Figures

Fig. 1
Fig. 1
Examples of the variation in local flow estimates from microsphere depositions. Local “instantaneous” flow relative to the local mean flow, fjfj, is plotted versus the local mean flow relative to the whole heart mean, fj. Twelve pieces are shown from the heart of a single animal (no. 8) in each of which six estimates were made over a period of 4 h: three pieces with local mean flows in the range 0.45–0.55 contribute 18 points, five in the range 0.90 – 1.10 give 30 points in the middle group, and four in the range 1.35 – 165 give 24 estimates. The symbol at a given abscissa value represents one tissue sample. (Note: Six measurements are shown for each sample, but some are so close to each other that their symbols overlap)
Fig. 2
Fig. 2
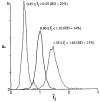
Distributions of flow estimates at three selected flow levels, 0.5, 1.0, and 1.5 times the mean flow in the whole heart. The probability density per unit mean heart flow, P, is plotted versus fj the mean local flow relative to the whole heart mean. Each distribution includes those pieces from the 10 hearts whose fj’s fell within ± 10% of the group mean; the dispersion is a combination of temporal and methodologic variation. The absolute variation in the group with fj ranging between 0.45 and 0.55 is narrower but the relative dispersion (RD) is larger than in the higher flow groups
Fig. 3
Fig. 3
Variations in local flow as a function of local mean flow in the hearts of 10 awake baboons. The tissue sections from all hearts were sorted into 13 groups according to the average of the measurements in each section, fj. A probability distribution, similar to those shown in Fig. 2, was constructed for each group and the confidence limits were calculated for 1, 2, and 3 standard deviations, that is, enclosing 68%, 95%, and 99% of the observations. Left panel: The local “instantaneous” flow (estimated from one microsphere injection) relative to the whole heart mean, fj, is plotted versus fj the mean local flow relative to the whole heart mean. The confidence limits are indicated by the brackets, and the number of observations is shown for each group. Right panel: Same as the left panel except that the ordinate is the local “instantaneous” flow relative to the local mean flow, fjfj. Narrowing of the confidence limits at higher flows indicates diminished temporal fluctuation relative to that in low flow regions
Fig. 4
Fig. 4
Comparison of the variation in local flow estimates from microsphere depositions to the variation due to the microsphere technique. The probability density per unit mean heart flow, P, is plotted versus the local “instantaneous” flow relative to the local mean flow, fjfj. The density function labeled “Simultaneous Injection” is comprised of observations from three animals in which two to six sets of microspheres with different labels were injected simultaneously. This distribution contains variation due to all sources of error in the methodology (e.g. non-uniform labeling of the microspheres, microsphere size variation, counting error, error in γ-ray peak separation, etc.). The “Temporally Separated” density function (•) is comprised of observations from 10 animals in which 4 – 6 injections were made; the separation between injections ranged from 4 min to 26 h. This distribution contains variation due to the methodologic sources discussed above plus temporal fluctuations, i.e. variation due to any change in the local flow during the interval between the measurements
Fig. 5
Fig. 5
Effect of temporal separation of regional blood flow measurements on the dispersion of the flow estimates. The myocardial sections of the ten hearts were sorted into groups based on mean local flow relative to the whole heart mean. The observed relative dispersion, RDlocal = SD/mean, for each group is plotted versus the time between the injections, Δt. Four points are missing from the graph: for three of the groups at Δt = 4 min and one at Δt = 1350 min; the number of observations was too small to permit calculation of a meaningful dispersions

Similar articles

Cited by

References

    1. Baer RW, Payne BD, Verrier ED, Vlahakes GJ, Molodowitch D, Uhlig PN, Hoffman JIE. Increased number of myocardial blood flow measurements with radionuclide-labeled microspheres. Am J Physiol. 1984;246:H418–H434. - PubMed
    1. Bassingthwaighte JB. McMillin-Wood JB, Bassingthwaighte JB, editors. Overview of the processes of delivery: flow, transmembrane transport, reaction and retention. Circulation. 1985;72(Suppl. IV):39–46. Cardiovascular metabolic imaging: physiology and biochemical dynamics in vivo. - PMC - PubMed
    1. Bassingthwaighte JB, Ackerman FH. Mathematical linearity of circulatory transport. J Appl Physiol. 1967;22:879–888. - PMC - PubMed
    1. Bassingthwaighte JB, Dobbs WA, Yipintsoi T. Heterogeneity of myocardial blood flow. In: Maseri A, editor. Myocardial blood flow in man: methods and significance in coronary disease. Minerva Medica; Torino: 1972. pp. 197–205.
    1. Bassingthwaighte JB, Malone MA, Moffett TC, King RB, Little SE, Link JM, Krohn KA. Validity of microsphere depositions for regional myocardial flows. Am J Physiol. 1987;253:H184–H193. - PMC - PubMed

Publication types

LinkOut - more resources