. 2018 Apr 18;121(5):863-873.
doi: 10.1093/aob/mcx151.

Subtle variation in shade avoidance responses may have profound consequences for plant competitiveness

Affiliations

Subtle variation in shade avoidance responses may have profound consequences for plant competitiveness

Franca J Bongers et al. Ann Bot. .

Abstract

Background and aims: Although phenotypic plasticity has been shown to be beneficial for plant competitiveness for light, there is limited knowledge on how variation in these plastic responses plays a role in determining competitiveness.

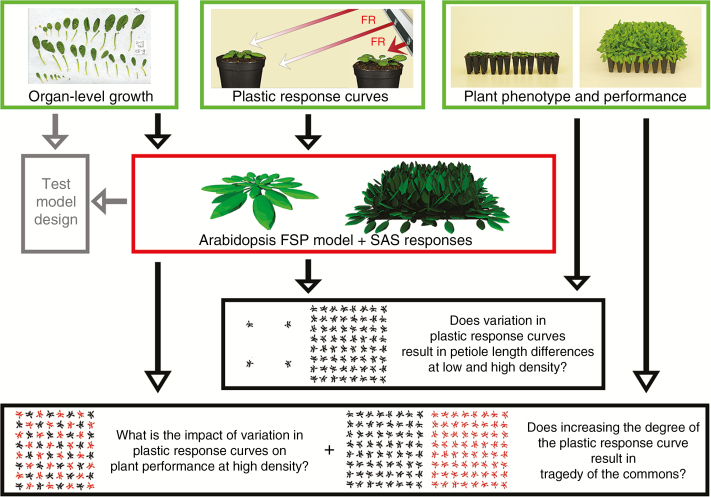
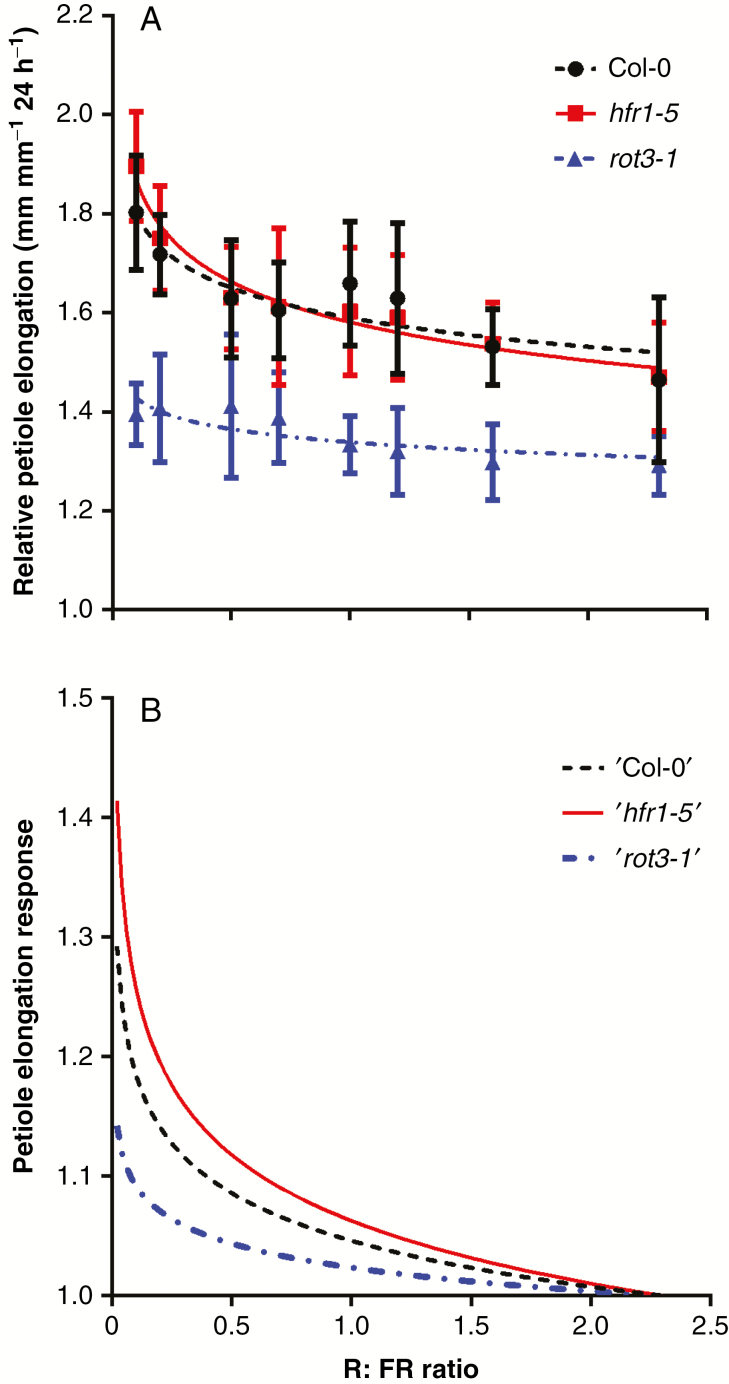
Methods: A combination of detailed plant experiments and functional-structural plant (FSP) modelling was used that captures the complex dynamic feedback between the changing plant phenotype and the within-canopy light environment in time and 3-D space. Leaf angle increase (hyponasty) and changes in petiole elongation rates in response to changes in the ratio between red and far-red light, two important shade avoidance responses in Arabidopsis thaliana growing in dense population stands, were chosen as a case study for plant plasticity. Measuring and implementing these responses into an FSP model allowed simulation of plant phenotype as an emergent property of the underlying growth and response mechanisms.

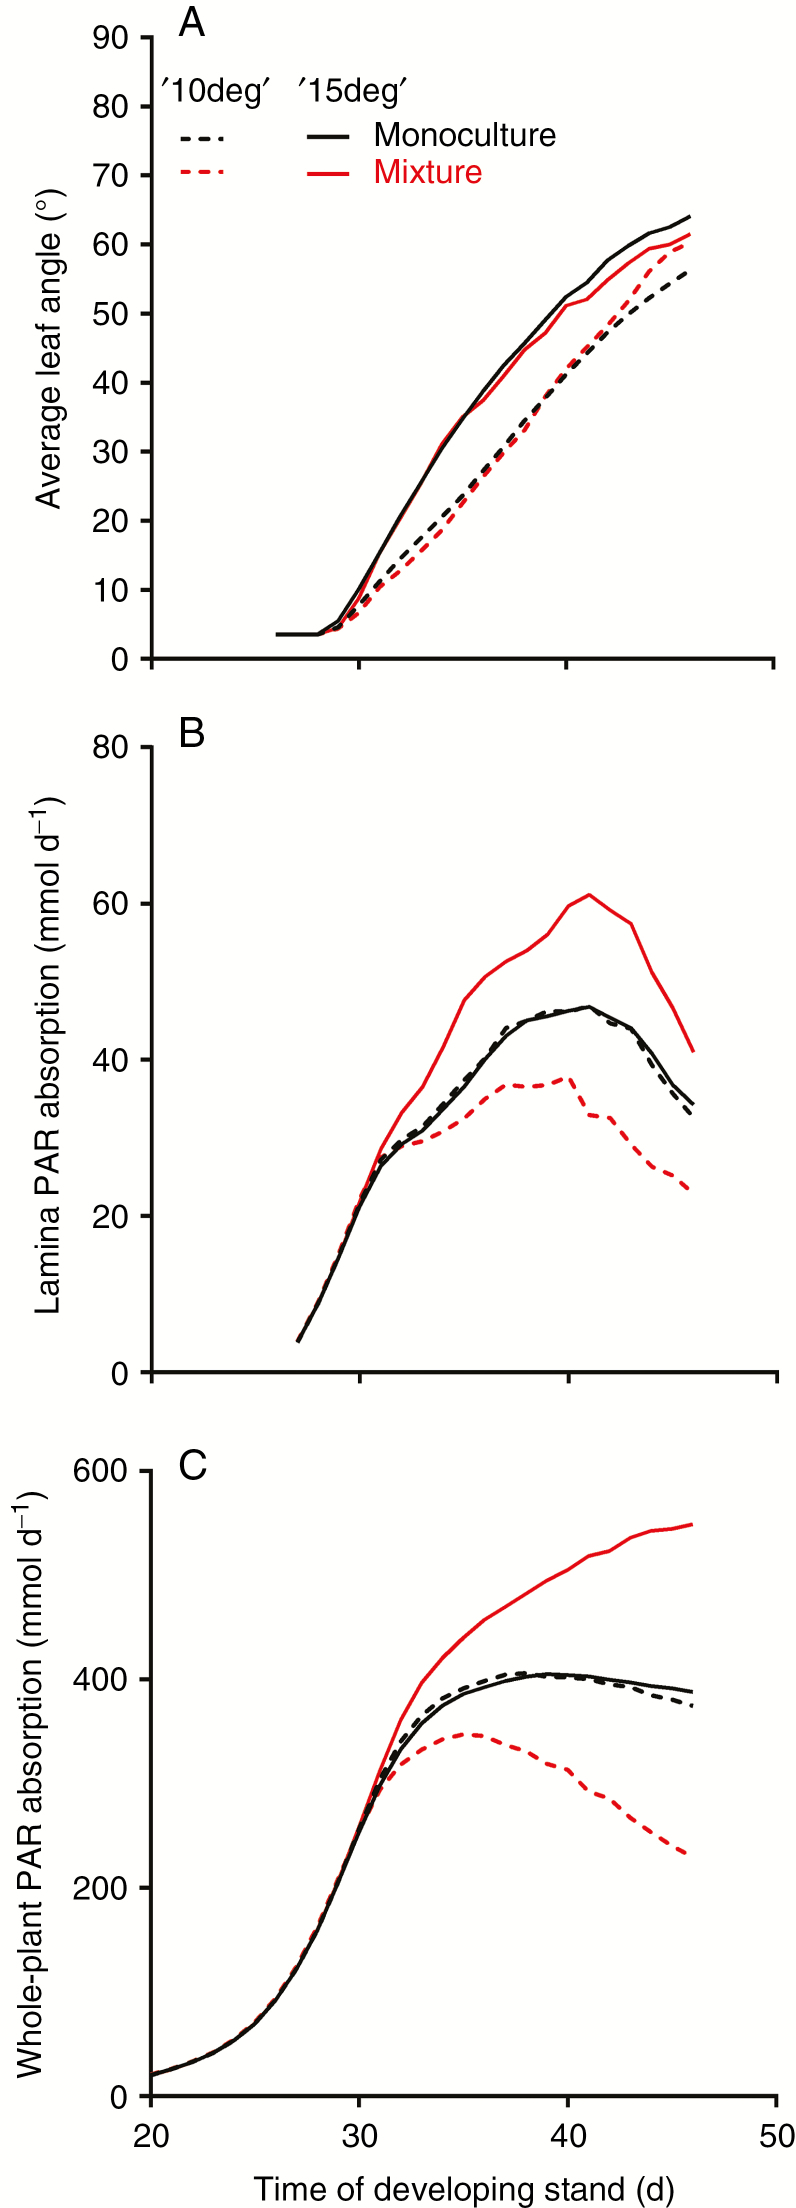
Key results: Both the experimental and model results showed that substantial differences in competitiveness may arise between genotypes with only marginally different hyponasty or petiole elongation responses, due to the amplification of plant growth differences by small changes in plant phenotype. In addition, this study illustrated that strong competitive responses do not necessarily have to result in a tragedy of the commons; success in competition at the expense of community performance.

Conclusions: Together, these findings indicate that selection pressure could probably have played a role in fine-tuning the sensitive shade avoidance responses found in plants. The model approach presented here provides a novel tool to analyse further how natural selection could have acted on the evolution of plastic responses.


Figures

Fig. 1.
Fig. 1.
Overview of the research design, in which three independent experiments (bordered in green) are combined with functional–structural plant (FSP) modelling (bordered in red) to address three questions (bordered in black). Data of organ growth and detailed plastic responses of arabidopsis were used to develop an FSP model that included two plastic responses of the shade avoidance syndrome (SAS); hyponasty and petiole elongation. The model design was tested by comparing phenotypic and performance data from plant experiments and model simulation (Scenario 1; bordered in grey). Additional model simulations and plant experiments were performed to validate model output (Scenarios 2 and 3) and answer the three research questions (Scenarios 2–6). See Supplementary Data Video for a visualization of arabidopsis plants growing in high and low population density.
Fig. 2.
Fig. 2.
Petiole elongation response curves from three arabidopsis genotypes. (A) Measured relative petiole elongation at different R:FR values for Col-0, hfr1-5 and rot3-1 with genotype-specific fitted curves [Eqn (1)]. Experimental data represent the mean ± s.d. (n = 12). (B) Petiole elongation response curves for the corresponding arabidopsis genotypes that were used in the model.
Fig. 3.
Fig. 3.
Experimentally and simulated obtained data of plant phenotype and performance. (A) Leaf angle change of plant growing in a high-density stand obtained from experimental data and simulated for plant types that did (‘Col-0’) or did not (‘NoHypo’) exhibit hyponastic responses. (B) Petiole length change of plants growing in low- and high-density stands, from experimental data and simulated for plant types that did not show petiole elongation (‘noPE’) or did show petiole elongation (‘Col-0’). Petiole rank number 12 was used as it was representative for other leaf ranks. (C) Total above-ground biomass of a plant growing in low- and high-density stands, from experimental data and simulated by the default plant type ‘Col-0’ that included both hyponastic and petiole elongation responses. Experimental data represent the mean ± s.d., with (n = 10 for low and n = 18 for high density). Simulated data represent the mean (n = 10).
Fig. 4.
Fig. 4.
Petiole lengths of all leaf ranks per plant after 46 d of growth of two arabidopsis genotypes. (A) Petiole lengths of hfr1-5 and (B) rot3-1 plants from experimental data or simulated by the model in low- and high-density stands. Experimental data represent the mean ± s.d. (with n = 10 for low and n = 18 for high density). Simulated data represent the mean (n = 10).
Fig. 5.
Fig. 5.
Total above-ground biomass of an individual arabidopsis plant grown in a monoculture or mixture for 46 d. Plant biomass simulated by the model (A, Scenario 3) or obtained from experimental data (B). Simulated plant types ‘Col-0’ and ‘hfr1-5’ had 0.054 and 0.073 for their response curves, respectively. Simulated data represent the mean ± s.d. (n = 10). Experimental data represent mean ± s.d. (n = 5). ns, not significant; *P < 0.05.
Fig. 6.
Fig. 6.
Simulated leaf and plant characteristics during the development of arabidopsis monocultures or mixtures consisting of two genotypes with distinct petiole elongation response curves (Scenario 3). The ‘hfr1-5’ type had a stronger petiole elongation response curve than the ‘Col-0’ type, shown in Fig. 2B. (A) Petiole length, (B) lamina-absorbed PAR and (C) whole-plant absorbed PAR during stand development. Leaf rank number 12 was used to visualize petiole length and lamina PAR absorption, and was representative for other leaf ranks.
Fig. 7.
Fig. 7.
Simulated leaf-specific and whole-plant characteristics during the development of arabidopsis monocultures or mixtures consisting of two genotypes with distinct hyponastic responses (Scenario 4). The ‘15deg’ plant type had a stronger hyponastic response than the ‘10deg’ plant type. (A) Leaf angle, (B) lamina-absorbed PAR and (C) whole-plant absorbed PAR during stand development. Leaf rank number 12 was used to visualize petiole length and lamina PAR absorption, and was representative for other leaf ranks.
Fig. 8.
Fig. 8.
Simulated performance difference related to the difference in plastic response values of ‘wild-type’ and ‘competitor’ plant types in high-density mixtures (Scenario 5 and 6). Performance difference was calculated by the above-ground biomass of the ‘competitor’ minus the above-ground biomass of the ‘wild-type’ plant type. Performance difference related to the difference in (A) the petiole elongation response curve value (Scenario 5) or (B) the hyponastic response value (Scenario 6). The absolute petiole elongation and hyponastic response values for the two plant types are also expressed. Data represent the mean ± s.d. (n = 10).

References

    1. Anten NPR. 2005. Optimal photosynthetic characteristics of individual plants in vegetation stands and implications for species coexistence. Annals of Botany 95: 495–506. - PMC - PubMed
    1. Anten NPR, Vermeulen PJ. 2016. Tragedies and crops: understanding natural selection to improve cropping systems. Trends in Ecology and Evolution 31: 429–439. - PubMed
    1. Anten NPR, Schieving F, Werger MJA. 1995. Patterns of light and nitrogen distribution in relation to whole canopy carbon gain in C3 and C4 mono- and dicotyledonous species. Oecologia 101: 504–513. - PubMed
    1. Ballaré CL, Pierik R. 2017. The shade-avoidance syndrome: multiple signals and ecological outputs. Plant, Cell and Environment 40: 2530–2543. - PubMed
    1. Bardgett RD, Mommer L, De Vries FT. 2014. Going underground: root traits as drivers of ecosystem processes. Trends in Ecology and Evolution 29: 692–699. - PubMed

Publication types