. 2017 Dec 27;12(12):e0189818.
doi: 10.1371/journal.pone.0189818. eCollection 2017.

Overexpression of Map3k7 activates sinoatrial node-like differentiation in mouse ES-derived cardiomyocytes

Affiliations

Overexpression of Map3k7 activates sinoatrial node-like differentiation in mouse ES-derived cardiomyocytes

Kemar Brown et al. PLoS One. .

Abstract

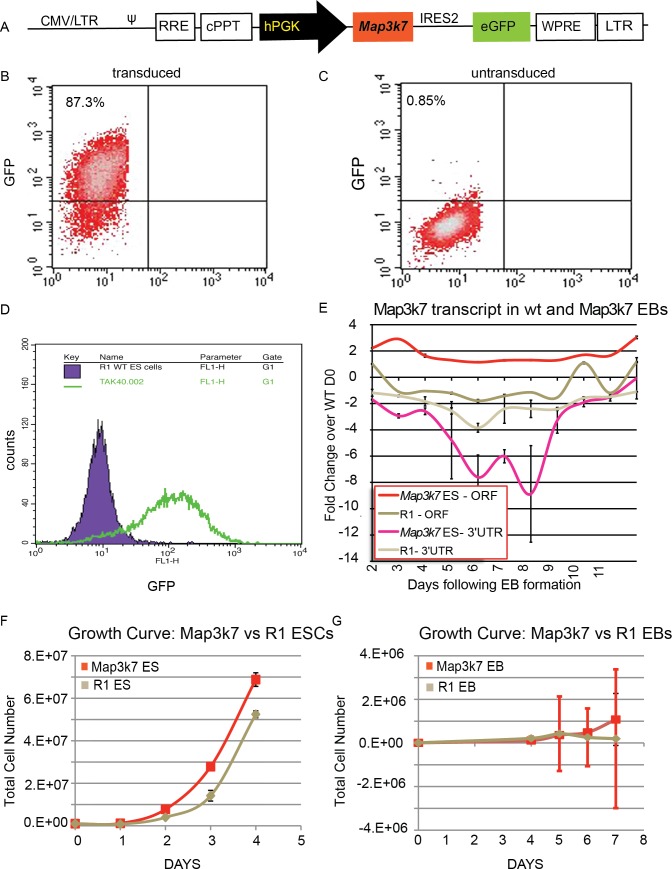
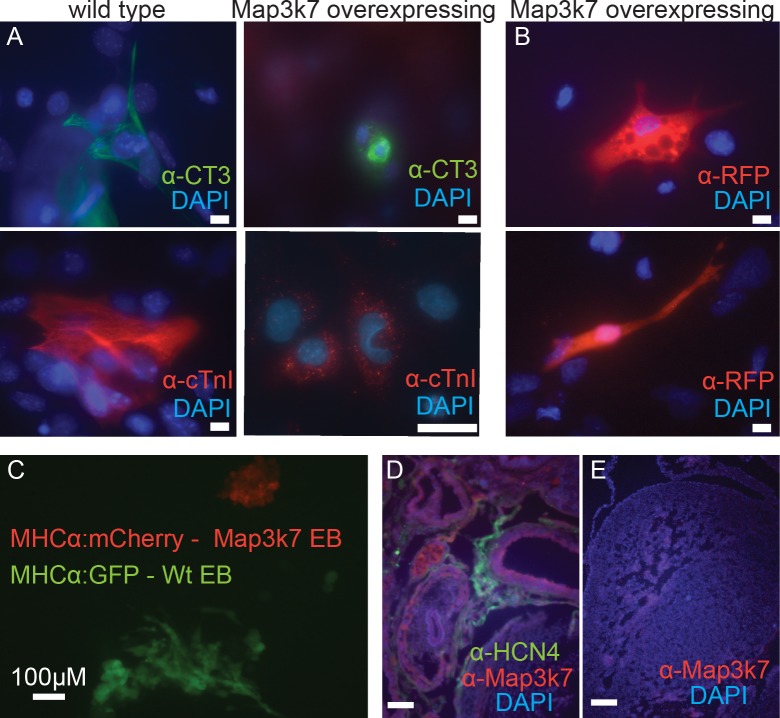
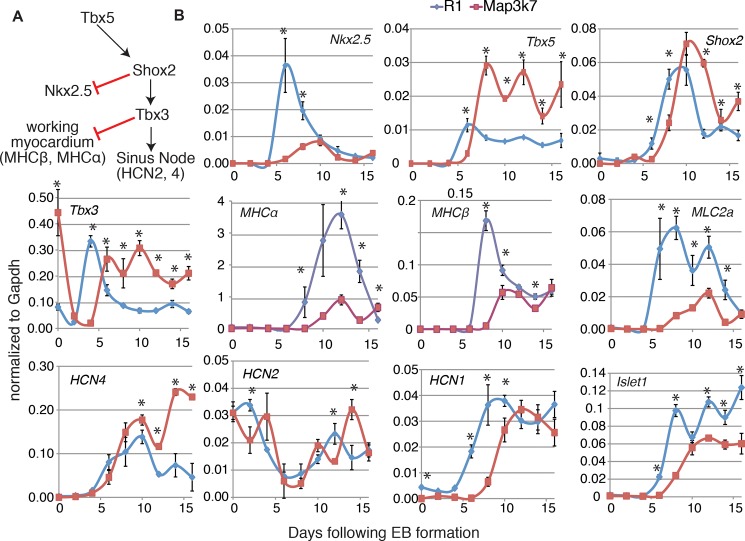
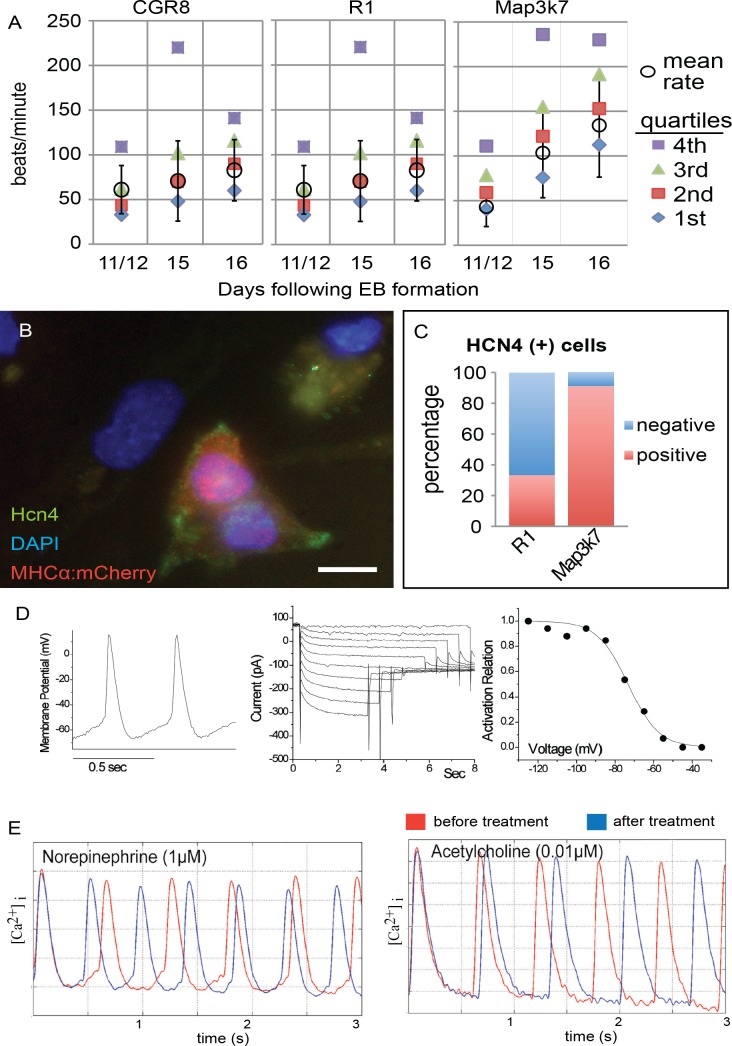
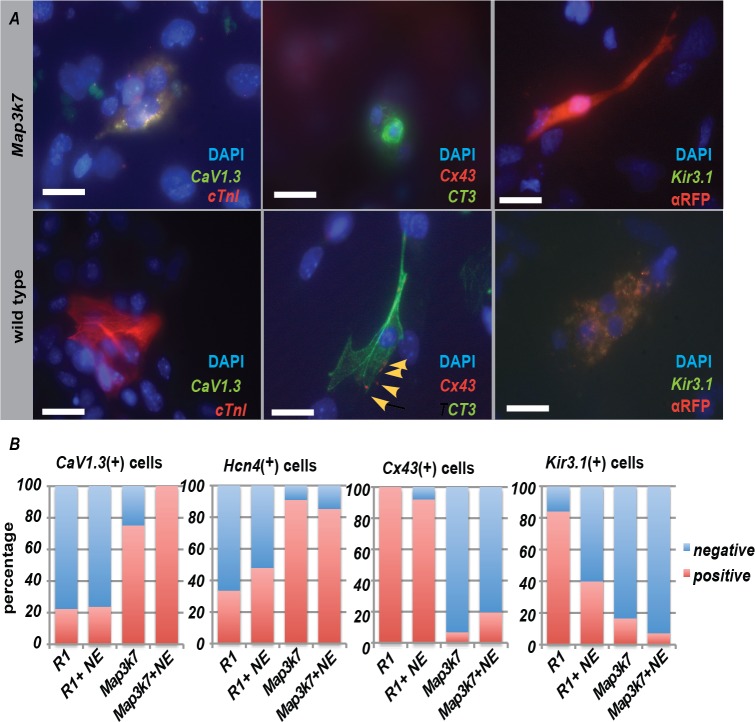
In vivo, cardiomyocytes comprise a heterogeneous population of contractile cells defined by unique electrophysiologies, molecular markers and morphologies. The mechanisms directing myocardial cells to specific sub-lineages remain poorly understood. Here we report that overexpression of TGFβ-Activated Kinase (TAK1/Map3k7) in mouse embryonic stem (ES) cells faithfully directs myocardial differentiation of embryoid body (EB)-derived cardiac cells toward the sinoatrial node (SAN) lineage. Most cardiac cells in Map3k7-overexpressing EBs adopt markers, cellular morphologies, and electrophysiological behaviors characteristic of the SAN. These data, in addition to the fact that Map3k7 is upregulated in the sinus venous-the source of cells for the SAN-suggest that Map3k7 may be an endogenous regulator of the SAN fate.


Conflict of interest statement

Competing Interests: The authors have declared that no competing interests exist.

Figures

Fig 1
Fig 1
A. Schematic of lentiviral construct used to create an ES cell line stably overexpressing Map3k7. B-D. Flow cytometry analysis comparing green fluorescent protein (GFP) in Map3k7-overexpressing ES cells (B) to unmodified R1 cells (C). D. Cell count as compared to GFP fluorescence in untransduced (purple) and transduced (green) cells. E. qRT-PCR data showing overall Map3k7 expression during EB differentiation (red line) as compared to unmodified ES cells. Error bars indicate standard deviation of three technical replicates from a single differentiation. F-G. Growth curves comparing rate of growth in Map3k7-overexpressing cells (red) as compared to unmodified R1 cells, when grown as ES cells (tan) (F) and during EB differentiation (G). Error bars indicate standard deviation across three biological replicates.
Fig 2
Fig 2
A. Immunocytochemistry showing that individual or small clusters of cardiomyocytes that form in wild-type and Map3k7-overexpressing EBs express both the MF20 epitope (anti-CT3 epitope, green) and cardiac Troponin (cTnI, red). Blue indicates DAPI signal in all panels. Note that Troponin protein is poorly organized in cardiac cells derived from Map3k7-overexpressing ES cells. Scale bars indicate 10 μM in panels stained for cTnI and 20μM in panels stained for MF20. B. After several weeks in culture Map3k7-overexpressing cells showed spider and spindle cell morphologies that are characteristic of mature SAN cells. C. Fluorescent image showing Map3k7-overexpressing cells that also possess the MHCα::mCherry reporter (marking cardiomyocytes with red fluorescence) and wild-type cells possessing the MHCα::GFP reporter (marking cardiomyocytes with green fluorescence). Note that cardiomyocytes derived from Map3k7-overexpressing cells possess a distinct morphology as compared to wild-type cardiomyocytes. Scale bar represents 100 μM. D. Anti- Map3k7 antibody staining of 19 day old mouse embryo showing increased expression in the remnants of the sinus venous and overlapping with HCN4 positive cells. E. By contrast, low expression of Map3k7 in the left ventricle of the same heart.
Fig 3
Fig 3
A. Diagram of the major transcriptional regulators of SAN differentiation in the mouse embryo. Tbx5 activates Shox2, Tbx3 and SAN-specific markers, including Hcn2 and Hcn4. In addition, Shox2 inhibits Nkx2.5 expression, and Tbx3 inhibits markers for the working myocardium. B. qRT-PCR data showing changes in the expression or timing of SAN related genes. Blue line indicates relative gene expression normalized to expression of Gapdh over time in wild-type R1 EBs and red lines indicate gene expression in Map3k7-overexpressing EBs. Error bars indicate standard error from three technical replicates. Upregulation or downregulation of each gene was considered relevant only if relative expression trends were the same in each of a minimum of three biological replicates. Error bars represent standard error from three technical replicates. Statistical significance was determined by t-test. (*) represent p<0.006.
Fig 4
Fig 4
A. Beat Rate Data showing quartile beat rate data for 100 beating foci for two wild type mouse strains and Map3k7 overexpressing cells. B. Immunocytochemistry showing overlap of the cardiac reporter with the SAN specific marker Hcn4. C. Summary of this data showing the % of Hcn4 expressing cardiomyocytes is dramatically increased in the Map3k7-overexpressing cells. D. Perforated patch recording of automaticity and pacemaker current in mCherry expressing cardiomyocytes derived from Map3k7-overexpressing ES cells. Left: Spontaneous APs. Middle: Pacemaker current recorded from the same cell. Right: calculated activation relation from the same cell, showing current activation within the diastolic potential range. E. Calcium transients in cardiomyocytes derived from Map3k7-overexpressing ES cells before (red trace) and after (blue trace) treatment with either 1μM norepinephrine or 0.01μM acetylcholine, as indicated. Beating in these cardiomyocytes accelerates in response to norepinephrine and slows down in response to acetylcholine.
Fig 5
Fig 5. Immunocytochemistry on individual or small clusters of wild type or Map3k7 overexpressing cardiomyocytes (as indicated by expression of cTnI, red, in CaV1.3 and Kir3.1 panels) or CT3 monoclonal antibody (green, in Cx43 panels) indicating that the SAN-specific calcium channel CaV1.3 (green) is expressed in Map3k7 cardiomyocytes but not in most cardiac cells derived from wild type ES cells.
By contrast Cx43 (red and red arrow heads) and Kir3.1 (green) are expressed in most wild type cardiomyocytes but not in cardiac cells derived from Map3k7 overexpressing EBs. Blue indicates DAPI staining in all panels. Scale bars in all figures represent 20μM.

References

    1. Van Mierop LH, Gessner IH. The morphologic development of the sinoatrial node in the mouse. Am J Cardiol. 1970;25(2):204–12. Epub 1970/02/01. doi: 0002-9149(70)90580-1 [pii]. . - PubMed
    1. Barbuti A, Robinson RB. Stem cell-derived nodal-like cardiomyocytes as a novel pharmacologic tool: insights from sinoatrial node development and function. Pharmacol Rev. 2015;67(2):368–88. doi: 10.1124/pr.114.009597 . - DOI - PubMed
    1. DiFrancesco D, Ferroni A, Mazzanti M, Tromba C. Properties of the hyperpolarizing-activated current (if) in cells isolated from the rabbit sino-atrial node. J Physiol. 1986;377:61–88. Epub 1986/08/01. ; PubMed Central PMCID: PMC1182823. - PMC - PubMed
    1. Santoro B, Liu DT, Yao H, Bartsch D, Kandel ER, Siegelbaum SA, et al. Identification of a gene encoding a hyperpolarization-activated pacemaker channel of brain. Cell. 1998;93(5):717–29. Epub 1998/06/18. doi: S0092-8674(00)81434-8 [pii]. . - PubMed
    1. Seifert R, Scholten A, Gauss R, Mincheva A, Lichter P, Kaupp UB. Molecular characterization of a slowly gating human hyperpolarization-activated channel predominantly expressed in thalamus, heart, and testis. Proceedings of the National Academy of Sciences of the United States of America. 1999;96(16):9391–6. Epub 1999/08/04. ; PubMed Central PMCID: PMC17793. - PMC - PubMed

Publication types

Substances

LinkOut - more resources