. 2017 Dec 27;12(12):e0189894.
doi: 10.1371/journal.pone.0189894. eCollection 2017.

Impaired PGE2-stimulated Cl- and HCO3- secretion contributes to cystic fibrosis airway disease

Affiliations

Impaired PGE2-stimulated Cl- and HCO3- secretion contributes to cystic fibrosis airway disease

Zachary M Sellers et al. PLoS One. .

Abstract

Background: Airway mucociliary clearance (MCC) is an important defense mechanism against pulmonary infections and is compromised in cystic fibrosis (CF). Cl- and HCO3- epithelial transport are integral to MCC. During pulmonary infections prostaglandin E2 (PGE2) production is abundant.

Aim: To determine the effect of PGE2 on airway Cl- and HCO3- secretion and MCC in normal and CF airways.

Methods: We examined PGE2 stimulated MCC, Cl- and HCO3- secretion using ferret trachea, human bronchial epithelial cell cultures (CFBE41o- with wildtype CFTR (CFBE41 WT) or homozygous F508del CFTR (CFBE41 CF) and human normal bronchial submucosal gland cell line (Calu-3) in Ussing chambers with or without pH-stat.

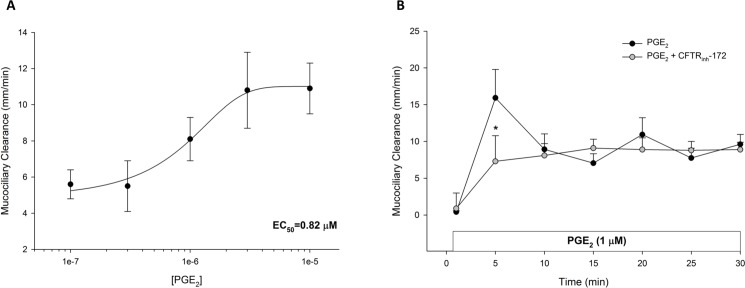
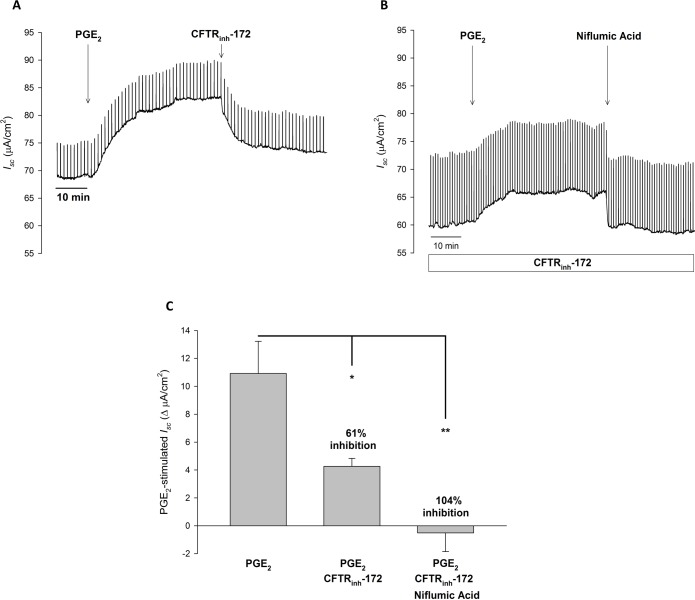
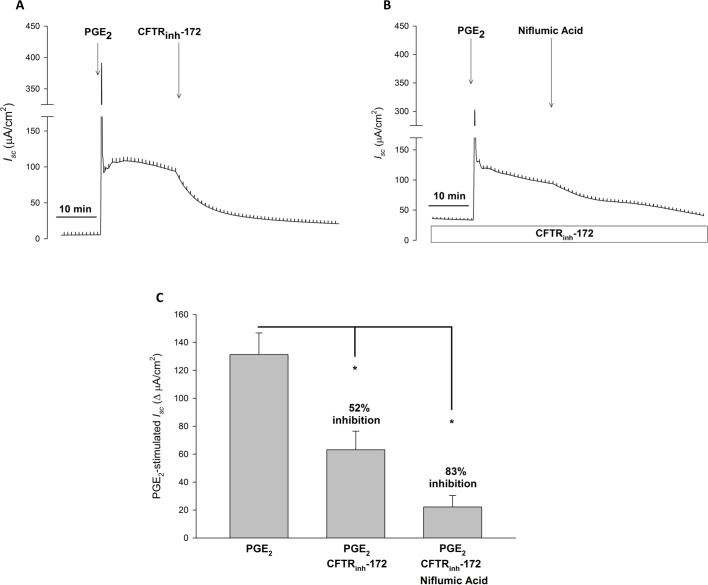
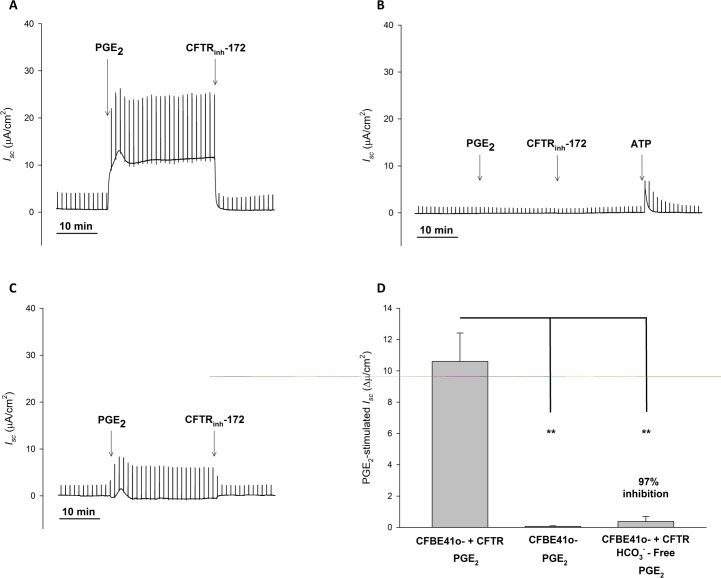
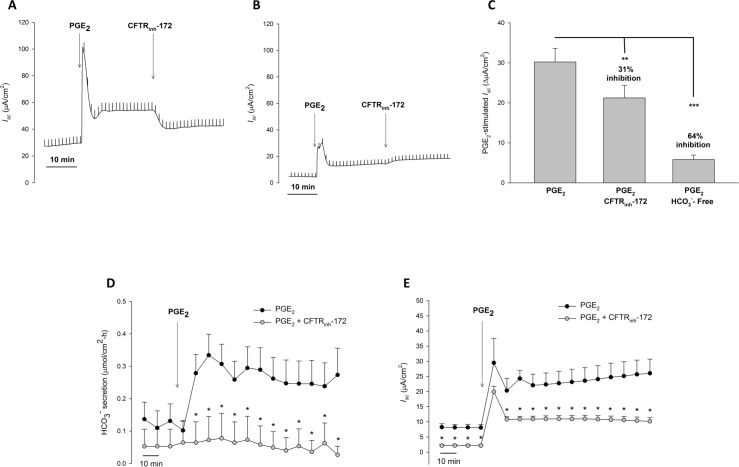
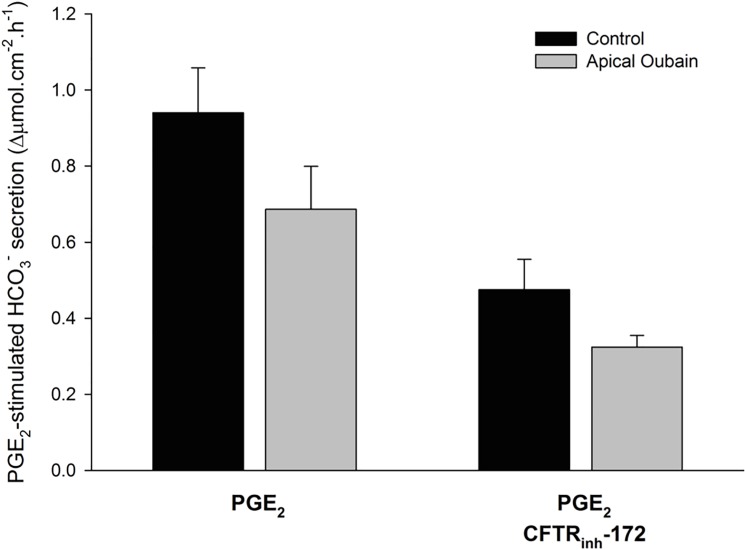
Results: PGE2 stimulated MCC in a dose-dependent manner and was partially impaired by CFTRinh-172. PGE2-stimulated Cl- current in ferret trachea was partially inhibited by CFTRinh-172, with niflumic acid eliminating the residual current. CFBE41 WT cell monolayers produced a robust Cl- and HCO3- secretory response to PGE2, both of which were completely inhibited by CFTRinh-172. CFBE41 CF cells exhibited no response to PGE2. In Calu-3 cells, PGE2 stimulated Cl- and HCO3- secretion. Cl- secretion was partially inhibited by CFTRinh-172, with additional inhibition by niflumic acid. HCO3- secretion was completely inhibited by CFTRinh-172.

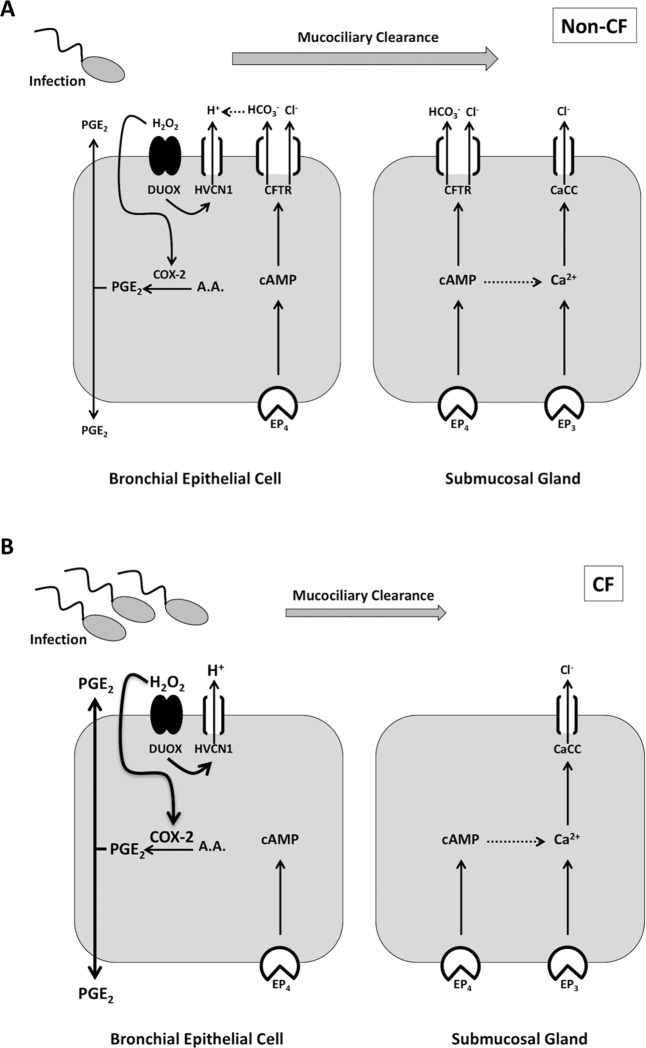
Conclusions: PGE2 stimulates bronchotracheal MCC and this response is decreased in CF. In CF airway, PGE2-stimulated Cl- and HCO3- conductance is impaired and may contribute to decreased MCC. There remains a CFTR-independent Cl- current in submucosal glands, which if exploited, could represent a means of improving airway Cl- secretion and MCC in CF.


Conflict of interest statement

Competing Interests: The authors have declared that no competing interests exist.

Figures

Fig 1
Fig 1. PGE2-stimulated mucociliary transport in ferret trachea.
A. PGE2 stimulates a dose-dependent increase in MCC in ferret trachea. Each tissue was exposed to 2–3 doses of PGE2 for 30 minutes each (n = 3 each dose). Data are shown as the mean PGE2-stimulated increase in MCC over baseline ± SEM. The half-maximal effective concentration (EC50) is noted in lower right corner. B. Timecourse of PGE2-stimulated MCC with and without CFTR inhibition (n ≥ 6 each). For CFTR inhibition, tissues were bathed in apical and serosal solution for 30 minutes with CFTRinh-172 (20 μM) prior to the 15-minute period and kept in the serosal bath for the length of the experiment. PGE2 (1 μM) was added to the serosal bath. Circles represent means with bars indicating SEM. Asterisks represent P < 0.05 by ANOVA.
Fig 2
Fig 2. In ferret trachea, PGE2 stimulated Isc is mediated by CFTR and Ca2+-activated Cl- channels.
A. Representative Isc trace with vertical deflections indicating the change in Isc after a 1 mV pulse was applied (every 1 minute). Ferret trachea was exposed to serosal to mucosal Cl- gradient with equivalent bilateral HCO3-. PGE2 (1 μM, serosal) was added to ferret trachea after a baseline period of ≥ 10 minutes, with CFTRinh-172 (20 μM, mucosal) added after 30 minutes. B. Representative Isc trace of ferret trachea incubated in CFTRinh-172 (20 μM, mucosal) for at least 30 minutes prior to PGE2 (1 μM, serosal) stimulation. After 30 minutes, niflumic acid (100 μM, mucosal) was added. C. Change in PGE2-stimulated Isc (mean ± SEM, n ≥ 5) in ferret trachea, with comparisons between no inhibition, CFTR inhibition, or CFTR and Ca2+-activated Cl- inhibition. Asterisks denote significance by Student’s t-test (*, P < 0.05, **, P < 0.01). Mean percent inhibition compared to PGE2 stimulation alone noted.
Fig 3
Fig 3. In human bronchial epithelial cells, PGE2 stimulated Cl- secretion is completely CFTR dependent.
A. Representative Isc trace with vertical deflections indicating the change in Isc after a 1 mV pulse was applied (every 1 minute). Bronchial epithelial cells were exposed to serosal to mucosal Cl- gradient with equivalent bilateral HCO3-. PGE2 (1 μM, serosal) was added to HBE41 WT cells after a baseline period of ≥ 10 minutes, with CFTRinh-172 (20 μM, mucosal) added afterwards. To verify cell viability, ATP (500 μM, mucosal) was added. B. Representative Isc trace from a similar experiment with CFBE41 CF cells. C. Change in PGE2-stimulated Isc (mean ± SEM, n ≥ 4) in CFBE41 WT and CF cells. Asterisks denote significance by Student’s t-test (***, P < 0.001). Mean percent inhibition compared to CFBE41 WT noted. D-F. PGE2 stimulated Cl- secretion in 16HBE14o- cells (D), primary cultures of human bronchial epithelial cells (E), and primary cultures from CF nasal polyp extract (F). Experiments were performed in the same manner as Fig 3A and representative Isc traces are shown. N ≥ 3 experiments were performed for each set of cells with similar responses.
Fig 4
Fig 4. In Calu-3 cells, PGE2 stimulated Cl- secretion is mediated by CFTR and Ca2+-activated Cl- channels.
A. Representative Isc trace with vertical deflections indicating the change in Isc after a 1 mV pulse was applied (every 1 minute). Calu-3 cells were exposed to serosal to mucosal Cl- gradient with equivalent bilateral HCO3-. PGE2 (1 μM, serosal) was added to Calu-3 cells after a baseline period of ≥ 10 minutes, with CFTRinh-172 (20 μM, mucosal) added after 30 minutes. B. Representative Isc trace of Calu-3 cells incubated in CFTRinh-172 (20 μM, mucosal) for at least 30 minutes prior to PGE2 (1 μM, serosal) stimulation. After 30 minutes, niflumic acid (100 μM, mucosal) was added. C. Change in PGE2-stimulated Isc (mean ± SEM, n ≥ 4) in Calu-3 cells, with comparisons between no inhibition, CFTR inhibition, or CFTR and Ca2+-activated Cl- inhibition. Asterisks denote significance by Student’s t-test (*, P < 0.05). Mean percent inhibition compared to PGE2 stimulation alone noted.
Fig 5
Fig 5. In CFBE41 cells, PGE2 stimulated HCO3- secretion is completely CFTR dependent.
A. Representative Isc trace with vertical deflections indicating the change in Isc after a 1 mV pulse was applied (every 1 minute). CFBE41 WT cells were exposed to serosal to mucosal HCO3- gradient with equivalent bilateral Cl-. PGE2 (1 μM, serosal) was added to CFBE41 WT cells after a baseline period of ≥ 10 minutes, with CFTRinh-172 (20 μM, mucosal) added afterwards. B. Representative Isc trace from a similar experiment with CFBE41 CF cells. To verify cell viability, ATP (500 μM, mucosal) was added. C. Representative Isc trace from a similar experiment as Fig 5A with CFBE41 WT cells, except experiments were performed in HCO3--free conditions. D. Change in PGE2-stimulated Isc (mean ± SEM, n = 3) in CFBE41 WT and CF cells in HCO3- containing and HCO3--free conditions. Asterisks denote significance by Student’s t-test (**, P < 0.01). Mean percent inhibition compared to CFBE41 WT noted.
Fig 6
Fig 6. In Calu-3 cells, PGE2 stimulated HCO3- secretion is completely CFTR dependent.
A. Representative Isc trace with vertical deflections indicating the change in Isc after a 1 mV pulse was applied (every 1 minute). Calu-3 cells were exposed to serosal to mucosal HCO3- gradient with equivalent bilateral Cl-. PGE2 (1 μM, serosal) was added to Calu-3 cells after a baseline period of ≥ 10 minutes, with CFTRinh-172 (20 μM, mucosal) added 30 minutes after. B. Representative Isc trace from a similar experiment with Calu-3 cells in HCO3--free conditions. C. Change in PGE2-stimulated Isc (mean ± SEM, n = 3) in Calu-3 cells, with comparisons between no inhibition, CFTR inhibition, and HCO3--free conditions. Asterisks denote significance by Student’s t-test (**, P < 0.01, ***, P < 0.001). Mean percent inhibition compared to Calu-3 cells under control conditions. D. Timecourse of HCO3- secretion measured by pH-stat. The serosal solution was bathed with 95% O2/5% CO2 (similar to experiments in A-C), but the mucosal solution was bathed with 100% O2 to prevent base formation from carbonhic anhydrase conversion of CO2. Calu-3 cells were incubated in DMSO (5 μL; 1:1000 with bath; n = 10) or CFTRinh-172 (20 μM, mucosal; n = 6) for 30–60 minutes prior to PGE2 stimulation (1 μM, serosal). Circles represent means with bars indicating SEM. Asterisks represent P < 0.05 by ANOVA. E. Timecourse of Isc measured by pH-stat measured simultaneously as pH-stat. Circles represent means with bars indicating SEM. Asterisks represent P < 0.05 by ANOVA.
Fig 7
Fig 7. In Calu-3 cells, PGE2 stimulated HCO3- secretion is not affected by apical oubain, an inhibitor of the non-gastric H+/K+ ATPase.
Experiments were performed to determine the potential role of ATP12A in measured PGE2-stimulated HCO3- secretion in normal and CF conditions. Calu-3 experiments were performed similar to that in Fig 6, with the exception that an additional set of experiments were done with oubain (10 μM, mucosal) pre-treatment for ≥ 40 minutes prior to PGE2 stimulation. Bars represent change in PGE2-stimulated Isc (mean ± SEM, n ≥ 5) in Calu-3 cells. Statistical comparisons were done between PGE2 with and without oubain and PGE2 with CFTR inhibition with and without oubain. No statistical difference was noted in either case (P > 0.05 by Student’s t-test).
Fig 8
Fig 8. Simplified working model of PGE2-stimulated Cl- and HCO3- secretion and mucociliary clearance in non-CF and CF airway.
A. In the airway, microbial infections cause an increase in PGE2 through release from infiltrating inflammatory cells (not pictured) and production by airway epithelia via COX-2 activation. H2O2 produced by DUOX activates COX-2 and HVCN1 channels provide the H+ shunt from H2O2 production. PGE2 exits the cell and activates PGE2 (EP) receptors. In the current study we did not examine specific EP receptor involvement, however, we propose that EP4 is the predominant mediator of serosal PGE2 stimulation in bronchial epithelial cells. Submucosal gland cells may also utilize the EP3 receptor, or Ca2+-activated Cl- channels (CaCC) may get activated via EP4-mediated cAMP-Ca2+ crosstalk. In bronchial epithelial cells, PGE2 stimulates Cl- and HCO3- secretion via CFTR, whereas in submucosal glands, both CFTR and CaCC are activated. Cl- and HCO3- secretion will then influence airway pH, mucus properties, hydration, and ultimately, mucociliary clearance. B. In CF airway, lack of CFTR-dependent Cl- and HCO3- secretion in bronchial epithelial cells, coupled with no HCO3- secretion and decreased Cl- secretion from submucosal glands, leads to an acidic airway pH, thick-adherent mucus, and decreased mucociliary clearance. This results in increased microbial infection and rampant inflammation, in part by increased PGE2 production.

References

    1. Knowles MR, Boucher RC. Mucus clearance as a primary innate defense mechanism for mammalian airways. J Clin Invest. 2002;109(5):571–7. doi: 10.1172/JCI15217 ; PubMed Central PMCID: PMC150901. - DOI - PMC - PubMed
    1. Jeong JH, Joo NS, Hwang PH, Wine JJ. Mucociliary clearance and submucosal gland secretion in the ex vivo ferret trachea. American journal of physiology Lung cellular and molecular physiology. 2014;307(1):L83–93. doi: 10.1152/ajplung.00009.2014 . - DOI - PubMed
    1. Tang XX, Ostedgaard LS, Hoegger MJ, Moninger TO, Karp PH, McMenimen JD, et al. Acidic pH increases airway surface liquid viscosity in cystic fibrosis. J Clin Invest. 2016;126(3):879–91. doi: 10.1172/JCI83922 ; PubMed Central PMCID: PMCPMC4767348. - DOI - PMC - PubMed
    1. Gustafsson JK, Ermund A, Ambort D, Johansson ME, Nilsson HE, Thorell K, et al. Bicarbonate and functional CFTR channel are required for proper mucin secretion and link cystic fibrosis with its mucus phenotype. J Exp Med. 2012;209(7):1263–72. Epub 2012/06/20. doi: 10.1084/jem.20120562 ; PubMed Central PMCID: PMC3405509. - DOI - PMC - PubMed
    1. Haq IJ, Gray MA, Garnett JP, Ward C, Brodlie M. Airway surface liquid homeostasis in cystic fibrosis: pathophysiology and therapeutic targets. Thorax. 2016;71(3):284–7. doi: 10.1136/thoraxjnl-2015-207588 . - DOI - PubMed

Publication types