. 2017 Dec 26;21(13):3754-3766.
doi: 10.1016/j.celrep.2017.11.106.

Somatic Mutations Activating the mTOR Pathway in Dorsal Telencephalic Progenitors Cause a Continuum of Cortical Dysplasias

Affiliations

Somatic Mutations Activating the mTOR Pathway in Dorsal Telencephalic Progenitors Cause a Continuum of Cortical Dysplasias

Alissa M D'Gama et al. Cell Rep. .

Abstract

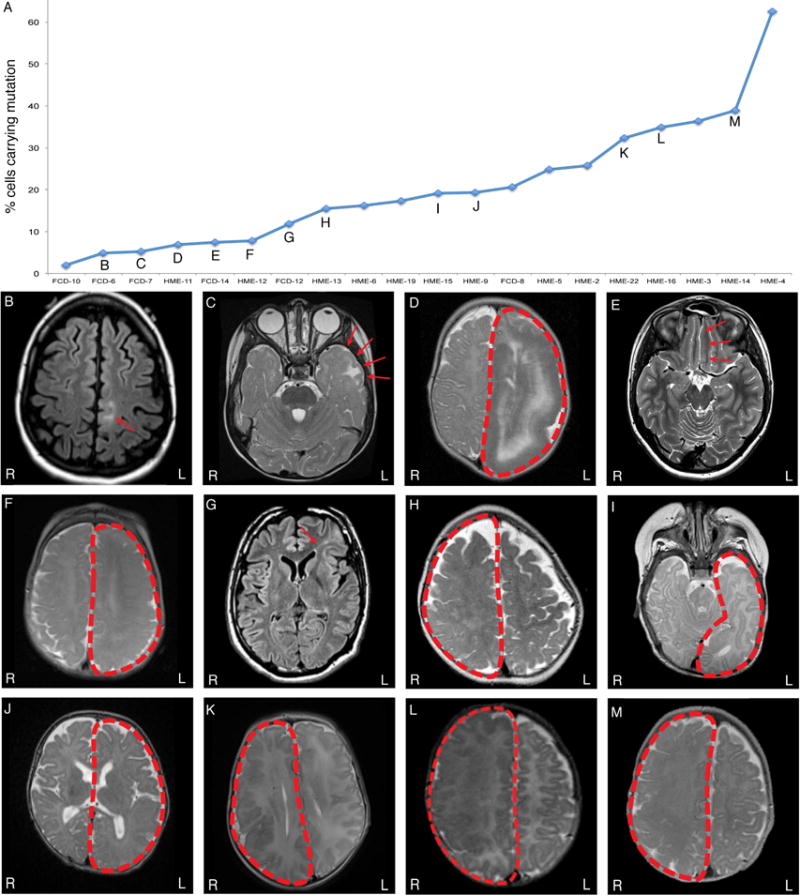
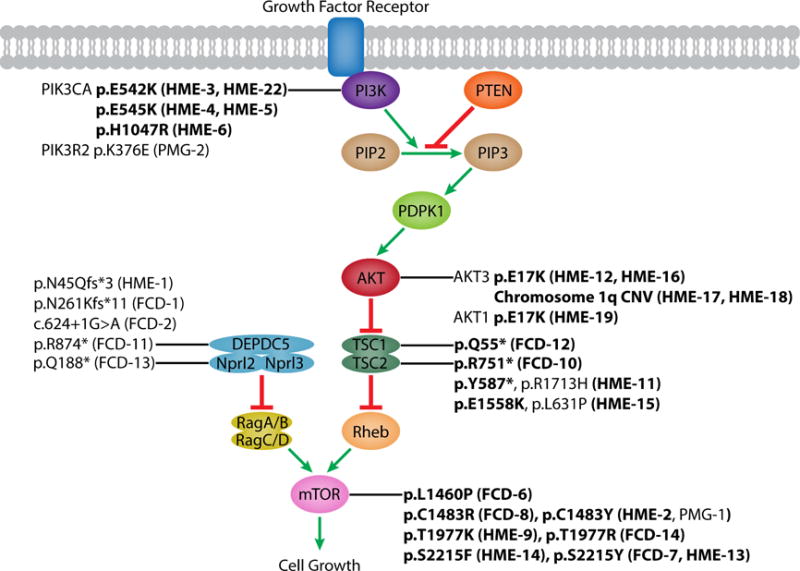
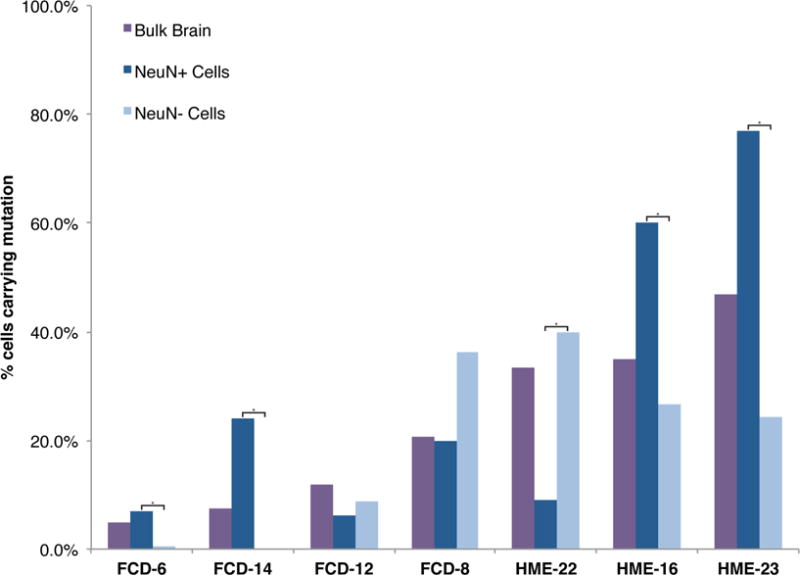
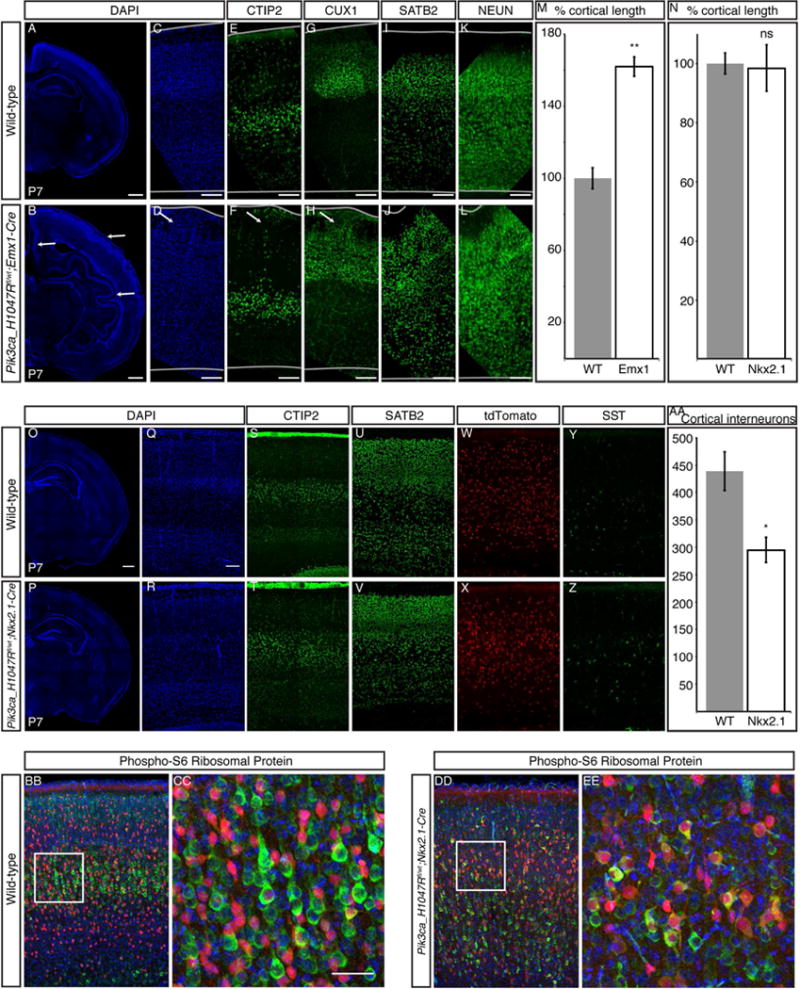
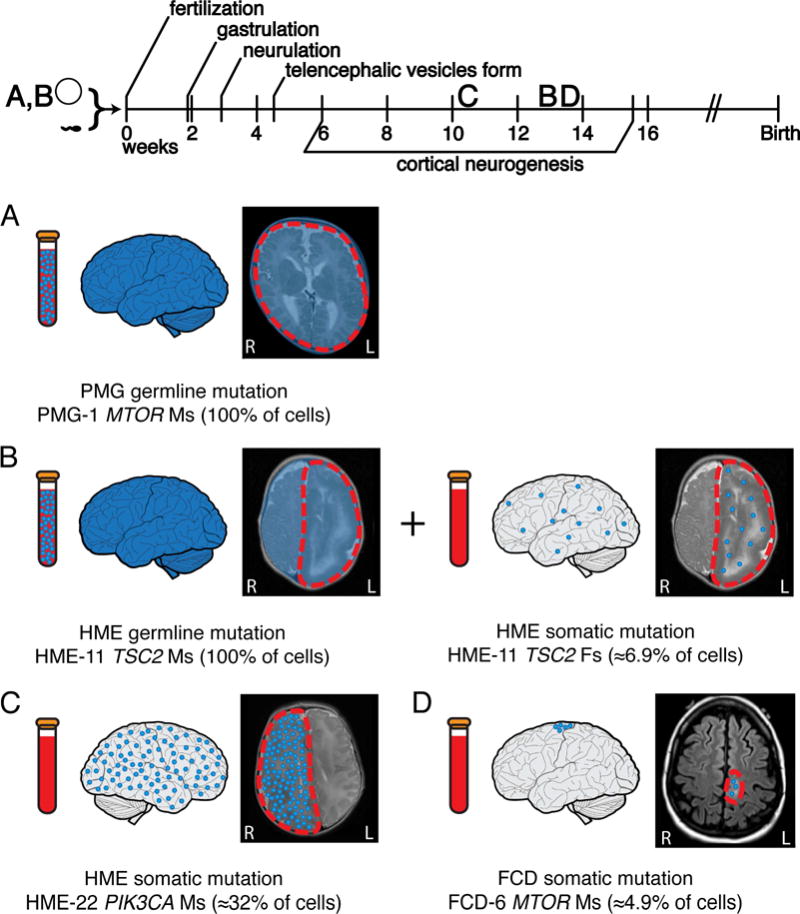
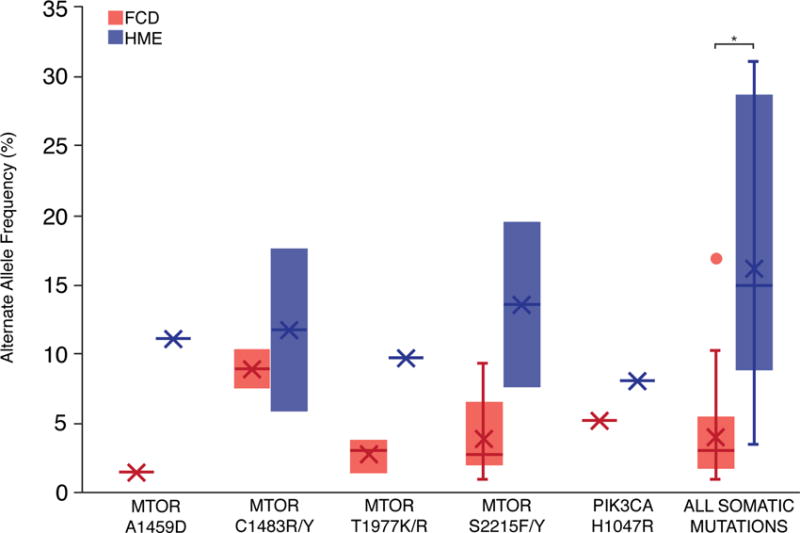
Focal cortical dysplasia (FCD) and hemimegalencephaly (HME) are epileptogenic neurodevelopmental malformations caused by mutations in mTOR pathway genes. Deep sequencing of these genes in FCD/HME brain tissue identified an etiology in 27 of 66 cases (41%). Radiographically indistinguishable lesions are caused by somatic activating mutations in AKT3, MTOR, and PIK3CA and germline loss-of-function mutations in DEPDC5, NPRL2, and TSC1/2, including TSC2 mutations in isolated HME demonstrating a "two-hit" model. Mutations in the same gene cause a disease continuum from FCD to HME to bilateral brain overgrowth, reflecting the progenitor cell and developmental time when the mutation occurred. Single-cell sequencing demonstrated mTOR activation in neurons in all lesions. Conditional Pik3ca activation in the mouse cortex showed that mTOR activation in excitatory neurons and glia, but not interneurons, is sufficient for abnormal cortical overgrowth. These data suggest that mTOR activation in dorsal telencephalic progenitors, in some cases specifically the excitatory neuron lineage, causes cortical dysplasia.

Keywords: brain malformations; cortical development; epilepsy; excitatory neurons; focal cortical dysplasia; hemimegalancephaly; mTOR pathway; next-generation sequencing; single-cell sequencing; somatic mutations.


Conflict of interest statement

Declaration of Interests

H.V.V. owns stock in several pharmaceutical companies and has received honoraria for lectures (no direct conflict with this paper). G.W.M. serves on the Data Management Committee for Neuropace, Inc. I.B. has received honoraria for lectures (no direct conflict with this paper).

Figures

Figure 1
Figure 1. Somatic mutations leading to abnormal activation of the mTOR pathway are identified across a spectrum of somatic cortical dysplasias and a continuum of alternate allele frequencies
(A) Somatic mutations identified in FCD and HME cases in this study and our previous studies (D’Gama et al., 2015; Poduri et al., 2012) are graphed according to the percentage of cells carrying the somatic mutation. (B-M) Magnetic resonance imaging (MRI) of mutation positive cases: FCD-6 (B), FCD-7 (C), HME-11 (D), FCD-14 (E), HME-12 (F), FCD-12 (G), HME-13 (H), HME-15 (I), HME-9 (J), HME-22 (K), HME-16 (L), and HME-14 (M). Although lesions with the lowest mosaicism are all FCD, and those with the highest are all HME, there is substantial overlap, suggesting that they form a continuum in terms of mosaicism. FCD: focal cortical dysplasia; HME: hemimegalencephaly.
Figure 2
Figure 2. Mammalian target of rapamycin (mTOR) pathway and identified pathogenic mutations
Schematic of the mTOR pathway annotated with pathogenic mutations identified by our lab (this study and our previous studies (D’Gama et al., 2015; Poduri et al., 2012)). Somatic mutations are in boldface. FCD: focal cortical dysplasia; HME: hemimegalencephaly, PMG: polymicrogyria. See also Table S3 and S4.
Figure 3
Figure 3. Pathogenic somatic mutations in FCD and HME are always present in the neuronal lineage
Single neuronal and non-neuronal nuclei from Patients FCD-6, FCD-8, FCD-12, FCD-14, HME-16, HME-22, and HME-23 were isolated using an antibody against NeuN, DNA was amplified, and genotyping was performed for the respective pathogenic mutations. The sequencing traces were analyzed to calculate the number of cells with the mutation, taking into account allelic dropout, as described previously (Evrony et al., 2012). P values were calculated from cell counts using a two-tailed Fisher’s exact test; asterisks indicate a significant difference in % cells carrying the mutation between the NeuN+ and NeuN− cell populations for that case. FCD: focal cortical dysplasia; HME: hemimegalencephaly. See also Table S5.
Figure 4
Figure 4. Conditional expression of the activating PIK3CA mutation H1047R in dorsal telencephalic progenitor cells causes cortical enlargement, especially in superficial layers
(A–D) Compared with wild-type P7 cortex (A, C), Emx1-Cre;PIK3CAH1047R/wt P7 cortex (B, D) is larger, with marked gyrification in cingulate cortex, neocortex, and piriform cortex (arrows in B,D). (E–L) Deep-layer gene expression (CTIP2) is normal (E–F), with some heterotopic cells reaching the pial surface (arrow in F). (G-J) Superficial-layer gene expression (Cux1, Satb2) is increased, with significant heterotopias (arrow in H). (M) The total length of the neocortical surface is significantly increased in Emx1-Cre mice compared with wild-type. (N) There is no significant difference in total length of the neocortical surface in Nkx2.1-Cre;(ROSA)26-tdTomato fl/PIK3CA_H1047Rfl P7 cortex compared with wild-type. (O-V) Nkx2.1-Cre P7 cortical lamination is comparable with wild-type P7 cortex, as shown by staining with markers of layers V–VI (CTIP2) and layers II/III and IV (SATB2), and no gyrification is present in the mutant. (W–Z) Interneuron distribution in the mutant cortex layers is comparable to wild-type, as shown by tdTomato-positive cells and Somatostatin (SST) staining. (AA) Interneuron number (tdTomato-positive cells) is significantly reduced in Nkx2.1-Cre P7 cortex compared with wild-type. (BB-EE) Compared with wild-type, most tdTomato-positive recombinant interneurons (red) in the Nkx2.1-Cre P7 cortex are also positive for Phospho-S6 Ribosomal Protein (green), an indicator of mTOR pathway activation. N = 3. Unpaired t-test. * P < 0.05, ** P < 0.01. Data are represented as mean ± SEM. Scale bars, 500 μm (whole hemispheres) and 100 μm (cortex higher magnifications).
Figure 5
Figure 5. FCD and HME represent a continuum, with lesion differences reflecting the time and place of origin of the mutation
(A) Germline mutations occur before fertilization and are detectable in the brain and a clinically accessible blood sample. Germline activating mutations in the mTOR pathway can lead to megalencephaly, as seen in case PMG-1 with a de novo germline MTOR mutation. (B) “Two-hit” germline and somatic mutations in negative regulators of the mTOR pathway can lead to focal MCDs. In some cases, such as HME-11 with two TSC2 mutations, we have identified both a germline and a somatic mutation leading to HME. The germline mutation was detectable in brain and blood, while the somatic mutation occurred later during embryonic development and was detectable only in brain. (C) Activating somatic mutations in positive regulators of the mTOR pathway can also lead to focal MCDs. Those mutations present at a higher AAF, suggesting they arose earlier during cortical neurogenesis, appear more likely to lead to HME; for example, we identify a somatic activating point mutation in PIK3CA present in ≈32% of the cells in the abnormal hemisphere of case HME-22. (D) Mutations present at a lower AAF, suggesting they arose later during cortical neurogenesis, appear more likely to lead to FCD; for example, we identify a somatic activating point mutation in MTOR present in ≈4.9% of the cells in the abnormal cortical tissue of case FCD-6. AAF: alternate allele frequency; FCD: focal cortical dysplasia; HME: hemimegalencephaly, PMG: polymicrogyria.
Figure 6
Figure 6. The relationship between alternate allele frequency and disease phenotype is evident for both individual mutant alleles and overall identified mutations
After performing a literature review to identify all reported mutations associated with FCD and HME and their average AAFs, we identified individual mutant alleles associated with both FCD and HME. Due to the small number of cases associated with each mutant allele, p values were not calculated for individual alleles. Overall, the average AAF for somatic mutations associated with FCD is significantly lower than the average AAF for somatic mutations associated with HME (p<0.0001, two-tailed t test). See also Table S6.

Comment in

References

    1. Aronica E, Crino PB. Epilepsy related to developmental tumors and malformations of cortical development. Neurotherapeutics. 2014;11:251–268. - PMC - PubMed
    1. Baek ST, Copeland B, Yun EJ, Kwon SK, Guemez-Gamboa A, Schaffer AE, Kim S, Kang HC, Song S, Mathern GW, et al. An AKT3-FOXG1-reelin network underlies defective migration in human focal malformations of cortical development. Nature medicine. 2015;21:1445–1454. - PMC - PubMed
    1. Baulac S, Ishida S, Marsan E, Miquel C, Biraben A, Nguyen DK, Nordli D, Cossette P, Nguyen S, Lambrecq V, et al. Familial focal epilepsy with focal cortical dysplasia due to DEPDC5 mutations. Annals of neurology. 2015;77:675–683. - PubMed
    1. Blumcke I, Sarnat HB. Somatic mutations rather than viral infection classify focal cortical dysplasia type II as mTORopathy. Curr Opin Neurol. 2016;29:388–395. - PubMed
    1. Blumcke I, Spreafico R, Haaker G, Coras R, Kobow K, Bien CG, Pfafflin M, Elger C, Widman G, Schramm J, et al. Histopathological Findings in Brain Tissue Obtained during Epilepsy Surgery. N Engl J Med. 2017;377:1648–1656. - PubMed

Publication types

Substances