. 2017 Dec 26;21(13):3807-3818.
doi: 10.1016/j.celrep.2017.11.103.

Serine-Dependent Sphingolipid Synthesis Is a Metabolic Liability of Aneuploid Cells

Affiliations

Serine-Dependent Sphingolipid Synthesis Is a Metabolic Liability of Aneuploid Cells

Sunyoung Hwang et al. Cell Rep. .

Abstract

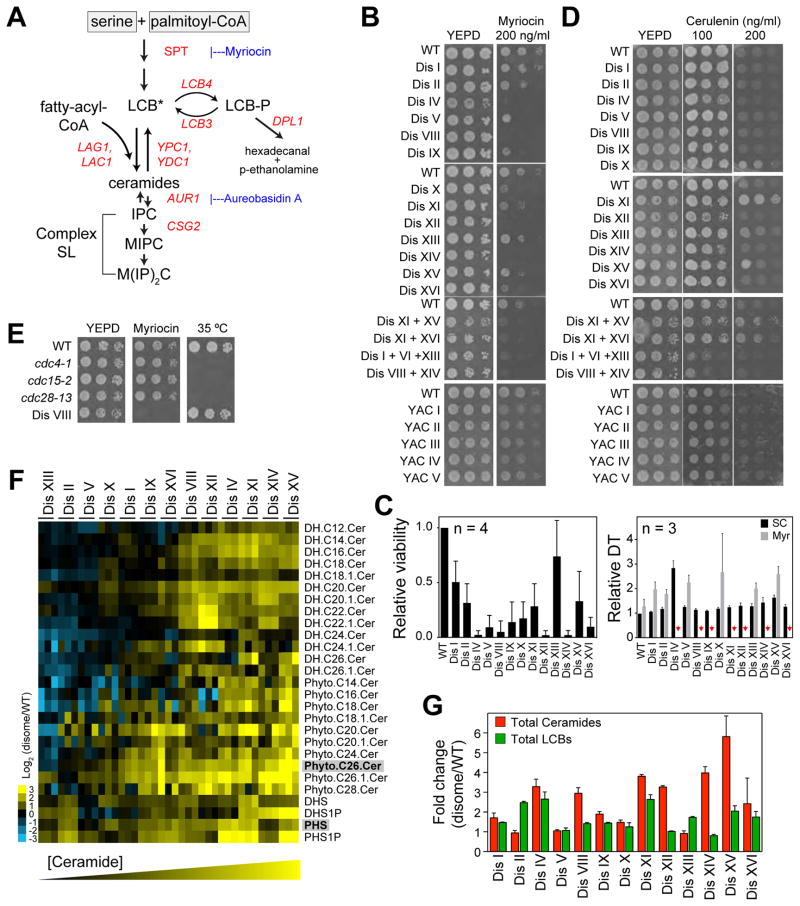
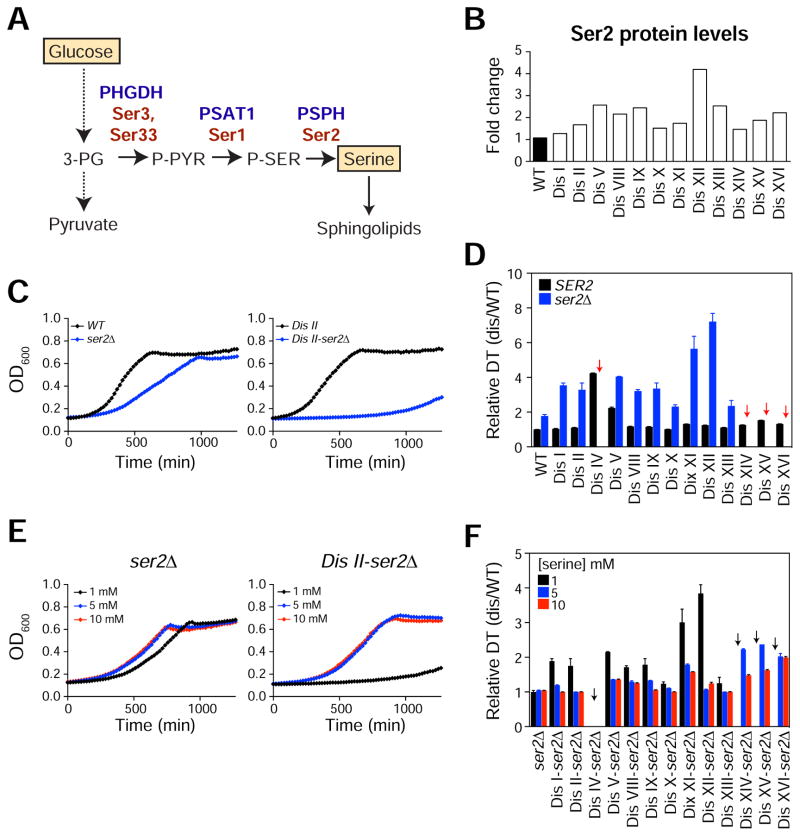
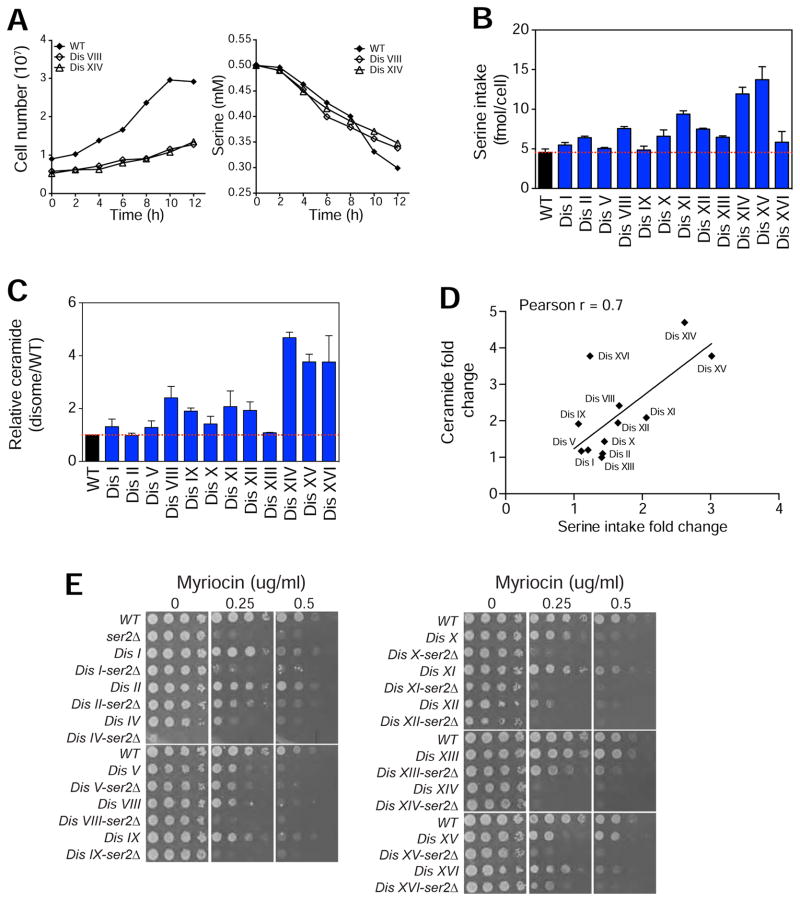
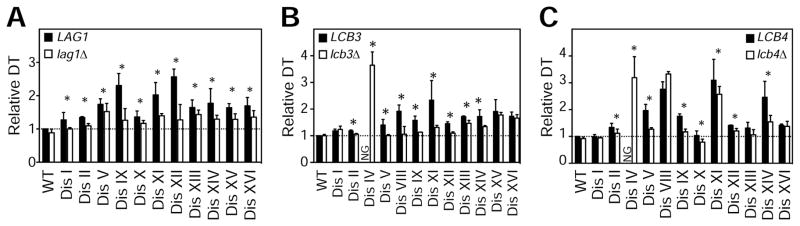
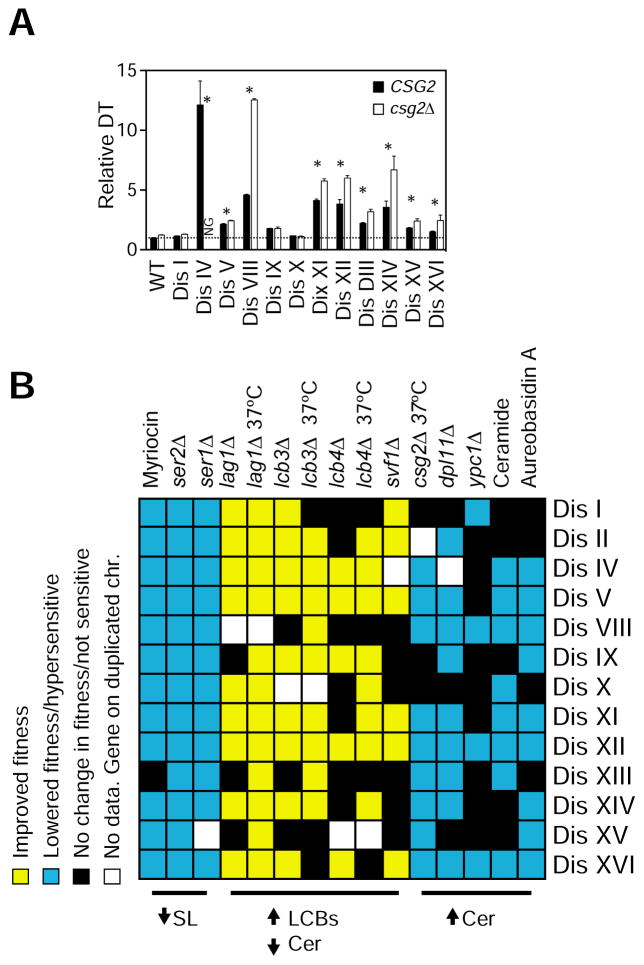
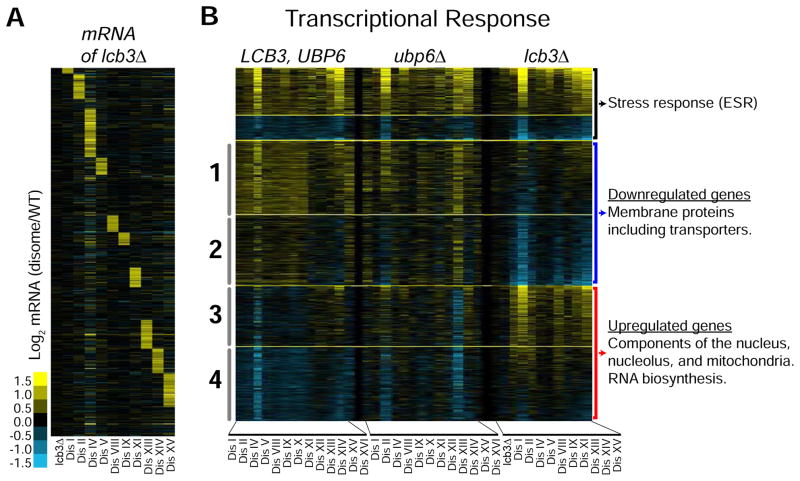
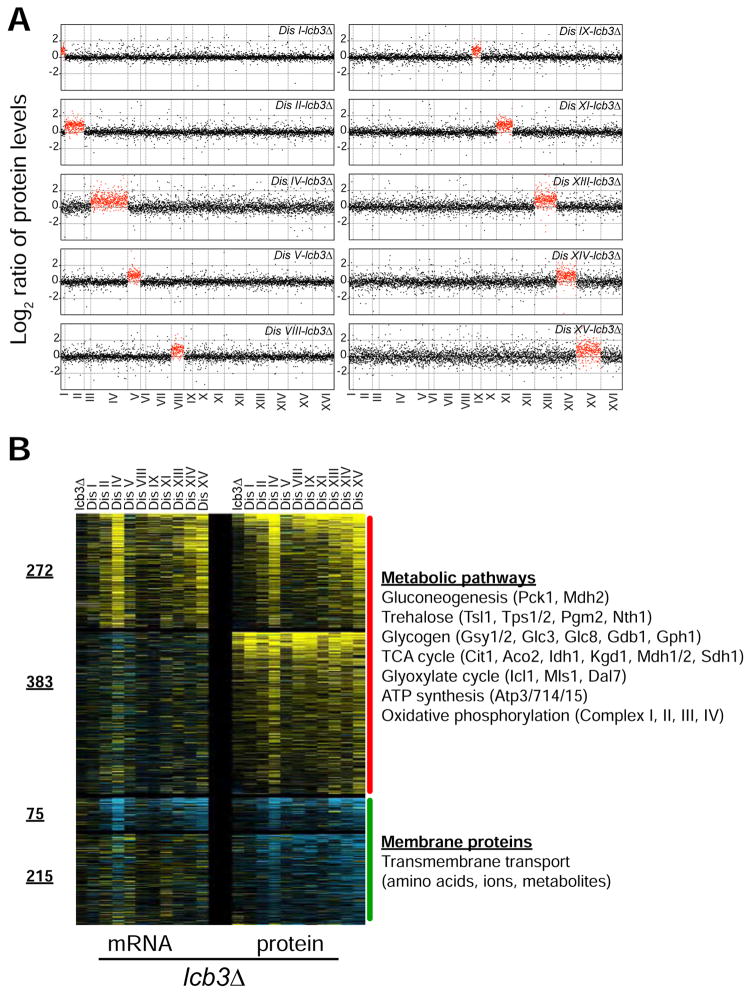
Aneuploidy disrupts cellular homeostasis. However, the molecular mechanisms underlying the physiological responses and adaptation to aneuploidy are not well understood. Deciphering these mechanisms is important because aneuploidy is associated with diseases, including intellectual disability and cancer. Although tumors and mammalian aneuploid cells, including several cancer cell lines, show altered levels of sphingolipids, the role of sphingolipids in aneuploidy remains unknown. Here, we show that ceramides and long-chain bases, sphingolipid molecules that slow proliferation and promote survival, are increased by aneuploidy. Sphingolipid levels are tightly linked to serine synthesis, and inhibiting either serine or sphingolipid synthesis can specifically impair the fitness of aneuploid cells. Remarkably, the fitness of aneuploid cells improves or deteriorates upon genetically decreasing or increasing ceramides, respectively. Combined targeting of serine and sphingolipid synthesis could be exploited to specifically target cancer cells, the vast majority of which are aneuploid.

Keywords: aneuploidy; ceramide; chromosomes; genomic istability; long-chain bases; metabolism; myriocin; serine; sphingolipids; sphingosine.


Figures

Figure 1
Figure 1. Aneuploidy Increases Sphingolipid Biosynthesis
(A) Biochemical pathway of de novo synthesis of sphingolipids in yeast. Genes used in this study are shown in red. SPT, serine palmitoyltransferase; LCB, long-chain bases, asterisk (*) indicates that LCBs need to be phosphorylated/dephosphorylated to be converted to ceramide; IPC, inositol-phosphorylceramide, MIPC, mannosyl-IPC; M(IP)2C, mannosyl-diinositol-phosphorylceramide. (B) Proliferative capability of wild type cells (WT), disomes and strains harboring YAC in the presence of myriocin. (C) Quantification of the viability of cells treated with 200 ng/ml myriocin in the left panel. Right panel shows the doubling times of disomes in synthetic complete media alone (SC, black bars) and with 200 ng/ml myriocin (Myr, gray bars) relative to WT. Red arrows point to strains that did not grow in culture. (D) Proliferative capability of WT, disomes and strains harboring YAC in the presence of cerulenin. (E) Proliferative capability of WT, cell cycle mutants, and disome VIII in the presence of myriocin (200 ng/ml) and at a restrictive temperature for the cell cycle mutants. (F) LC/LC-MS analysis of LCBs and ceramides in the disomes compared to WT. Columns represent experiments (3 biological replicates shown). Rows represent lipid species. DH, dihydro; Cer, ceramide; DHS, dihydrosphingosine; PHS, phytosphigosine. Most abundant LCB and ceramide are in gray boxes. (G) Fold change of total LCBs and ceramides in the disomes relative to WT. Error bars represent +/− standard deviation (SD). See Supplementary Information for details on the strains used in all figures. See also Figure S1 and Tables S1 and S2.
Figure 2
Figure 2. Aneuploid Cells Require Increase Serine Biosynthesis for Their Survival
(A) Biochemical pathway of de novo serine synthesis from glucose. Human genes (blue) and yeast genes (red) are shown. 3PG, 3-phosphoglycerate; P-PYR, phosphohydroxypyruvate; P-SER, phosphoserine. (B) Ser2 protein levels in the disomes relative to WT (Dephoure et al., 2014). (C) Growth curves of cells with wild type SER2 (black line) or harboring ser2Δ (blue line). WT and disome II are shown. (D) Doubling times of disomes (black bars) and disomes harboring ser2Δ (blue bars) relative to WT. Red arrows point to strains that did not grow in culture. Error bars = +/− SD, n = 3. (E) Growth curves of cells harboring ser2Δ in medium containing 1 mM serine (black line), 5 mM serine (blue line) and 10 mM serine (red line). (F) Doubling times of disomes harboring ser2Δ in medium containing 1 mM (black), 5 mM (blue) or 10 mM (red) serine. Error bars = +/− SD, n = 3. Black arrows point to strains that did not grow in culture. See also Figure S2 and Table S3.
Figure 3
Figure 3. Aneuploid Cells Use Serine for the Synthesis of Sphingolipids
(A) Growth curves of WT, disomes VIII and disome XIV are shown in the left panel. Amount of serine in the medium as a function of time (right panel). (B) Serine utilization per cell during exponential growth of WT and disomes. Error bars = +/− SD, n = 3 biological replicates. (C) Relative amount of serine incorporated into ceramides in the disomes relative to WT. Error bars = +/− SD, n = 3 biological replicates. (D) Linear correlation between the fold change in serine intake and fold change in ceramide synthesis in the disomes. (E) Proliferative capability of WT, ser2Δ, disomes, and the disomes harboring ser2Δ in the presence of myriocin. See also Figure S3.
Figure 4
Figure 4. Reduced Ceramide Synthesis Improves the Fitness of Aneuploid Cells
(A) Doubling times of disomes (black bars) and disomes harboring lag1Δ (open bars) relative to WT at 37°C. (B) Doubling times of disomes (black bars) and disomes harboring lcb3Δ (open bars) relative to WT at 37°C. (C) Doubling times of disomes (black bars) and disomes harboring lcb4Δ (open bars) relative to WT at 37°C. The average of 3 biological replicates is shown. Error bars represent +/− standard deviation (SD). * represent p-value < 0.05, paired Student’s t-test. See also Figure S4.
Figure 5
Figure 5. Effects of Shifting the Balance between Ceramide and Long-chain Bases in Aneuploid Strains
(A) Doubling times of disomes (black bars) and disomes harboring csg2Δ (open bars) relative to WT at 37°C. The average of 3 biological replicates is shown. Error bars represent +/− standard deviation (SD). * represent p-value < 0.05, paired Student’s t-test. (B) Summary of the effects of several genes deletions and drugs that target the synthesis of sphingolipids on the fitness of thirteen disomes. See also Figure S5.
Figure 6
Figure 6. Loss of LCB3 Remodels Membrane Protein Composition and Promotes RNA biosynthesis
(A) Gene expression analysis of disomes harboring lcb3Δ grown in batch culture, ordered by chromosome position. Experiments (columns) are ordered by the number of the chromosomes present in two copies. Data were normalized to account for the extra chromosome present in disomic strains. Upregulated genes are show in yellow and downregulated ones in blue. (B) Gene expression of disomes, disome harboring ubp6Δ, and disomes harboring lcb3Δ. Columns represent experiments. Rows are genes organized by pattern of expression of disomes-lcb3Δ compared to the control strains (13 disomes and 13 disomes-ubp6Δ). Top two clusters are up- and downregulated in all 36 strains. Clusters 1 and 2 are downregulated by lcb3Δ. Clusters 3 and 4 are upregulated by lcb3Δ. See Table S4 for GO enrichment analysis details. See also Figure S6 and Table S4.
Figure 7
Figure 7. Loss of LCB3 Remodels Membrane Protein Composition and Promotes Anabolism and Mitochondrial Function
(A) The plots show the log2 ratio of the relative protein abundance of disomes-lcb3Δ compared to WT. Protein levels are shown in the order of the chromosomal location of their encoding genes. Protein levels of duplicated chromosomes are shown in red. (B) Transcript and protein abundances of genes that are specifically up- and down-regulated in the disomes upon the loss of LBC3. See Table S5 for GO enrichment analysis details. See also Figure S7 and Table S5.

Comment in

References

    1. Alvarez-Vasquez F, Sims KJ, Cowart LA, Okamoto Y, Voit EO, Hannun YA. Simulation and validation of modelled sphingolipid metabolism in Saccharomyces cerevisiae. Nature. 2005;433:425–430. - PubMed
    1. Bashore C, Dambacher CM, Goodall EA, Matyskiela ME, Lander GC, Martin A. Ubp6 deubiquitinase controls conformational dynamics and substrate degradation of the 26S proteasome. Nature structural & molecular biology. 2015;22:712–719. - PMC - PubMed
    1. Beach RR, Ricci-Tam C, Brennan CM, Moomau CA, Hsu PH, Hua B, Silberman RE, Springer M, Amon A. Aneuploidy Causes Non-genetic Individuality. Cell. 2017;169:229–242. e221. - PMC - PubMed
    1. Beeler TJ, Fu D, Rivera J, Monaghan E, Gable K, Dunn TM. SUR1 (CSG1/BCL21), a gene necessary for growth of Saccharomyces cerevisiae in the presence of high Ca2+ concentrations at 37 degrees C, is required for mannosylation of inositolphosphorylceramide. Mol Gen Genet. 1997;255:570–579. - PubMed
    1. Bielawski J, Pierce JS, Snider J, Rembiesa B, Szulc ZM, Bielawska A. Comprehensive quantitative analysis of bioactive sphingolipids by high-performance liquid chromatography-tandem mass spectrometry. Methods Mol Biol. 2009;579:443–467. - PubMed

Publication types

LinkOut - more resources