. 2017 Dec 28;15(1):265.
doi: 10.1186/s12967-017-1368-4.

Design and validation of a disease network of inflammatory processes in the NSG-UC mouse model

Affiliations

Design and validation of a disease network of inflammatory processes in the NSG-UC mouse model

Henrika Jodeleit et al. J Transl Med. .

Abstract

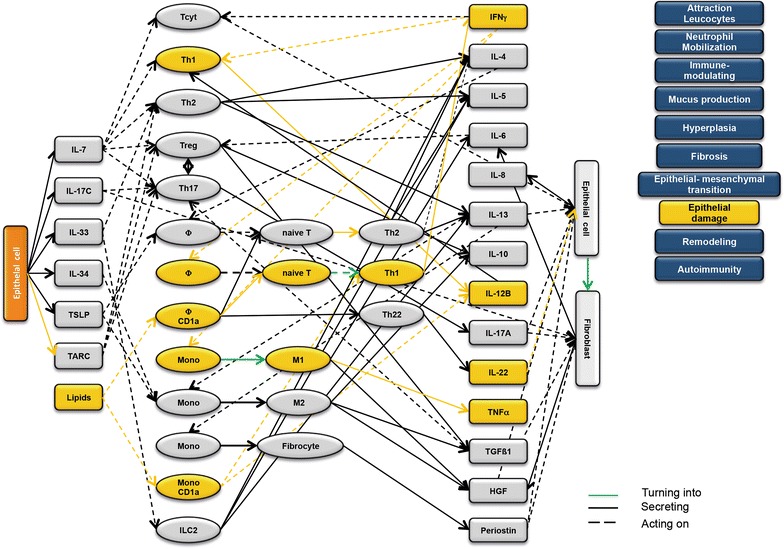
Background: Ulcerative colitis (UC) is a highly progressive inflammatory disease that requires the interaction of epithelial, immune, endothelial and muscle cells and fibroblasts. Previous studies suggested two inflammatory conditions in UC-patients: 'acute' and 'remodeling' and that the design of a disease network might improve the understanding of the inflammatory processes. The objective of the study was to design and validate a disease network in the NOD-SCID IL2rγnull (NSG)-UC mouse model to get a better understanding of the inflammatory processes.

Methods: Leukocytes were isolated from the spleen of NSG-UC mice and subjected to flow cytometric analysis. RT-PCR and RNAseq analysis were performed from distal parts of the colon. Based on these analyses and the effects of interleukins, chemokines and growth factors described in the literature, a disease network was designed. To validate the disease network the effect of infliximab and pitrakinra was tested in the NSG-UC model. A clinical- and histological score, frequencies of human leukocytes isolated from spleen and mRNA expression levels from distal parts of the colon were determined.

Results: Analysis of leukocytes isolated from the spleen of challenged NSG-UC mice corroborated CD64, CD163 and CD1a expressing CD14+ monocytes, CD1a expressing CD11b+ macrophages and HGF, TARC, IFNγ and TGFß1 mRNA as inflammatory markers. The disease network suggested that a proinflammatory condition elicited by IL-17c and lipids and relayed by cytotoxic T-cells, Th17 cells and CD1a expressing macrophages and monocytes. Conversely, the remodeling condition was evoked by IL-34 and TARC and promoted by Th2 cells and M2 monocytes. Mice benefitted from treatment with infliximab as indicated by the histological- and clinical score. As predicted by the disease network infliximab reduced the proinflammatory response by suppressing M1 monocytes and CD1a expressing monocytes and macrophages and decreased levels of IFNγ, TARC and HGF mRNA. As predicted by the disease network inflammation aggravated in the presence of pitrakinra as indicated by the clinical and histological score, elevated frequencies of CD1a expressing macrophages and TNFα and IFNγ mRNA levels.

Conclusions: The combination of the disease network and the NSG-UC animal model might be developed into a powerful tool to predict efficacy or in-efficacy and potential mechanistic side effects.

Keywords: Autoimmunity; Disease network; Inflammatory bowel disease; NSG; NSG-UC; Ulcerative colitis.


Figures

Fig. 1
Fig. 1
NSG mice reconstituted with PBMC from UC donors develop UC like symptoms and phenotype upon challenge with ethanol. A Macrophotographs of colons at autopsy of NSG-UC mice. a Unchallenged control group (control). b Group challenged with 10% ethanol at day 8, and 50% ethanol at days 15 and 18 (ethanol). B Photomicrographs of H&E-stained sections of distal parts of the colon from mice that had been challenged a control, b ethanol. Arrow indicates edema and influx of inflammatory cells. C Clinical- and histological score of control and ethanol challenged mice that had been challenged as described in A depicted as boxplot diagrams. Boxes represent upper and lower quartiles. Whiskers represent variability and outliers are plotted as individual points. Sample sizes: clinical activity score control n = 32, ethanol = 38; histological score: control n = 31, challenged n = 37. For comparison of unchallenged control group versus challenged group, a Student T-test was conducted
Fig. 2
Fig. 2
Inflammation induced by ethanol in NSG mice reconstituted with PBMC from UC patients is characterized by subtypes of monocytes, macrophages, effector memory CD8+ cells and by Mtarc, mTGFß1 and HGF. a Flow cytometric analysis of subtypes of CD14+ monocytes and CD11b+ macrophages of human leukocytes isolated from spleens. Unchallenged control group (control), group challenged with 10% ethanol at day 8 and 50% ethanol at days 15 and 18 (ethanol). For complete data set see Additional file 1: Table S3). Labels given on x-axes on the bottom row apply to all charts. b Correlation analysis of effector memory CD8+ T-cells with clinical activity score and Th17 T-cells depicted as scatter blots. Numbers indicate Spearman rank-order correlation coefficients (rho) and p values. Sample sizes: clinical score n = 29, Th17 n = 25. c mRNA expression analysis of mTARC, mTGFß1 and HGF depicted as boxplots. Lg-delta CT, logarithmic delta cycle threshold. Boxes represent upper and lower quartiles. Whiskers represent variability and outliers are plotted as individual points. For comparison of unchallenged control group versus challenged group, a Student T-test was conducted. Labels given on x- and y-axes on the bottom and the side row apply to all charts
Fig. 3
Fig. 3
Design of disease network based on mRNA expression analysis and effects of cytokines, chemokines and growth factors described in the literature. No signal from epithelial cells
Fig. 4
Fig. 4
Design of disease network based on mRNA expression analysis and effects of cytokines, chemokines and growth factors described in the literature. Activation of proinflammatory pathway by IL-7
Fig. 5
Fig. 5
Design of disease network based on mRNA expression analysis and effects of cytokines, chemokines and growth factors described in the literature. Activation of proinflammatory pathway by IL-17c
Fig. 6
Fig. 6
Design of disease network based on mRNA expression analysis and effects of cytokines, chemokines and growth factors described in the literature. Potential pathway induction by lipids
Fig. 7
Fig. 7
Design of disease network based on mRNA expression analysis and effects of cytokines, chemokines and growth factors described in the literature. Activation of remodeling pathway by IL-34
Fig. 8
Fig. 8
Design of disease network based on mRNA expression analysis and effects of cytokines, chemokines and growth factors described in the literature. Stimulation of remodeling pathway by TSLP
Fig. 9
Fig. 9
Design of disease network based on mRNA expression analysis and effects of cytokines, chemokines and growth factors described in the literature. Attraction and stimulation of remodeling pathway by TARC
Fig. 10
Fig. 10
Design of disease network based on mRNA expression analysis and effects of cytokines, chemokines and growth factors described in the literature. Activation of remodeling pathway by IL-33
Fig. 11
Fig. 11
Design of disease network based on mRNA expression analysis and effects of cytokines, chemokines and growth factors described in the literature. Blockade of TNFα leads to inhibition of the proinflammatory pathway whereas the remodeling pathway remains unaffected
Fig. 12
Fig. 12
Design of disease network based on mRNA expression analysis and effects of cytokines, chemokines and growth factors described in the literature. Blockade of IL-4Rα1 receptor leads to inhibition of the remodeling pathway and promotes the proinflammatory pathway
Fig. 13
Fig. 13
Treatment infliximab or pitrakinra had different effects in NSG mice reconstituted with PBMC from UC patients. A Photomicrographs of H&E-stained sections of distal parts of the colon from mice that had been reconstituted with PBMC from patients with UC, challenged with ethanol and treated with a infliximab, b pitrakinra. Mice were treated by intraperitoneal application of pitrkinra on days 7–9 and 14–21 and PBS were used as carrier control. Infliximab was applied by intraperitoneal injection on day 7, 14, 17 and isotype was used as a control. Arrows indicate edema and influx of inflammatory cells. B Depiction of clinical- and histological score as boxplots. Boxes represent upper and lower quartiles, whiskers represent variability and outliers are plotted as individual points. Unchallenged control (control), challenged control (ethanol + PBS/isotype), challenged and treated (ethanol + infliximab/pitrakinra). For comparison of groups ANOVA followed by TukeyHSD was conducted. Labels given on y-axes on the bottom apply to all charts
Fig. 14
Fig. 14
Treatment infliximab or pitrakinra had different effects in NSG mice reconstituted with PBMC from UC patients. Flow cytometric analysis of frequencies of subtypes of CD11b+ macrophages and CD14+ monocytes depicted as boxplots. Mice were treated as described in Fig. 13. For complete data set see Additional file 1: Tables S4, S5). Boxes represent upper and lower quartiles, whiskers represent variability and outliers are plotted as individual points. Unchallenged control (control), challenged control (ethanol + PBS/isotype), challenged and treated (ethanol + infliximab/pitrakinra). For comparison of groups ANOVA followed by TukeyHSD was conducted. Labels given on x- and y-axes on the bottom and the side row apply to all charts
Fig. 15
Fig. 15
Treatment infliximab or pitrakinra had different effects in NSG mice reconstituted with PBMC from UC patients. mRNA expression levels of TGFß1, HGF, TARC, IFNγ and TNFa as boxplots. Mice were treated as described in Fig. 13. For complete data set see Additional file 1: Tables S4, S5). Lg-delta CT, logarithmic delta cycle threshold. Boxes represent upper and lower quartiles, whiskers represent variability and outliers are plotted as individual points. Unchallenged control (control), challenged control (ethanol + PBS/isotype), challenged and treated (ethanol + infliximab/pitrakinra). For comparison of groups ANOVA followed by TukeyHSD was conducted. Labels given on x- and y-axes on the bottom and the side row apply to all charts

Similar articles

Cited by

References

    1. Jovanovic K, Siebeck M, Gropp R. The route to pathologies in chronic inflammatory diseases characterized by T helper type 2 immune cells. Clin Exp Immunol. 2014;178:201–211. doi: 10.1111/cei.12409. - DOI - PMC - PubMed
    1. Fuss IJ, Strober W. The role of IL-13 and NK T cells in experimental and human ulcerative colitis. Mucosal Immunol. 2008;1(Suppl 1):S31–S33. doi: 10.1038/mi.2008.40. - DOI - PMC - PubMed
    1. Heller F, Florian P, Bojarski C, Richter J, Christ M, Hillenbrand B, Mankertz J, Gitter AH, Burgel N, Fromm M, et al. Interleukin-13 is the key effector Th2 cytokine in ulcerative colitis that affects epithelial tight junctions, apoptosis, and cell restitution. Gastroenterology. 2005;129:550–564. doi: 10.1016/j.gastro.2005.05.002. - DOI - PubMed
    1. Fohlinger M, Palamides P, Mansmann U, Beigel F, Siebeck M, Gropp R. Immunological profiling of patients with ulcerative colitis leads to identification of two inflammatory conditions and CD1a as a disease marker. J Transl Med. 2016;14:310. doi: 10.1186/s12967-016-1048-9. - DOI - PMC - PubMed
    1. Dong Z, Du L, Xu X, Yang Y, Wang H, Qu A, Qu X, Wang C. Aberrant expression of circulating Th17, Th1 and Tc1 cells in patients with active and inactive ulcerative colitis. Int J Mol Med. 2013;31:989–997. doi: 10.3892/ijmm.2013.1287. - DOI - PubMed

Publication types

MeSH terms