

Glycosphingolipid metabolic reprogramming drives neural differentiation
- PMID: 29282205
- PMCID: PMC5881633
- DOI: 10.15252/embj.201797674
Glycosphingolipid metabolic reprogramming drives neural differentiation
Abstract
Neural development is accomplished by differentiation events leading to metabolic reprogramming. Glycosphingolipid metabolism is reprogrammed during neural development with a switch from globo- to ganglio-series glycosphingolipid production. Failure to execute this glycosphingolipid switch leads to neurodevelopmental disorders in humans, indicating that glycosphingolipids are key players in this process. Nevertheless, both the molecular mechanisms that control the glycosphingolipid switch and its function in neurodevelopment are poorly understood. Here, we describe a self-contained circuit that controls glycosphingolipid reprogramming and neural differentiation. We find that globo-series glycosphingolipids repress the epigenetic regulator of neuronal gene expression AUTS2. AUTS2 in turn binds and activates the promoter of the first and rate-limiting ganglioside-producing enzyme GM3 synthase, thus fostering the synthesis of gangliosides. By this mechanism, the globo-AUTS2 axis controls glycosphingolipid reprogramming and neural gene expression during neural differentiation, which involves this circuit in neurodevelopment and its defects in neuropathology.
Keywords: AUTS2; bistability; epigenetics; glycosphingolipids; neural differentiation.
© 2017 The Authors.
Figures
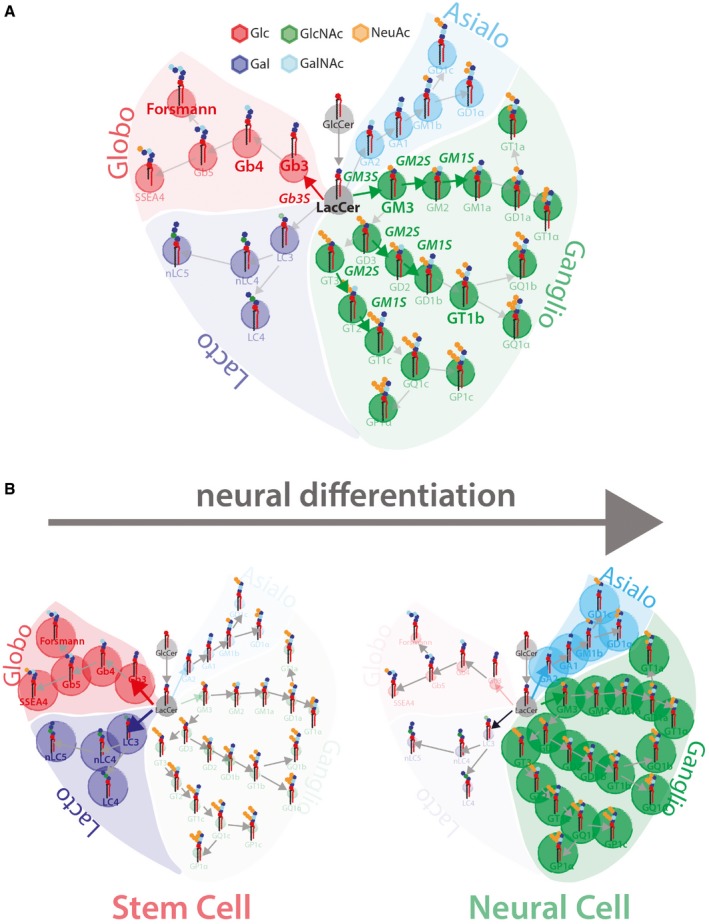
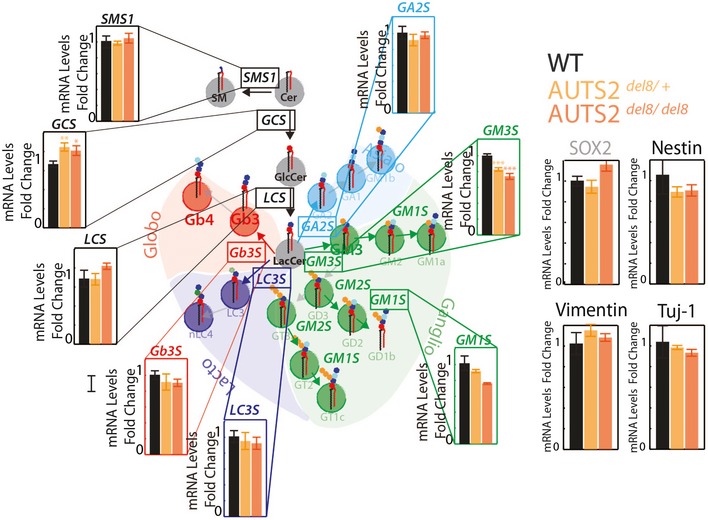
Schematic representation of GSL metabolism (Glc, glucose; Gal, galactose; GlcNAc, N‐acetylglucosamine; GalNAc, N‐acetylgalactosamine; NeuAc, N‐acetylneuraminic acid). Grey circles indicate GSL precursors GlcCer and LacCer, green circles indicate ganglio‐series GSLs, red circles indicate globo‐series GSLs, cyan circles indicate asialo‐series GSLs, and blue circles indicate lacto‐series GSLs.
Schematic representation of GSL reprogramming in neural differentiation. Stem cells prevalently produce lacto‐ and globo‐series GSLs (left panel), while neurons prevalently produce ganglio‐ and asialo‐series GSLs (right panel).
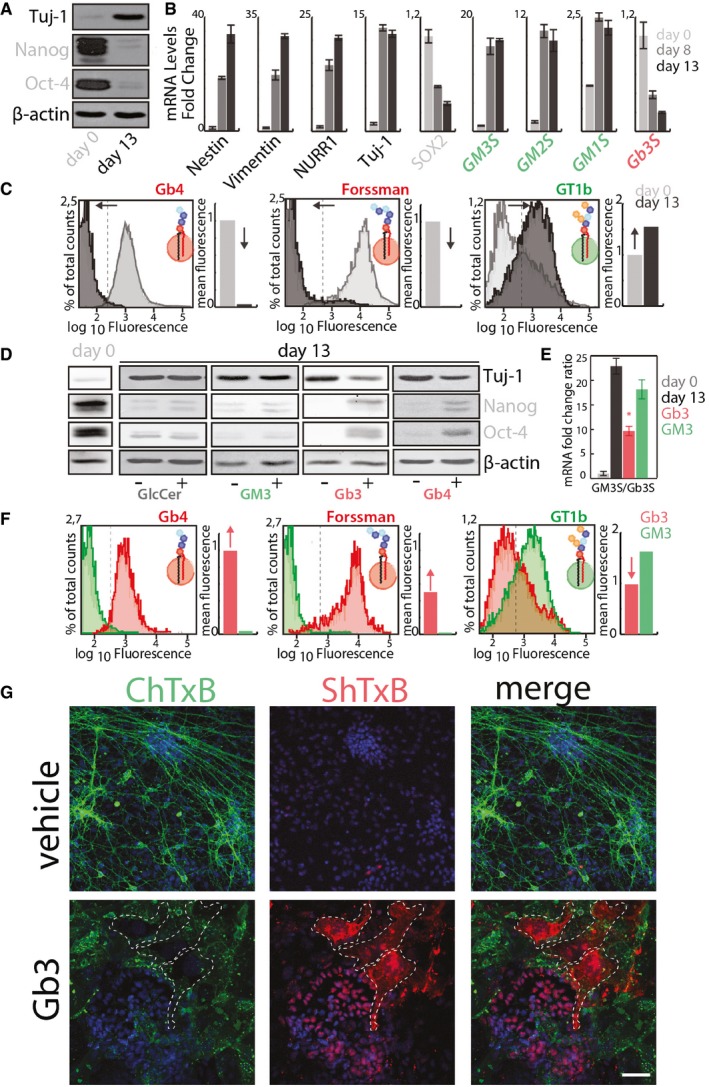
E14‐mESCs in an undifferentiated state (day 0) or induced to differentiate into neurons for 13 days were processed for Western blotting to evaluate the expression of neural (i.e. Tuj‐1) and stemness (i.e. Nanog, and Oct4) markers.
The mRNA levels of neuronal markers (black); stemness markers (grey); ganglio‐series synthesising enzymes (green); globo‐series GSL‐synthesising enzymes (red) were evaluated in cells treated as in (A). Data are means ± SD of at least three independent experiments.
E14‐mESCs treated as in (A) were analysed by cytofluorometry with antibodies directed against globo‐series GSLs (i.e. Gb4 and Forssman) or the ganglioside GT1b. Cytofluorimetric profiles and normalised mean fluorescence are shown for each antibody at day 0 (grey) and at day 13 (black). Arrows indicate the direction of changes observed during neural differentiation.
E14‐mESCs were induced to differentiate into neurons over 13 days in presence of the indicated GSLs (25 μM) or vehicle (methanol). Subsequently, cells were processed for Western blotting as in (A).
E14‐mESCs treated as in (D) were processed for RNA extraction. The mRNA levels for Gb3S and GM3S were evaluated by qPCR. GM3S/Gb3S mRNA ratios are shown. Day 0 (grey); day 13 + vehicle (black); day 13 + Gb3 (red); day 13 + GM3 (green). Data are means ± SD of at least three independent experiments. *P ≤ 0.05.
E14‐mESCs treated as in (E) were analysed by cytofluorometry after 13 days of differentiation with antibodies directed against globo‐series GSLs (i.e. Gb4 and Forssman) or the ganglioside GT1b. Cytofluorimetric profiles and normalised mean fluorescence are shown for each antibody for cells treated with Gb3 (red) or GM3 (green). Red arrows indicate changes induced by Gb3 treatment.
E14‐mESCs treated with Gb3 or vehicle were stained with ChTxB‐Alexa488 (green), ShTxB‐Cy3 (red), and DAPI (blue). Dashed lines indicate ShTxB‐positive cell perimeters. Scale bar, 50 μm.
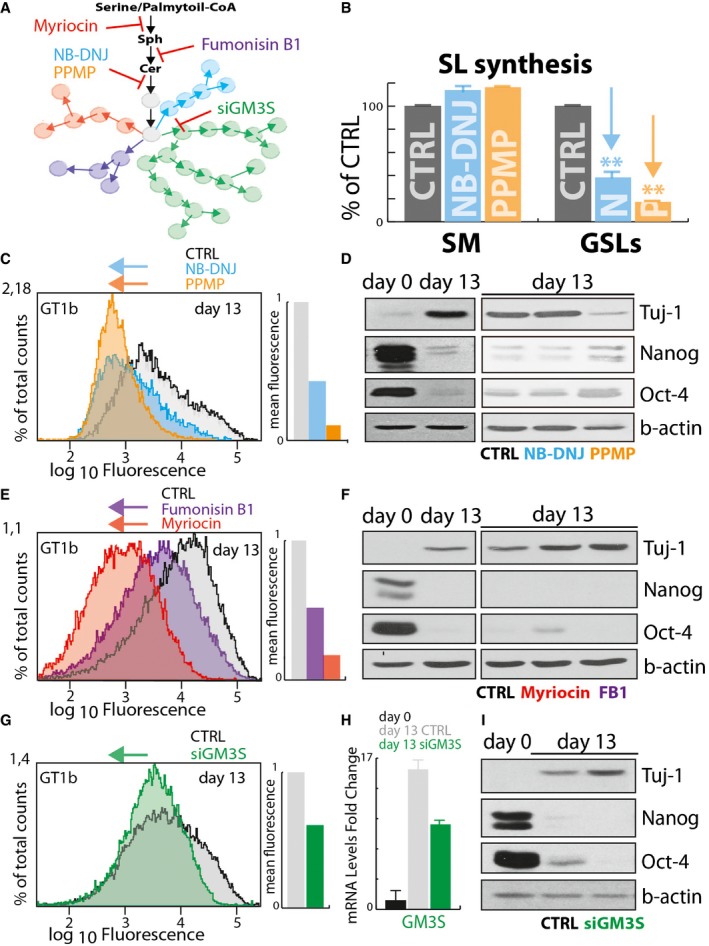
Schematic representation of Myriocin, Fumonisin B1, NB‐DNJ, PPMP, and GM3S silencing (siGM3S) mediated inhibition of GSL synthesis.
Effect of NB‐DNJ (25 μM) and PPMP (2.5 μM) treatment on sphingolipid synthesis in E14‐mESCs. E14‐mESC control, treated with NB‐DNJ or PPMP, was pulse‐labelled as for 8 h with [3H]‐sphingosine. Sphingomyelin (SM) and GSL synthesis in control (grey), NB‐DNJ (cyan)‐, and PPMP (orange)‐treated cells are expressed as percentage of control ± SD from three independent experiments. **P ≤ 0.01.
E14‐mESCs induced to differentiate into neurons over 13 days in the presence of NB‐DNJ (25 μM) or PPMP (2.5 μM) were analysed by cytofluorometry with antibodies directed against the ganglioside GT1b. Cytofluorimetric profiles are shown for cells treated with NB‐DNJ (cyan), or PPMP (orange) or with vehicle (grey). Arrows indicate the direction of changes induced by each treatment.
E14‐mESCs were kept in an undifferentiated state (day 0) or induced to differentiate into neurons over 13 days in the presence of NB‐DNJ (25 μM), PPMP (2.5 μM), or vehicle (methanol). Subsequently, cells were lysed and lysates were processed for SDS–PAGE and immunoblotting using antibodies against the stemness markers Oct‐4, and Nanog and the neuronal marker Tuj‐1.
E14‐mESCs induced to differentiate into neurons in the presence of Myriocin (2.5 μM) or Fumonisin B1 (FB1) (25 μM) were analysed as in (C). Cytofluorimetric profiles are shown for cells treated with Myriocin (red), or FB1 (purple) or with vehicle (grey). Arrows indicate the direction of changes induced by treatments.
E14‐mESCs in an undifferentiated state (day 0) or induced to differentiate into neurons in presence of Myriocin (2.5 μM), Fumonisin B1 (FB1) (25 μM), or vehicle (methanol). Subsequently, cells were lysed and lysates were processed as in (D).
E14‐mESCs induced to differentiate into neurons and subjected every 3 days to GM3S silencing by transfecting specific siRNA for murine GM3S mRNA (siGM3S) were analysed by cytofluorometry as in (C). Cytofluorimetric profiles are shown for cells treated with non‐targeting siRNA (grey), or with specific siGM3S (green). Arrows indicate the direction of changes induced by treatments.
E14‐mESCs were induced to differentiate into neurons and transfected every 3 days with siGM3S were subjected to RNA extraction and RT–PCR to evaluate the efficiency of murine GM3S silencing. Data are means ± SD from two independent experiments.
E14‐mESCs treated as in (G) were lysed, and lysates were processed for SDS–PAGE and immunoblotting as in (D).
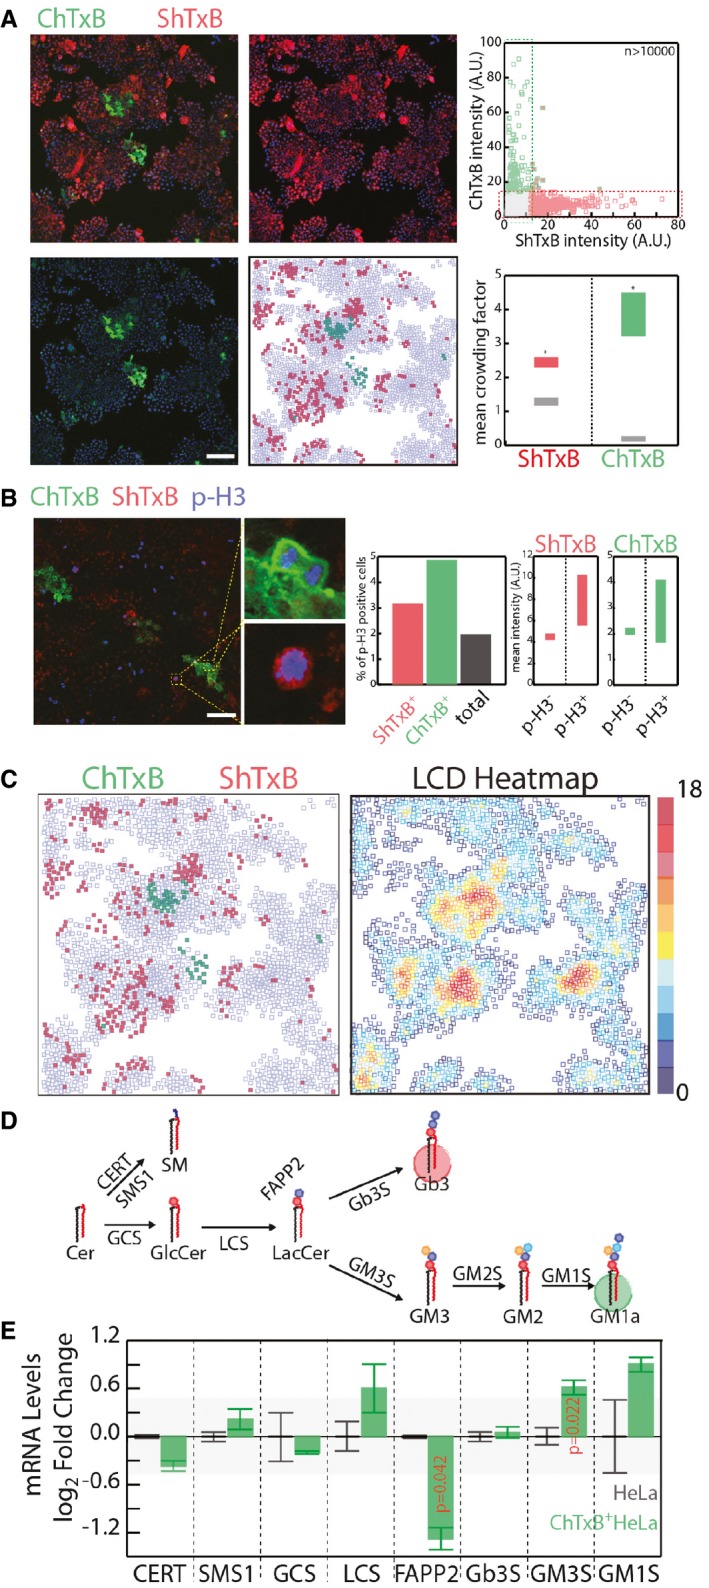
HeLa cells were fixed and stained with ChTxB‐Alexa488 (green), ShTxB‐Cy3 (red), and DAPI (blue). Acquired confocal images were segmented by CellProfiler software (Shannon et al, 2003), as detailed in the Appendix. Mean ChTxB‐ and ShTxB‐associated fluorescence intensity was calculated for each cell. Cells with ChTxB or ShTxB fluorescence intensity ≥ 15% maximal recorded fluorescence intensity were considered ChTxB‐positive (green squares), ShTxB‐positive (red squares), or double‐positive (green‐edged red squares), with double‐negative cells represented by empty squares (central‐low panel). Scale bar, 100 μm. Upper right: ChTxB versus ShTxB fluorescence mean intensity for 10,767 individual cells as a scatter plot. Bottom right: as a measure of the degree of clustering of ChTxB (or ShTxB)‐positive cells, the colony factor (defined in Appendix Methods) was calculated for 272 ChTxB‐positive and 2,334 ShTxB‐positive cells. The mean crowding factors ± 3 × SEM for ChTxB‐positive cells (green rectangle) and ShTxB‐positive cells (red rectangle) are indicated. The experimentally obtained colony factors were then compared with the randomly expected colony factors, as defined in Appendix Methods (lower right panel, grey rectangles). *P ≤ 0.05.
Left panels: HeLa cells were fixed and subsequently stained with ChTxB‐Alexa488 (green), ShTxB‐Cy3 (red), anti‐phospho‐Ser10 histone‐H3 (pH3) as a marker of G2/M phase cells (blue) and DAPI (not shown). Insets show examples of pH3+/ChTxB+ and pH3+/ShTxB+ cells, which indicate that both ChTxB positivity and ShTxB positivity are compatible with G2/M phase cells. Acquired confocal images were segmented using the CellProfiler software (Shannon et al, 2003). Middle panel: mean pH3‐, ChTxB‐, and ShTxB‐associated fluorescence intensities were calculated for 4,051 cells. Individual cells showing an associated ChTxB or ShTxB fluorescence intensity ≥20% (pH3) and ≥15% (ShTxB, ChTxB) maximal recorded fluorescence intensity were considered pH3‐, ChTxB‐, and ShTxB‐positive. The percentages of pH3+ cells in the total population (black column) and in the ShTxB+ (red) and ChTxB+ (green) populations are reported. Right panels: the ChTxB and ShTxB associated mean intensities in the pH3+ and pH3− cell subpopulations. Scale bar, 100 μm.
The image dataset obtained in (A) was used to correlate ChTxB and ShTxB staining with local cell density (LCD; defined as the number of cells within a 50 × 50‐pixel [69.19 × 69.19 μm] square drown around each cell) for each individual cell imaged. ChTxB‐ and ShTxB‐positive cell distribution obtained from a representative image (left) and the LCD heatmap (right) obtained for the same image.
Schematic representation of the GSL synthetic pathway in HeLa cells. GCS, GlcCer synthase; LCS, LacCer synthase; Gb3S, Gb3 synthase; GM3S, GM3 synthase; SMS1, sphingomyelin synthase 1; CERT, ceramide transfer protein; FAPP2, four phosphate adaptor protein 2.
Transcriptional profile of GSEs and accessory factors (i.e. CERT, FAPP2) in ChTxB+ HeLa cells (isolated as reported in the Appendix), evaluated by qPCR. mRNA levels are expressed as log2‐fold changes ± SD with respect to unsorted HeLa cells. The background shaded area delimits values ranging from −0.5 to 0.5 log2 fold change. Data are means ± SD from at least three independent experiments.
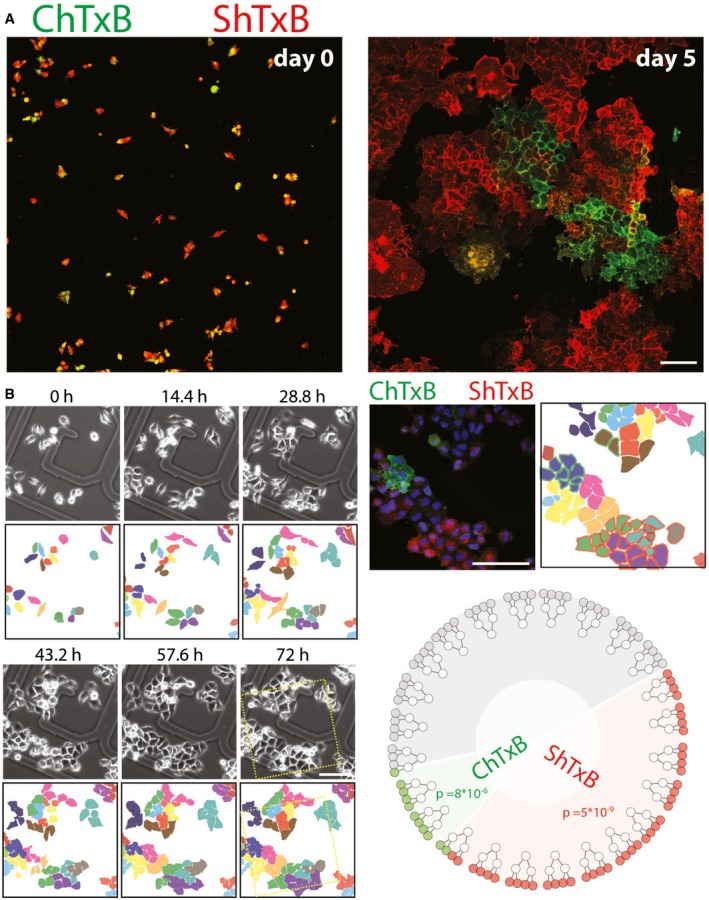
ChTxB and ShTxB double‐positive cells were isolated by FACS and seeded, and either imaged immediately (left panel) or after 5 days of growth (right panel) as in Fig 3A. Scale bar, 50 μm.
HeLa cells plated on gridded glass‐bottomed tissue culture dishes and imaged by phase contrast microscopy over 72 h (see also Movie EV1). After fixing, the cells were stained with Alexa488‐ChTxB (green), Cy3‐ShTxB (red), and DAPI (blue). Confocal images were acquired of the same fields imaged by video microscopy. Scale bar, 50 μm. Twenty‐four cells were followed for two cell divisions, to yield 96 daughter cells, where the ShTxB positivity and ChTxB positivity were assessed by confocal microscopy. The dendrogram (bottom right) shows how 10/24 cells gave only ShTxB‐positive offspring, 2/24 gave only ChTxB‐positive offspring, 10/24 gave double‐negative offspring, and only two parental cells gave mixed offspring. The probability of 10/24 parental cells to randomly yield a ShTxB‐only positive offspring and the probability of 2/24 parental cells to randomly yield a ChTxB‐only positive offspring are indicated in the dendrogram and are calculated as detailed in Appendix Methods.
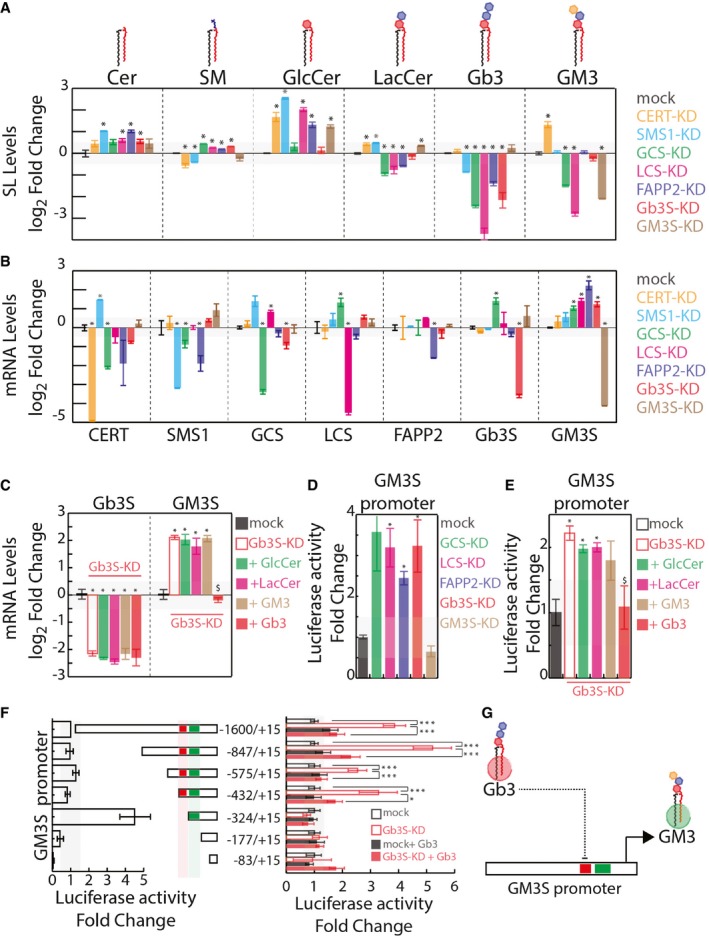
Effects of silencing GSEs and accessory factors on cellular sphingolipid (SL) composition (measured as detailed in the Appendix and expressed as log2‐fold changes ± SEM to mock‐treated cells from at least three independent experiments). *P ≤ 0.05.
Effects of silencing GSEs and accessory factors on mRNA levels of other GSEs and accessory factors (measured as detailed in the Appendix and expressed as log2‐fold changes ± SEM to mock‐treated cells from at least three independent experiments). *P ≤ 0.05.
HeLa cells were either mock‐treated or silenced for Gb3S expression. Gb3S‐KD cells were then either vehicle‐treated or fed with the indicated GSLs (10 μM). GM3S and Gb3S mRNA levels (as log2‐fold changes ± SEM to mock) under the different treatments are reported. *P ≤ 0.05 compared to mock; $ P ≤ 0.05 compared to Gb3S‐KD. Data are from at least three independent experiments.
HeLa cells transfected with a plasmid containing a genomic region of 1600‐bp upstream of the GM3S TSS cloned upstream of a luciferase reporter were silenced for factors involved in Gb3 synthesis or GM3S as control. Normalised luciferase activity was recorded as detailed in Appendix and is reported as fold changes ± SEM to mock‐treated cell‐associated activity. *P ≤ 0.05 compared to mock. Data are from at least three independent experiments.
HeLa cells transfected as in (C) were silenced for Gb3S expression and fed with the indicated GSLs (10 μM). Normalised luciferase activity is reported as fold change ± SEM to mock‐treated cell‐associated activity. *P ≤ 0.05 compared to mock; $ P ≤ 0.05 compared to Gb3S‐KD. Data are from at least three independent experiments.
Left panel: normalised luciferase activity associated with truncated versions of the GM3S promoter was compared to pGL3‐1600/+15 activity. Right panel: the same promoter fragments were transfected into HeLa cells as mock‐treated or Gb3S‐KD, and either vehicle‐treated or fed with 10 μM Gb3. Normalised luciferase activity was compared to that in mock‐treated HeLa cells for each fragment. *P ≤ 0.05, ***P ≤ 0.001. Data are means ± SEM of at least three independent experiments.
Schematic representation of Gb3‐operated repression on GM3S promoter activity.
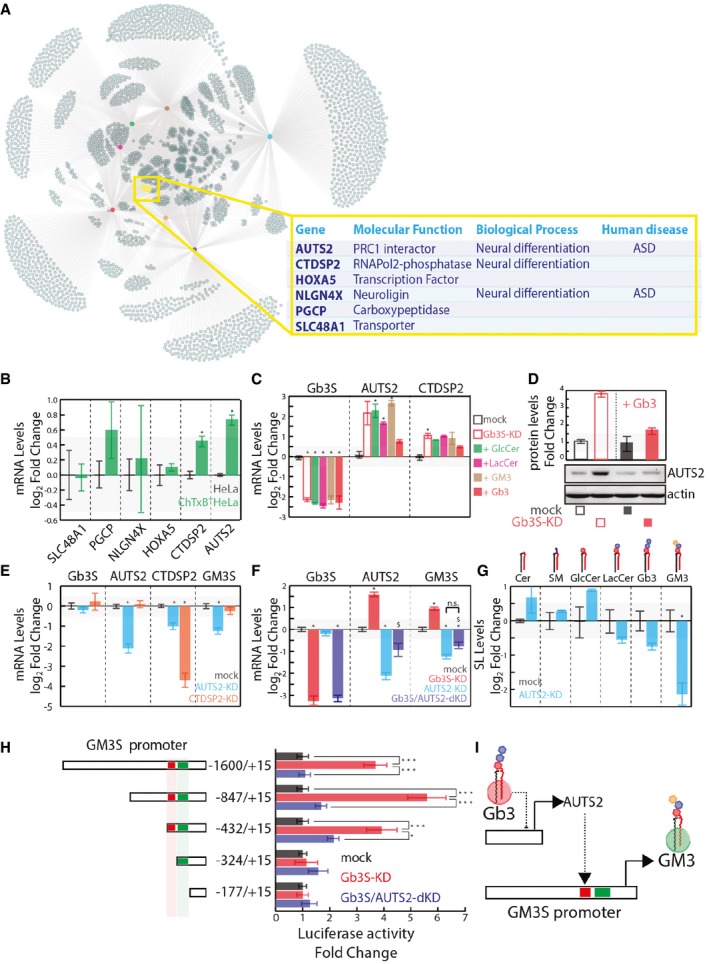
Up‐regulated genes as defined in Appendix Fig S2 and Dataset EV1 were used to build a network, hubs are conditions colour coded as indicated, nodes are up‐regulated genes, and edges link each condition with the up‐regulated genes. The yellow subset represents genes commonly up‐regulated in GCS‐KD, LCS‐KD, FAPP2‐KD, and Gb3S‐KD and not up‐regulated in GM3S‐KD, CERT‐KD, and SMS1‐KD.
mRNA expression of the gene set defined in (A) in ChTxB+ HeLa cells (isolated as reported in the Appendix), expressed as log2 mRNA fold changes ± SD to the unsorted parental population from three independent experiments. *P ≤ 0.05.
Gb3S‐KD HeLa cells were either vehicle‐treated or fed with different GSLs (i.e. GlcCer, LacCer, GM3, Gb3). CTDSP2 and AUTS2 mRNA levels (log2‐fold changes ± SD to mock from at least three independent experiments) are reported. *P ≤ 0.05 compared to mock.
HeLa cells mock‐treated or Gb3S‐KD were either vehicle‐treated or fed with 10 μM Gb3 (16 h) and lysed, with the protein extracts analysed for AUTS2 protein expression.
HeLa cells silenced for the expression of AUTS2 or CTDSP2 were processed for mRNA extraction and qPCR. Gb3S, AUTS2, CTDSP2, and GM3S mRNA levels under the different conditions are reported, as log2‐fold changes to mock. Data are means ±SEM of at least three independent experiments. *P ≤ 0.05.
HeLa cells were silenced for AUTS2 both in control cells and in cells silenced for Gb3S. Gb3S, AUTS2, and GM3S mRNA levels are expressed as log2‐fold changes to mock‐treated cells. Data are means ± SD from at least three independent experiments. *P ≤ 0.05 to mock; $ P ≤ 0.05 to Gb3S‐KD; n.s., non significant.
Effects of AUTS2 silencing on cellular SL composition (expressed as log2‐fold changes with respect to mock‐treated cells). Data are means ±SEM of at least three independent experiments. *P ≤ 0.05.
HeLa cells transfected with the indicated truncated forms of GM3S promoter cloned upstream of the luciferase reporter gene were either silenced for Gb3S alone or in combination with AUTS2. Normalised luciferase activity was compared to that obtained in mock‐treated HeLa cells for each fragment. Data are means ±SEM of at least three independent experiments. ***P ≤ 0.001, *P ≤ 0.05.
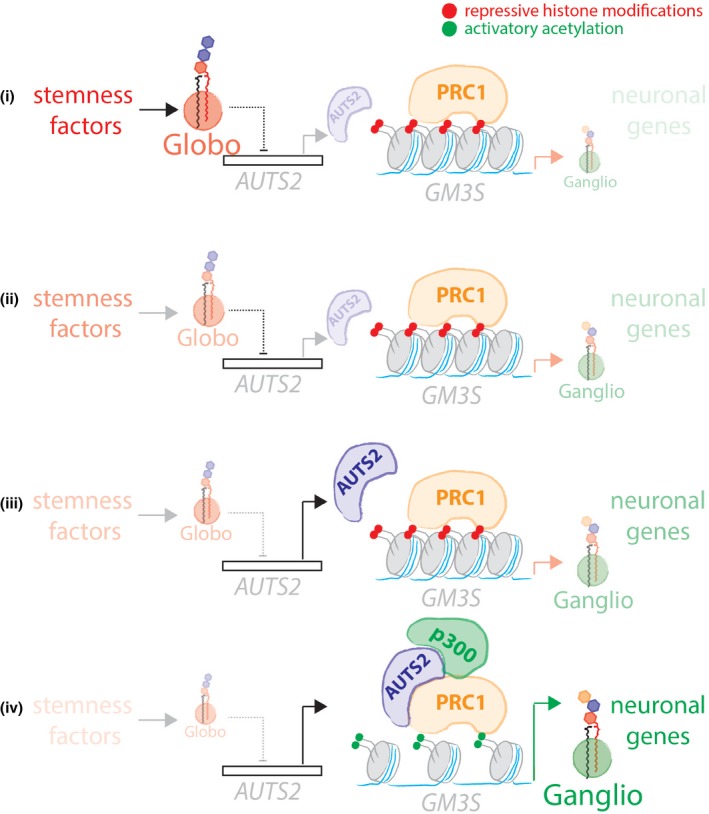
Schematic representation of the Gb3‐controlled AUTS2‐dependent GM3S expression.
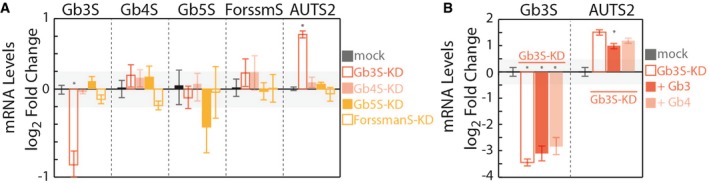
Effects of silencing globoside‐synthesising enzymes Gb3S, Gb4 synthase (Gb4S), Gb5 synthase (Gb5S), and Forssman antigen synthase (ForssmanS or ForssmS) on mRNA levels of AUTS2. Silenced cells were subjected to RNA extraction and RT–PCR to evaluate both the efficiency of silencing and AUTS2 mRNA up‐regulation (measured as detailed in the Appendix and expressed as log2‐fold changes to mock‐treated cells). Data are means ± SD from at least three independent experiments. *P ≤ 0.05 compared to mock treated cells.
Effect of exogenous Gb3 and Gb4 on AUTS2 expression in Gb3S‐KD cells. HeLa cells were either mock‐treated or silenced for Gb3S expression. Gb3S‐KD cells were then either vehicle‐treated or fed with the indicated GSLs (10 μM). Gb3S and AUTS2 mRNA levels (as log2‐fold changes to mock) under the different treatments are reported. Data are means ± SD from at least three independent experiments. *P ≤ 0.05 compared to Gb3S‐KD.
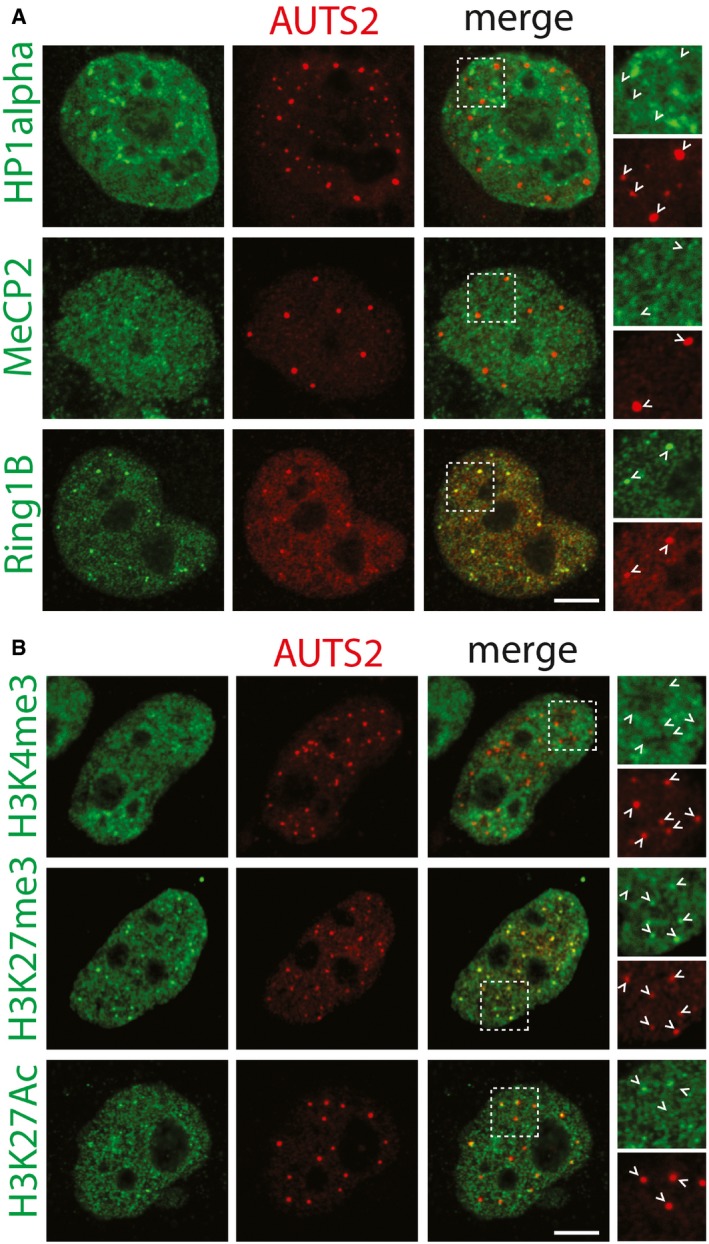
Antibodies recognising endogenous MeCP2, HP1alpha, and Ring1B (green) were used to evaluate co‐localisation with AUTS2 detected by an anti‐Flag antibody (red). Scale bar, 5 μm. Arrowheads indicate AUTS2 positive puncta.
Antibodies recognising H3K4me3, H3K27me3, and H3K27Ac (green) were used to evaluate co‐localisation with AUTS2 detected by an anti‐Flag antibody (red). Scale bar, 5 μm. Arrowheads indicate AUTS2 positive puncta.
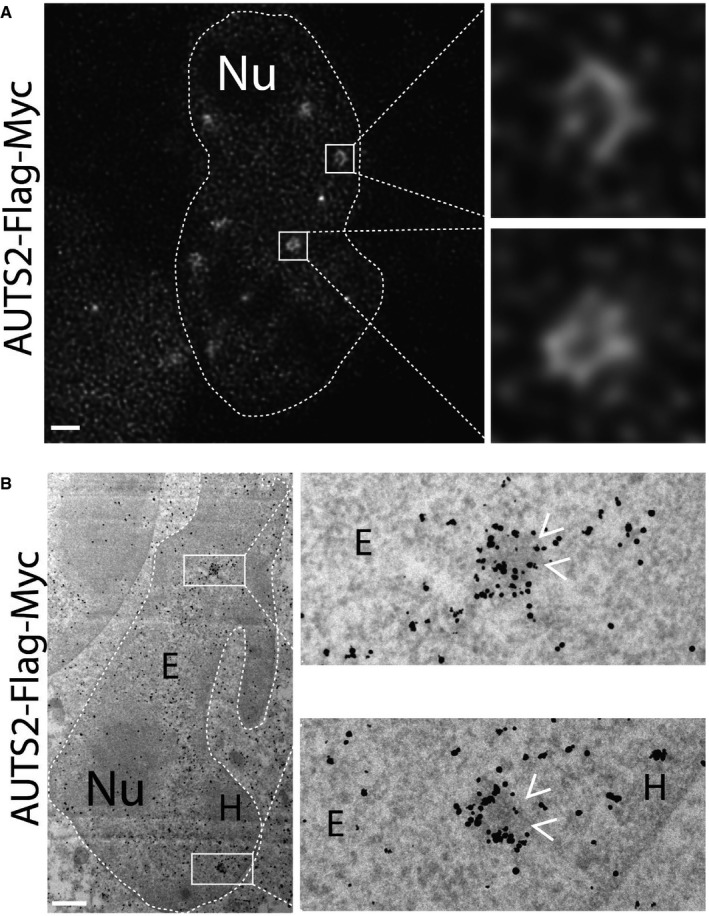
AUTS2 localisation evaluated by gated‐STED nanoscopy using anti‐Flag antibody.
HeLa cells expressing human AUTS2‐Flag‐Myc were processed for immuno‐electron microscopy as detailed in the Appendix. Antibody directed against Flag tag was used to detect the expressed protein. Arrowheads indicate the heterochromatic granules decorated by AUTS2.
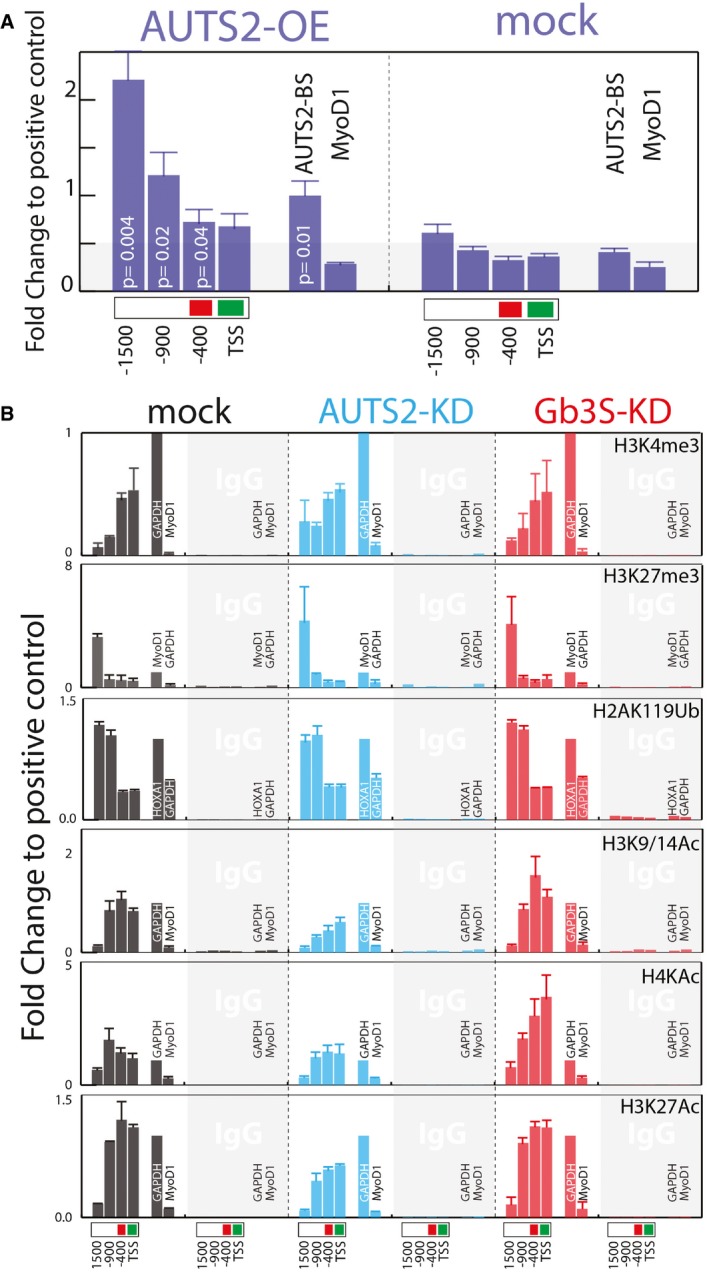
AUTS2 binding to the GM3S promoter, as assessed by ChIP in HeLa cells expressing AUTS2‐Flag‐Myc. Immunoprecipitation was performed with an anti‐FLAG antibody. Chromatin immunoprecipitates were analysed by qPCR using primers specific for the indicated regions of the GM3S promoter. Primers specific for a previously described (Gao et al, 2014) AUTS2 binding site (AUTS2‐BS; chr10: 31608364–31608595) or MyoD1 promoter were used as positive and negative controls, respectively. Data are means ± SEM of at least three independent experiments.
Effect of AUTS2 and Gb3S KD on histone modifications at the indicated GM3S promoter regions. ChIP experiments were performed with the indicated antibodies (see Appendix Table S3). Genomic regions at the GAPDH, HOXA1, and MyoD1 promoters (see Appendix Table S5) were used as the positive and negative controls according to the antibodies used. Data are expressed as fold changes to the positive control. Data are means ± SD of at least three independent experiments.
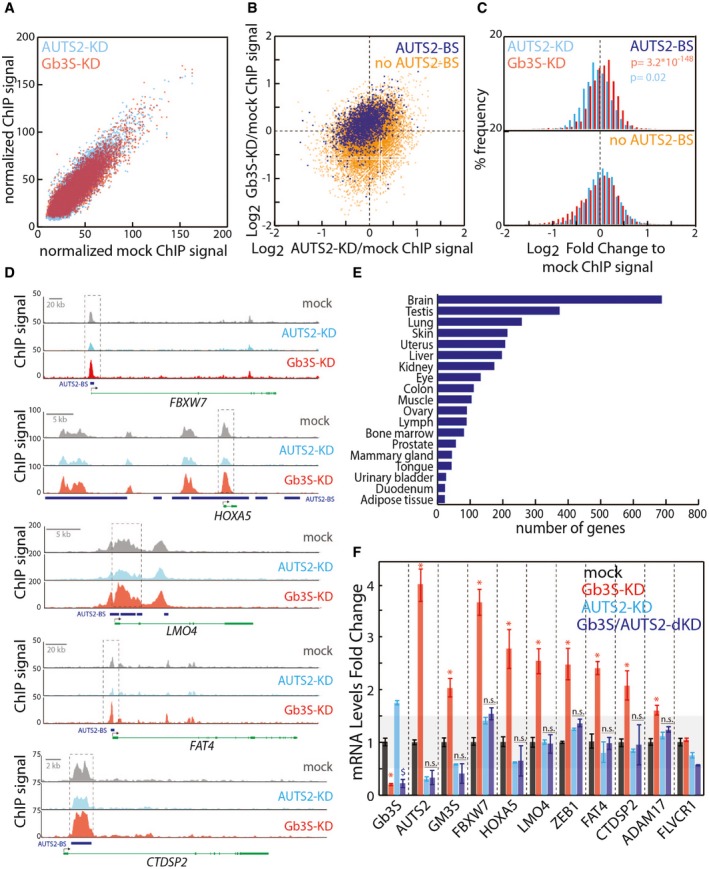
Scatter plot of normalised ChIP‐seq values associated with 15,040 common H3K9/14Ac peaks in mock‐treated HeLa cells compared to Gb3S‐KD cells (red) or AUTS2‐KD cells (cyan) (see Dataset EV2 for peak positions and values data; this dataset has been registered to GEO database with the following accession number GSE107044).
Scatter plot of Gb3S‐KD/mock versus AUTS2‐KD/mock normalised log2 ChIP‐seq value ratios for 1,896 common H3K9/14Ac peaks bound by AUTS2 (blue) and 13,144 non‐AUTS2‐bound peaks (orange).
% frequency distribution of Gb3S‐KD/mock (red) and AUTS2‐KD/mock (cyan) log2 ChIP‐seq value ratios for AUTS2‐bound and non‐AUTS2‐bound H3K9/14Ac peaks.
Representative H3K9/14Ac ChIP‐seq profiles for AUTS2‐bound promoters. Blue rectangles indicate AUTS2 binding sites; black arrows indicate transcriptional start sites.
Tissue distribution of genes intercepted by the 1,809 H3K9/14Ac peaks occupied by AUTS2 (source, David Ontology).
HeLa cells silenced for AUTS2 in control cells and in cells silenced for Gb3S. qPCR was performed to determine knock‐down efficiencies and the mRNA changes in selected genes intercepted by the H3K9/14Ac peaks occupied by AUTS2. mRNA levels are expressed as log2‐fold changes with respect to mock‐treated cells. Data are means ± SEM of at least three independent experiments. *P ≤ 0.05 to mock; $ P ≤ 0.05 to AUTS2‐KD.
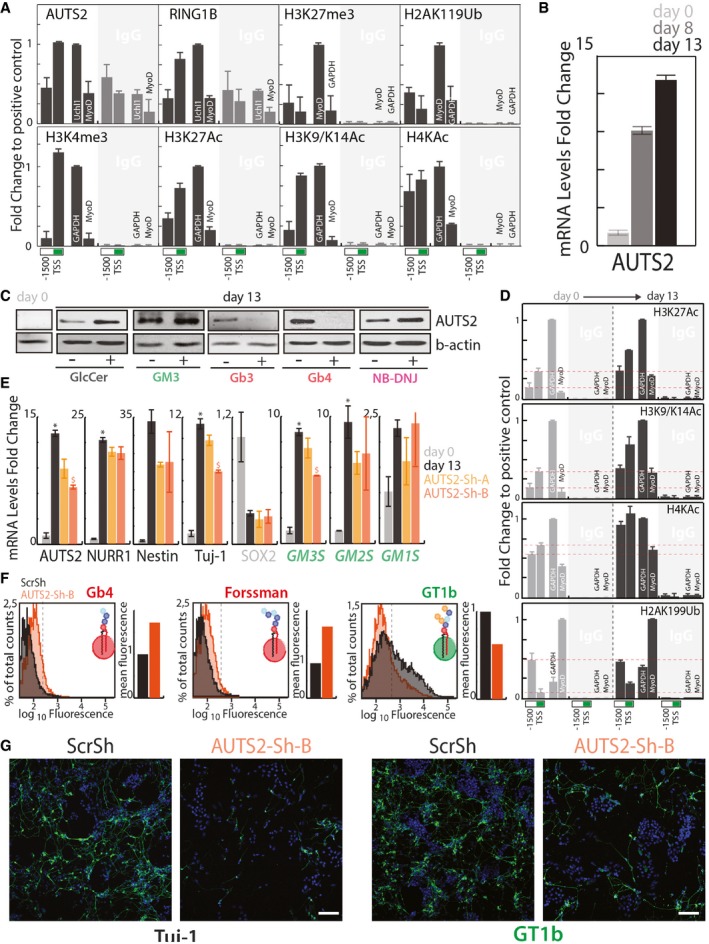
AUTS2 and RING1B occupancy and histone modifications at the GM3S promoter, as assessed by ChIP in mouse brain. ChIP experiments were performed with the indicated antibodies (see Appendix Table S3). Chromatin immunoprecipitates were analysed by qPCR using primers specific for the indicated regions of the murine GM3S promoter. Primers specific for a previously described (Gao et al, 2014) AUTS2 binding site (Uchl1) or MyoD promoter were used as positive and negative controls, respectively, for AUTS2 and RING1B. Genomic regions at the GAPDH, and MyoD promoters (see Appendix Table S5) were used as the positive and negative controls according to the antibodies used. Data are expressed as fold changes to the positive control. Data are means ±SD of at least three independent experiments.
E14‐mESCs treated as in Fig 2B were processed for RNA extraction at days 0, 8, and 13. The mRNA levels of AUTS2 were evaluated at different differentiation time points. Data are means ± SD of at least three independent experiments.
E14‐mESCs were induced to differentiate to neurons in presence of the indicated GSLs (25 μM) NB‐DNJ (25 μM) or vehicle (methanol). Cells were lysed and lysates were processed for Western blotting using antibodies against AUTS2 and b‐actin.
Histone acetylation at GM3S promoter during neural differentiation of E14‐mESCs. E14‐mESCs treated as in Fig 2B were processed for ChIP at days 0 and 13 cells with the indicated antibodies as in (A). Data are expressed as fold changes to the positive control. Data are means ±SD of two independent experiments. Red dotted lines indicate the relative histone modification levels at GM3S promter in non differentiated E14‐mESCs.
E14‐mESCs infected with lentiviral vectors for the expression of either scrambled shRNA (ScrSh) or two shRNAs targeting murine AUTS2 (AUTS2‐Sh‐A, AUTS2‐Sh‐B) were induced to differentiate into neurons. mESCs kept in an undifferentiated state are referred to as day 0. qPCR was used to determine the mRNA levels of the indicated genes. Data are means ±SD of at least three independent experiments. *P ≤ 0.05, compared to day 0; $ P ≤ 0.05, compared to ScrSh.
E14‐mESCs treated as in (D) were analysed by cytofluorometry with antibodies directed against globo‐series GSLs (i.e. Gb4, and Forssman) or the ganglioside GT1b. Cytofluorimetric profiles and normalised mean fluorescence are shown for each antibody for cells treated with ScrSh (black) or AUTS2‐Sh‐B (orange).
mESCs treated as in (E) were processed for immunofluorescence and stained for Tuj‐1 (left) or GT1b (right). Scale bar, 50 μm.
Comment in
-
Differentiate and switch, a tale of two heads of a lipid.EMBO J. 2018 Apr 3;37(7):e99221. doi: 10.15252/embj.201899221. Epub 2018 Mar 23. EMBO J. 2018. PMID: 29572242 Free PMC article.
References
-
- Bernstein BE, Kamal M, Lindblad‐Toh K, Bekiranov S, Bailey DK, Huebert DJ, McMahon S, Karlsson EK, Kulbokas EJ III, Gingeras TR, Schreiber SL, Lander ES (2005) Genomic maps and comparative analysis of histone modifications in human and mouse. Cell 120: 169–181 - PubMed
-
- Beunders G, Voorhoeve E, Golzio C, Pardo LM, Rosenfeld JA, Talkowski ME, Simonic I, Lionel AC, Vergult S, Pyatt RE, van de Kamp J, Nieuwint A, Weiss MM, Rizzu P, Verwer LE, van Spaendonk RM, Shen Y, Wu BL, Yu T, Yu Y et al (2013) Exonic deletions in AUTS2 cause a syndromic form of intellectual disability and suggest a critical role for the C terminus. Am J Hum Genet 92: 210–220 - PMC - PubMed
-
- Beunders G, van de Kamp J, Vasudevan P, Morton J, Smets K, Kleefstra T, de Munnik SA, Schuurs‐Hoeijmakers J, Ceulemans B, Zollino M, Hoffjan S, Wieczorek S, So J, Mercer L, Walker T, Velsher L, study DDD, Parker MJ, Magee AC, Elffers B et al (2016) A detailed clinical analysis of 13 patients with AUTS2 syndrome further delineates the phenotypic spectrum and underscores the behavioural phenotype. J Med Genet 53: 523–532 - PubMed
-
- Boccuto L, Aoki K, Flanagan‐Steet H, Chen CF, Fan X, Bartel F, Petukh M, Pittman A, Saul R, Chaubey A, Alexov E, Tiemeyer M, Steet R, Schwartz CE (2014) A mutation in a ganglioside biosynthetic enzyme, ST3GAL5, results in salt & pepper syndrome, a neurocutaneous disorder with altered glycolipid and glycoprotein glycosylation. Hum Mol Genet 23: 418–433 - PMC - PubMed
Publication types
MeSH terms
Substances
Grants and funding
LinkOut - more resources
Full Text Sources
Other Literature Sources
Molecular Biology Databases
