. 2018 Feb 5;150(2):277-291.
doi: 10.1085/jgp.201711870. Epub 2017 Dec 27.

ATP is stored in lamellar bodies to activate vesicular P2X4 in an autocrine fashion upon exocytosis

Affiliations

ATP is stored in lamellar bodies to activate vesicular P2X4 in an autocrine fashion upon exocytosis

Giorgio Fois et al. J Gen Physiol. .

Abstract

Vesicular P2X4 receptors are known to facilitate secretion and activation of pulmonary surfactant in the alveoli of the lungs. P2X4 receptors are expressed in the membrane of lamellar bodies (LBs), large secretory lysosomes that store lung surfactant in alveolar type II epithelial cells, and become inserted into the plasma membrane after exocytosis. Subsequent activation of P2X4 receptors by adenosine triphosphate (ATP) results in local fusion-activated cation entry (FACE), facilitating fusion pore dilation, surfactant secretion, and surfactant activation. Despite the importance of ATP in the alveoli, and hence lung function, the origin of ATP in the alveoli is still elusive. In this study, we demonstrate that ATP is stored within LBs themselves at a concentration of ∼1.9 mM. ATP is loaded into LBs by the vesicular nucleotide transporter but does not activate P2X4 receptors because of the low intraluminal pH (5.5). However, the rise in intravesicular pH after opening of the exocytic fusion pore results in immediate activation of vesicular P2X4 by vesicular ATP. Our data suggest a new model in which agonist (ATP) and receptor (P2X4) are located in the same intracellular compartment (LB), protected from premature degradation (ATP) and activation (P2X4), and ideally placed to ensure coordinated and timely receptor activation as soon as fusion occurs to facilitate surfactant secretion.


Figures

Figure 1.
Figure 1.
ATP is stored in LBs. (A) Staining of primary ATII cells with quinacrine and LTR (a marker for LBs), indicating the presence of intravesicular ATP in LBs (arrowheads). Bar, 10 µm. (B) ATII cells were incubated with mant-ATP for 1 h and labeled with LTR. Mant-ATP is enriched in LBs (arrowheads). Bar, 10 µm.
Figure 2.
Figure 2.
Alkalization-induced Ca2+-release from LBs is P2X4 dependent. (A) ATII cells labeled with fura 2-AM and expressing WT P2X4 tagged with mCherry (P2X4(WT)-mCherry). P2X4 is predominantly localized on LBs (arrowheads). Bar, 10 µm. (B) Top left: Image depicts the boxed area in A and highlights the perivesicular region (area between circles) around a P2X4(WT)-mCherry–positive LB where changes in the fura-2 ratio were recorded. Image series illustrates changes in fura-2 ratio after addition of 10 mM NH4Cl (at t = 40 s) in the same area as the image on the left. Bar, 5 µm. Bottom left: Normalized fura-2 ratios measured within a 1-µm perivesicular region around individual LBs (as illustrated in A, top) in control cells (blue) and cells (over)expressing P2X4(WT)-mCherry (red) treated with 10 mM NH4. Data represent means from 14 and 11 cells, respectively. Right: Quantification of the NH4-induced fura-2 peak amplitude. Overexpression of P2X4(WT)-mCherry, significantly increased amplitude (**, P = 0.0003).
Figure 3.
Figure 3.
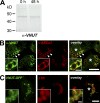
VNUT is expressed in isolated ATII cells and localized on the LB membrane. (A) Western blot of VNUT from ATII cells freshly isolated and 48 h after isolation confirms that expression of VNUT is not altered in cultured cells. (B) VNUT (green) is primarily localized on LB membranes (arrowheads) as detected by indirect immunofluorescence and confirmed by colocalization with P180 lamellar body protein (red, α-ABCa3). Asterisks denote nuclei of individual primary ATII cells. Bar: 10 µm; (inset) 2 µm. (C) VNUT-GFP (green) localizes to the membrane of LBs (LTR, red) in primary ATII cells. Asterisk denotes nuclei of primary ATII cell. Bar: 10 µm; (inset) 2 µm.
Figure 4.
Figure 4.
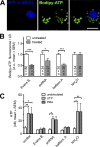
ATP uptake into LBs depends on VNUT. (A) Images illustrating loading of BODIPY FL ATP (green) into individual LBs (encircled). BODIPY FL ATP uptake was reduced in cells expressing VNUTshRNA. Cells expressing VNUTshRNA are identified by coexpression of nuclear BFP (blue). Bar, 10 µm. (B) Normalized BODIPY FL ATP fluorescence in individual LBs after a 3-h incubation period in the absence (untreated) or presence (treated) of VNUT inhibitor Evans Blue (100 µM), knockdown of VNUT expression by VNUT shRNA treatment for 72 h, inhibitor of H+-ATPase (100 nM bafilomycin A, 4 h), or treatment with NH4Cl (10 mM). BODIPY FL ATP fluorescence was analyzed within regions encircling individual LBs (as illustrated by circles in A). n, number of cells analyzed. *, P < 0.05; ***, P < 0.001. (C) Quantification of ATP release from ATII cells after stimulation of LB exocytosis with either 100 µM UTP or 300 nM PMA for 10 min in control cells or cells treated with VNUT inhibitor Evans Blue (100 µM, 3 h), VNUTshRNA (72 h), bafilomycin A (100 nM, 4 h), or NH4Cl (10 mM, 3 h). Data represent means ± SEM from ≥4 individual cell isolations. *, P < 0.05; **, P < 0.01.
Figure 5.
Figure 5.
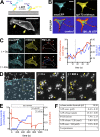
ATP is released from individual LBs upon exocytosis. (A–C) Detection of LB fusion–induced ATP release using genetically encoded ATP sensors. (A) Top: Schematic drawing of ATeam3.10-GL-GPI. Original ATeam3.10 is attached to a GPI-anchor (orange) via a 12xGlycin-linker (black) to facilitate selective expression in the outer leaflet of PM. Bottom: Image illustrating expression of ATeam3.10-GL-GPI on the cell surface (arrows) of ATII cells. Bar, 10 µm. (B) Images of the CFP (mseCFP) and YFP (cp173-mVenus) channel recorded from ATII cell expressing ATeam3.10-GL-GPI. Bottom: Representative YFP/CFP ratio images in the presence of 0 (control) and 100 µM extracellular ATP. Bar, 10 µm. (C) Left: ATeam3.10-GL-GPI was expressed in the outer leaflet of the PM in ATII cells (mseCFP, mVenus). FM1-43 selectively labels LBs after their fusion with the PM (arrowheads; empty arrowheads indicate FM1-43–positive LBs that fused to the PM before the start of the experiment; filled arrowhead indicates LB that fused during the experiment; Haller et al., 1998). Red circle (fused LB) denotes the region where the increase of FM1-43 fluorescence was analyzed. The area within the blue border represents the area where changes in the FRET ratio were analyzed. Bar, 10 µm. Right: Time course of FRET ratio (blue) and FM1-43 fluorescence (red) within the respective areas illustrated in the image on the left. Cells were stimulated at t = 0 s with 300 nM PMA. Dotted line indicates time of LB fusion (onset of FM1-43 fluorescence increase). (D–F) Quantitative analysis of ATP release from individual LBs. (D) Left: Image depicting ATII cells labeled with LTG. The blue shaded area indicates the area under the dual sensor electrode (AUE). LB fusion events were analyzed within the AUE. Middle and right: Magnified view of the area within the yellow rectangle in the left image at t = 0 and 600 s after stimulation of ATII cells with 300 nM PMA. Arrowheads indicate LB that fused within the time course of the experiment (loss of LTG fluorescence in image, t = 600 s). Asterisks denote nuclei of individual primary ATII cells. Bars, 20 µm. (E) Time–current graph recorded with an ATP microbiosensor and cumulative LB fusion activity after stimulation of ATII cells with 300 nM PMA at t = 0 s. Fusion activity starts at ≈t = 180 s and is accompanied by a decrease in current. Addition of ATP (10 µM, t = 700 s) results in a decrease in current, whereas addition of glucose (10 mM, t = 850 s) increases the current. (F) Table representing mean ATP release and LB fusion activity under the electrode from seven independent experiments (as illustrated in C). Based on the observed increase in ATP concentration under the electrode after LB fusions, we calculated a mean ATP concentration of 1.9 mM within individual LBs.
Figure 6.
Figure 6.
Vesicular ATP activates FACE in an autocrine fashion upon LB exocytosis. (A) Image sequence illustrating analysis of FACE in a cell loaded with Fura-2 and maintained in a bath containing FM1-43 (top left). Fura-2 ratios (top row) and FM1-43 fluorescence (bottom row) were acquired at 3 Hz. Red circle denotes the region where the increase of FM1-43 fluorescence was measured after fusion of LB with the PM. The area within the two white circles represents the ring-like region of interest surrounding the fused LB, where changes in [Ca2+]c (fura-2 ratio) were analyzed. t, time after start of experiment. Bar, 5 µm. (B) Time course of fura-2 ratio (blue) and FM1-43 fluorescence (red) around and within the area of the LB fusion depicted in A. The cell was stimulated with 300 nM PMA. (C) Same as A, recorded in a cell treated with VNUT shRNA for 3 d. t, time after start of experiment. Bar, 5 µm. (D) Time course of fura-2 ratio (blue) and FM1-43 fluorescence (red) around and within the area of the LB fusion depicted in C. The cell was stimulated with 300 nM PMA. Note the absence of FACE. (E) Quantitative analysis of the amplitude of the FACE signal from the experiments in B and D confirm full ablation of FACE in cells treated with VNUT shRNA. n, number of fusions analyzed for each condition. (F) Diffusion of FM1-43 into LBs after fusing with the PM. Δ FM/s represents the slope of the increase in FM1-43 fluorescence of a fused vesicle in the first 10 s after fusion with the PM. This is a measure for initial diffusion of FM1-43 into a fused LB and correlates well with fusion pore diameter (Haller et al., 2001; Miklavc et al., 2011). FM1-43 diffusion was significantly faster (*, P = 0.01) in control cells compared with diffusion in cells treated with VNUT shRNA. n, number of fusions analyzed for each condition. Mean ± SEM is shown.
Figure 7.
Figure 7.
Schematic model of autocrine P2X4 activation by vesicular ATP. P2X4 is expressed on the limiting membrane of LBs, and ATP (green) is loaded into LBs by VNUT. The low pH within LBs protects P2X4 from premature activation. Upon exocytosis and opening of the fusion pore, the pH within the lumen of the fused LB rises and P2X4 receptors are activated by ATP, resulting in “fusion-activated Ca2+-entry” (FACE) at the site of LB fusion. FACE then facilitates fusion pore dilation, surfactant secretion, and fluid resorption from alveoli.

Comment in

References

    1. Abbracchio M.P., Burnstock G., Boeynaems J.M., Barnard E.A., Boyer J.L., Kennedy C., Knight G.E., Fumagalli M., Gachet C., Jacobson K.A., and Weisman G.A.. 2006. International Union of Pharmacology LVIII: update on the P2Y G protein-coupled nucleotide receptors: From molecular mechanisms and pathophysiology to therapy. Pharmacol. Rev. 58:281–341. 10.1124/pr.58.3.3 - DOI - PMC - PubMed
    1. Adriaensen D., and Timmermans J.P.. 2004. Purinergic signalling in the lung: Important in asthma and COPD? Curr. Opin. Pharmacol. 4:207–214. 10.1016/j.coph.2004.01.010 - DOI - PubMed
    1. Andronescu C., Poller S., and Schuhmann W.. 2014. Electrochemically induced deposition of poly(benzoxazine) precursors as immobilization matrix for enzymes. Electrochem. Commun. 41:12–15. 10.1016/j.elecom.2014.01.015 - DOI
    1. Belete H.A., Hubmayr R.D., Wang S., and Singh R.D.. 2011. The role of purinergic signaling on deformation induced injury and repair responses of alveolar epithelial cells. PLoS One. 6:e27469 10.1371/journal.pone.0027469 - DOI - PMC - PubMed
    1. Bodin P., and Burnstock G.. 2001. Purinergic signalling: ATP release. Neurochem. Res. 26:959–969. 10.1023/A:1012388618693 - DOI - PubMed

Publication types

Substances

Associated data

LinkOut - more resources