. 2018 Feb 5;215(2):627-644.
doi: 10.1084/jem.20170690. Epub 2017 Dec 27.

Obesity alters the long-term fitness of the hematopoietic stem cell compartment through modulation of Gfi1 expression

Affiliations

Obesity alters the long-term fitness of the hematopoietic stem cell compartment through modulation of Gfi1 expression

Jung-Mi Lee et al. J Exp Med. .

Abstract

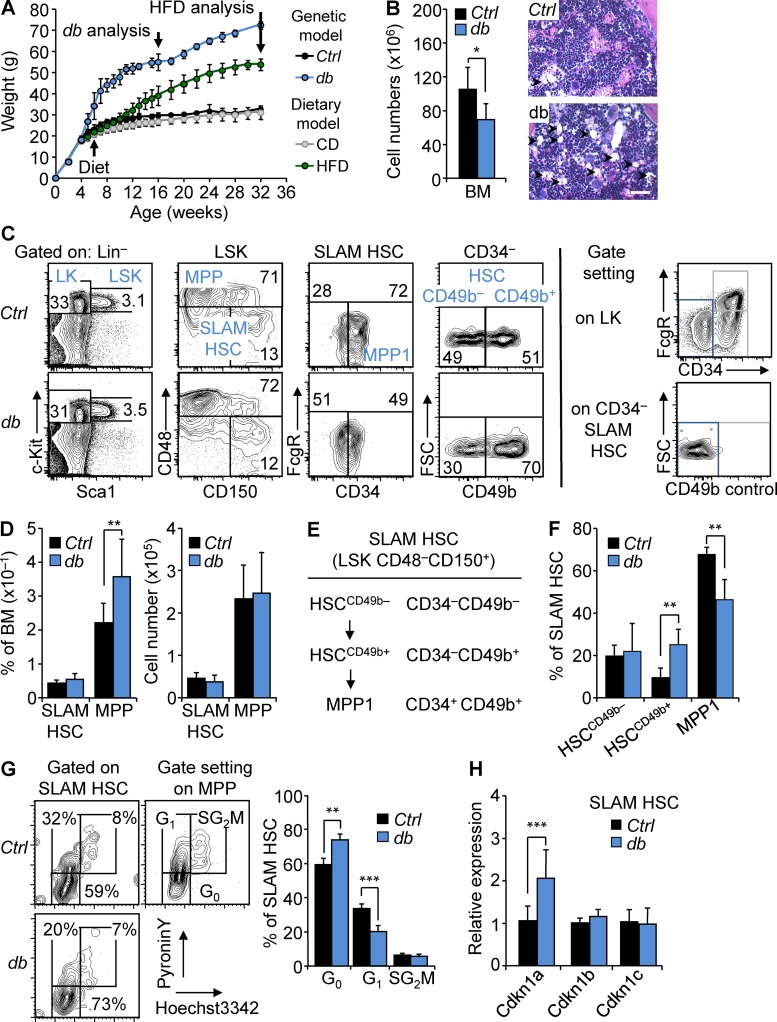
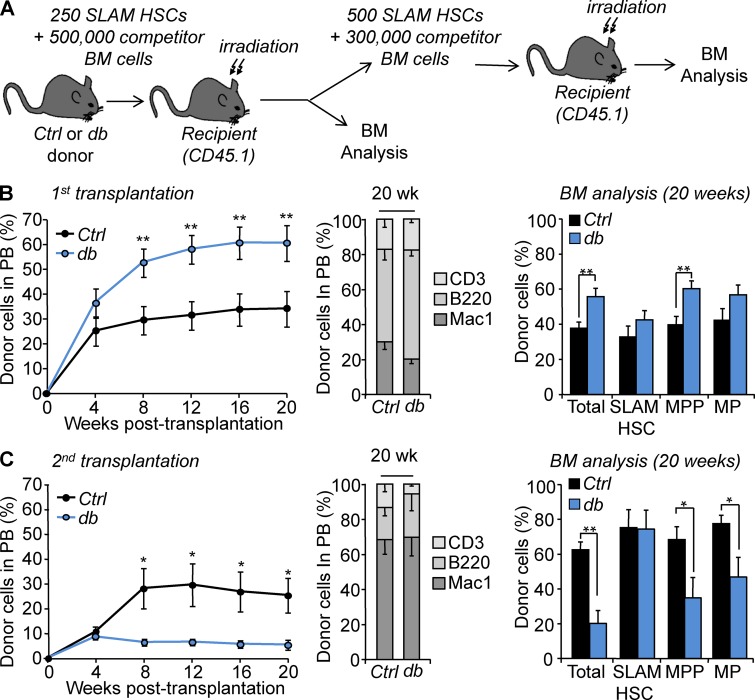
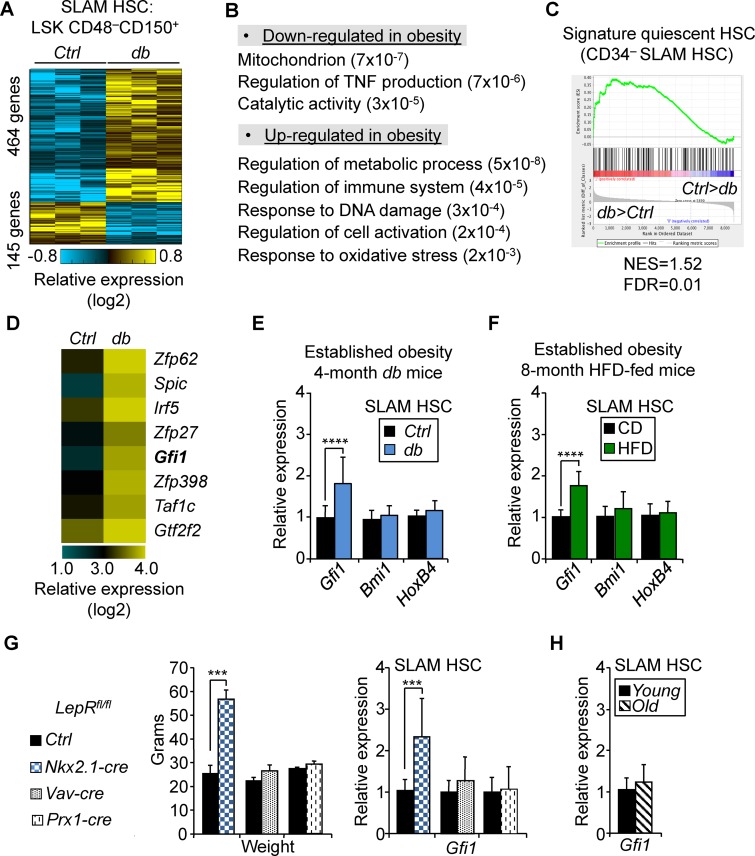
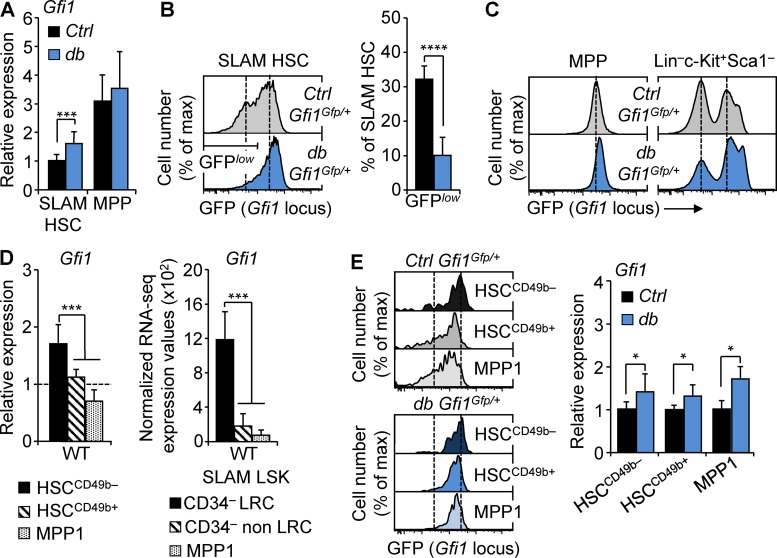
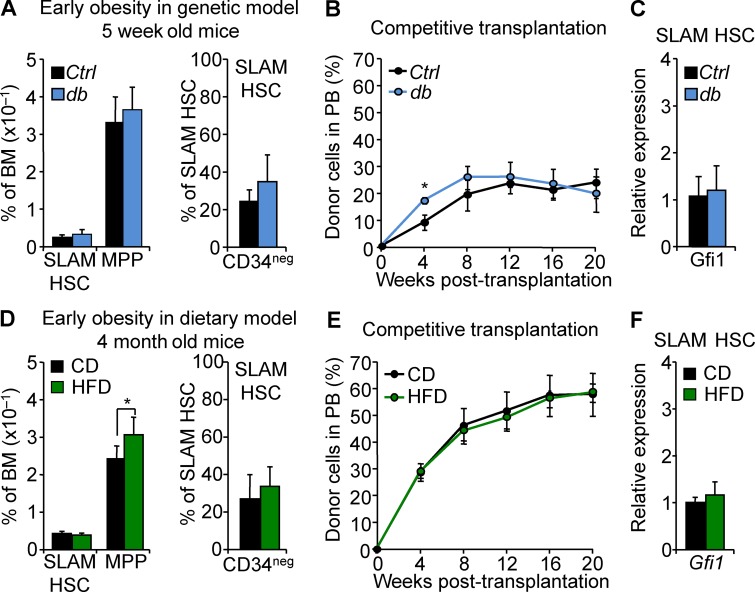
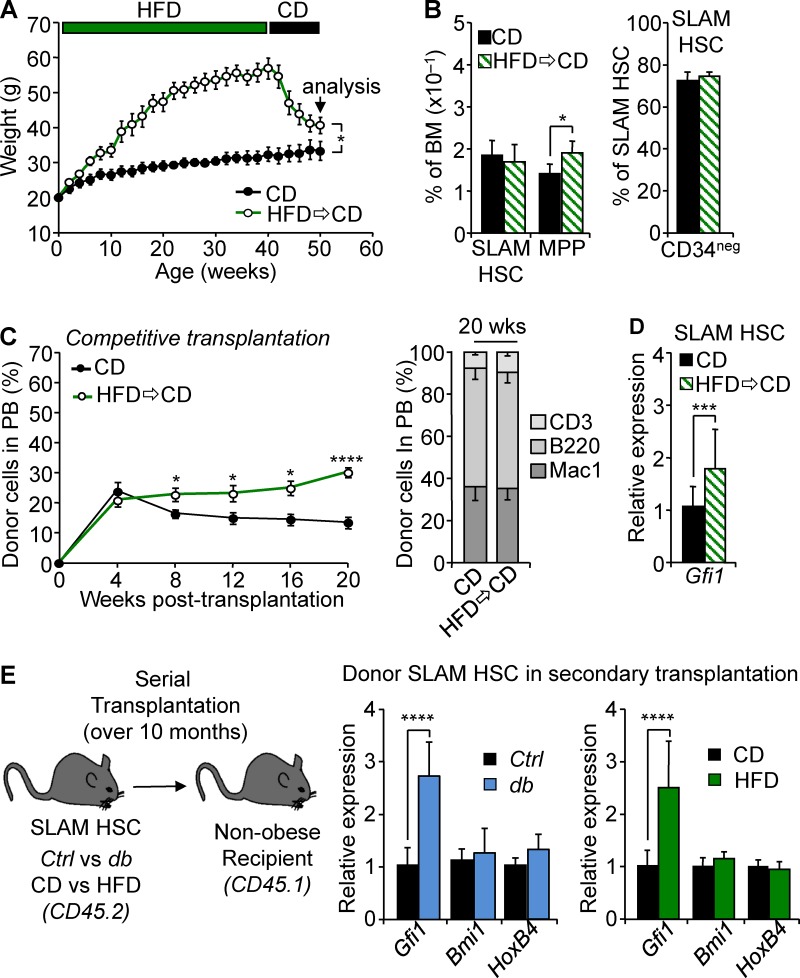
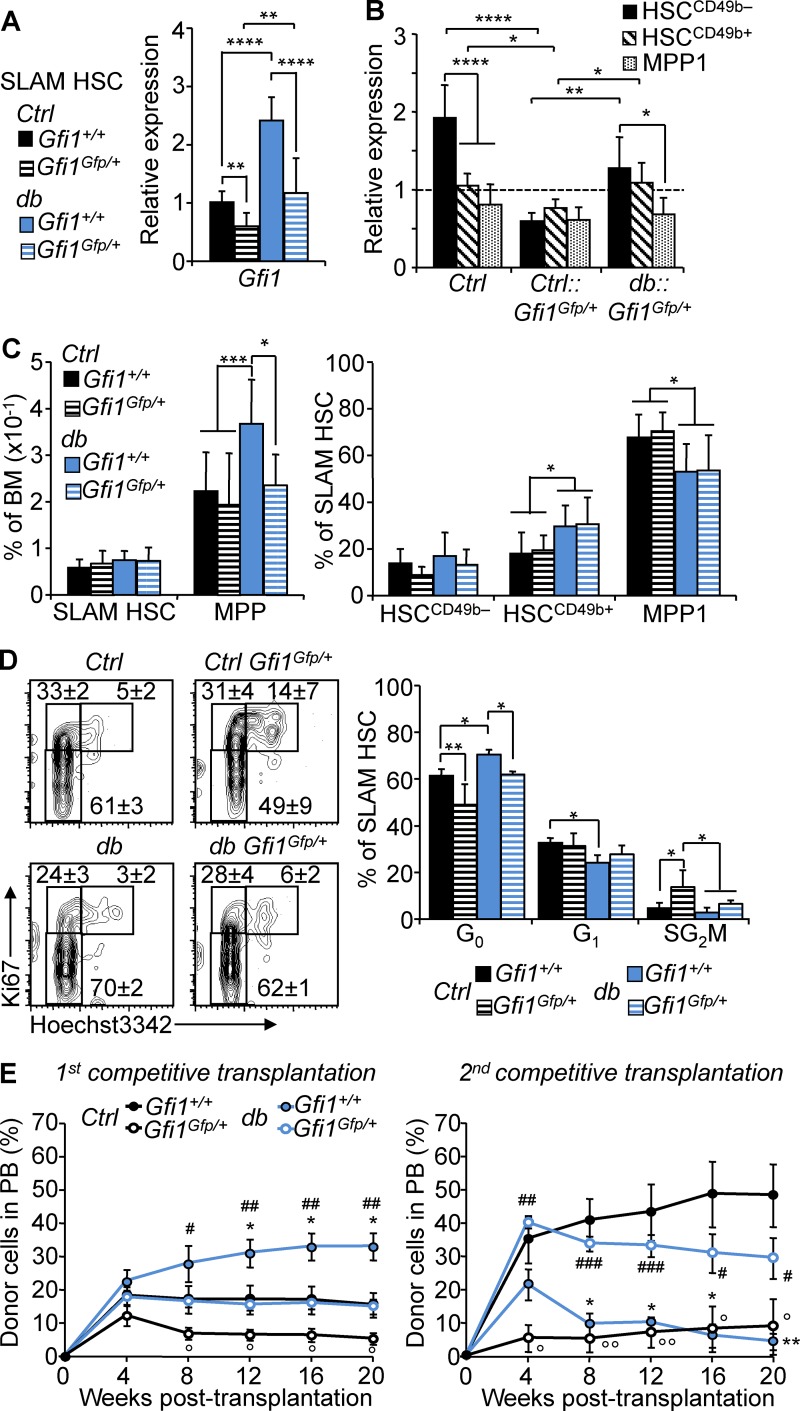
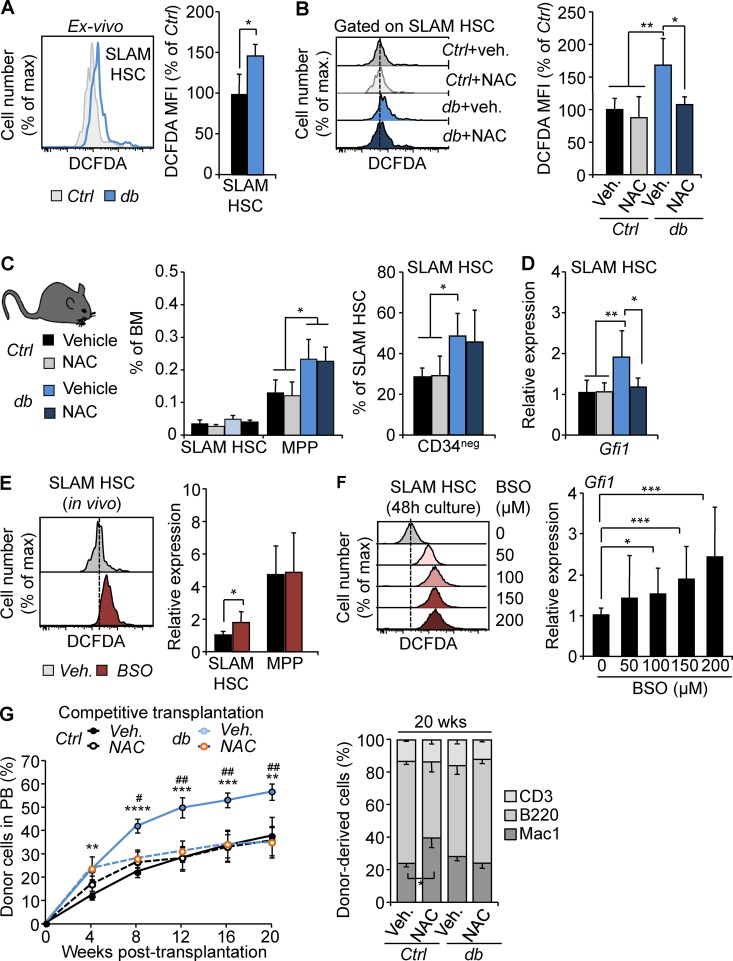
Obesity is a chronic organismal stress that disrupts multiple systemic and tissue-specific functions. In this study, we describe the impact of obesity on the activity of the hematopoietic stem cell (HSC) compartment. We show that obesity alters the composition of the HSC compartment and its activity in response to hematopoietic stress. The impact of obesity on HSC function is progressively acquired but persists after weight loss or transplantation into a normal environment. Mechanistically, we establish that the oxidative stress induced by obesity dysregulates the expression of the transcription factor Gfi1 and that increased Gfi1 expression is required for the abnormal HSC function induced by obesity. These results demonstrate that obesity produces durable changes in HSC function and phenotype and that elevation of Gfi1 expression in response to the oxidative environment is a key driver of the altered HSC properties observed in obesity. Altogether, these data provide phenotypic and mechanistic insight into durable hematopoietic dysregulations resulting from obesity.


Figures

Figure 1.
Figure 1.
HSCs maintain a highly quiescent state in obesity. (A) Kinetics of weight gain in genetic (db) and dietary (HFD) mouse models of obesity. db, n = 5; HFD, n = 8. (B) BM cellularity of 4-mo-old db mice compared with Ctrl littermates. n = 13/group. Images show H&E staining of the BM section from Ctrl and db mice (n = 3). Arrowheads indicate BM adipocytes. Bars, 100 µm. (C) FACS plots of HSPC populations in the BM of 4-mo-old Ctrl and db mice (n = 6). Right panels show strategies used to position CD34 and CD49b gates. (D) Mean percentages (left) and absolute numbers (right) ± SD of HSPC populations in the BM of 4-mo-old Ctrl and db mice. n = 13/group. (E and F) Phenotypic definition and mean percentages ± SD of HSC subsets in the BM of 4-mo-old Ctrl and db mice. n = 6/group. (G) Representative FACS plots (left) and mean percentages ± SD (right) of Ctrl and db SLAM HSC distribution in cell cycle phases. n = 4/group. Two independent experiments. (H) qRT-PCR analyses for Cdkn1a, Cdkn1b, and Cdkn1c gene expression in SLAM HSCs isolated from 4-mo-old db mice. Results are expressed as fold change ± SD relative to Ctrl SLAM HSCs. n = 12 pools of 100 cells. Student’s t test; *, P ≤ 0.05; **, P ≤ 0.005; ***, P ≤ 0.0005. Two independent experiments.
Figure 2.
Figure 2.
Functional impact of obesity on HSCs. (A) Experimental scheme for serial transplantation assay. (B and C) Hematopoietic reconstitution in primary and secondary recipients. The left graph indicates PB chimerism over time. The middle graph shows myeloid and lymphoid PB chimerism 20 wk after transplantation. The right graph shows the percentage of donor-derived total BM cells, SLAM HSCs, MPPs, and myeloid progenitors (MPs) 20 wk after transplantation. Results are expressed as means ± SEM. n = 8 and 4. Student’s t test; *, P ≤ 0.05; **, P ≤ 0.01. Four and two independent experiments, respectively.
Figure 3.
Figure 3.
Obesity is associated with up-regulation of Gfi1 expression in HSCs. (A) Differential gene signature in SLAM HSCs isolated from in 4-mo-old Ctrl and db mice. (B) GSEA for dysregulated genes in db SLAM HSCs. Numbers in parentheses indicate adjusted p-values. (C) Enrichment of quiescent CD34 SLAM HSC gene signature (Qian et al., 2016). FDR, false discovery rate; NES, normalized enrichment score. (D) Heat map showing examples of differentially expressed transcription factors in Ctrl and db SLAM HSCs (ordered by db/Ctrl expression ratio). (E and F) qRT-PCR analyses for Gfi1, Bmi1, and HoxB4 gene expression in SLAM HSCs isolated from 4-mo-old db mice (E) or from 8-mo-old HFD-fed mice (F). Results are expressed as fold change ± SD relative to their respective controls. (G) Body weight (left) and qRT-PCR analyses for Gfi1 expression in SLAM HSCs (right) of Nkx2.1-cre::Leprfl/fl, Vav1-cre::Leprfl/fl, and Prx1-cre::Leprfl/fl mice. Body weights are expressed as means ± SD (n = 3–5). qRT-PCR results are expressed as fold change ± SD relative to their respective controls. Student’s t test; ***, P ≤ 0.005; ****, P ≤ 0.0005. (H) qRT-PCR analyses for Gfi1 gene expression in old SLAM HSCs (20–24 mo). Results are expressed as fold change ± SD relative to young controls. n = 18 pools of 100 cells. Three independent experiments.
Figure 4.
Figure 4.
Gfi1 up-regulation in obesity affects all HSC subsets. (A) qRT-PCR analyses for Gfi1 gene expression in SLAM HSCs and MPPs isolated from 4-mo-old Ctrl and db mice. Results are expressed as fold change ± SD relative to Ctrl SLAM HSCs. n = 12 pools of 100 cells. (B) Representative FACS plots showing GFP fluorescence in SLAM HSCs of 4-mo-old Ctrl::Gfi1Gfp/+ and db::Gfi1Gfp/+ mice. Graph indicates mean percentages ± SD of GFPlow SLAM HSCs. n = 4/group. (C) Representative FACS plots showing GFP fluorescence in MPPs (left) and in LK progenitors (right) of Ctrl::Gfi1Gfp/+ and db::Gfi1Gfp/+ mice. n = 4/group. (D) qRT-PCR analyses for Gfi1 gene expression in HSC subsets isolated from WT mice. Results are expressed as fold change ± SD relative to total SLAM HSCs. n = 6 pools of 100 cells. The right panel shows mean RNA-seq expression for Gfi1 transcripts in dormant long-term label-retaining cell (LRC) HSCs, active non-LRC HSCs, and MPP1 cells (n = 3; Cabezas-Wallscheid et al., 2017). (E) Representative FACS plots showing GFP fluorescence in HSC subsets of 4-mo-old Ctrl::Gfi1Gfp/+ and db::Gfi1Gfp/+ mice. n = 3/group. The right panel shows qRT-PCR analyses for Gfi1 gene expression in HSC subsets isolated from db mice. Results are expressed as fold change ± SD relative to their respective controls. n = 6 pools of 100 cells. Student’s t test (A, B, and E) or one-way ANOVA with Tukey’s post hoc test (D); *, P ≤ 0.05; ***, P ≤ 0.0005; ****, P ≤ 0.00005. Two independent experiments.
Figure 5.
Figure 5.
Progressive effect of obesity on the HSC compartment. (A) Mean percentages ± SD of SLAM HSC/MPPs (left) and CD34 SLAM HSCs (right) in the BM of 5-wk-old Ctrl and db mice. n = 3–4/group. (B) PB chimerism in competitive reconstitution assays with SLAM HSCs isolated from Ctrl and db 5-wk-old mice. Results are expressed as means ± SEM. n = 4/group. (C) qRT-PCR analyses for Gfi1 in SLAM HSCs isolated from 5-wk-old db mice. Results are expressed as fold change ± SD relative to Ctrl SLAM HSCs. n = 12 pools of 100 cells. (D) Mean percentages ± SD of SLAM HSC/MPPs (left) and CD34 SLAM HSCs (right) in the BM of 4-mo-old mice fed with HFD. n = 8/group. Student’s t test; *, P ≤ 0.05. (E) PB chimerism in competitive reconstitution assays with SLAM HSCs isolated from 4-mo-old mice fed with HFD. Results are expressed as means ± SEM. n = 4/group. (F) qRT-PCR analyses for Gfi1 in SLAM HSCs isolated from 4-mo-old mice fed with HFD. Results are expressed as fold change ± SD relative to CD SLAM HSCs. n = 12 pools of 100 cells. Two independent experiments.
Figure 6.
Figure 6.
Long-lasting effect of obesity on the HSC compartment. (A) Kinetics of weight variation after diet change. Data are represented as means ± SD. n = 4/group. (B) Mean percentages ± SD of SLAM HSC/MPPs (left) and CD34 SLAM HSCs (right) in the BM of mice constantly fed with CD or experiencing diet change. n = 4/group. (C) PB chimerism in competitive reconstitution assays with SLAM HSCs isolated from mice constantly fed with CD or experiencing diet change. The right graph shows myeloid and lymphoid PB chimerism 20 wk after transplantation. Results are expressed as means ± SEM. n = 11–12/group. (D) qRT-PCR analyses for Gfi1 gene expression in SLAM HSCs isolated from mice experiencing diet change. Results are expressed as fold change ± SD relative to controls. n = 16 pools of 100 cells. (E) qRT-PCR analyses for Gfi1, Bmi1, and HoxB4 genes in db (left) and HFD SLAM HSCs (right) after serial transplantations. Results are expressed as fold change ± SD relative to their respective controls. n = 12 pools of 100 cells. Student’s t test; *, P ≤ 0.05; ***, P ≤ 0.005; ****, P ≤ 0.0005. Two independent experiments.
Figure 7.
Figure 7.
Gfi1 controls HSC fate in obesity. (A) qRT-PCR analyses for Gfi1 gene expression in SLAM HSCs isolated from 4-mo-old db, Ctrl::Gfi1Gfp/+, and db::Gfi1Gfp+ mice. Results are expressed as fold change ± SD relative to total Ctrl SLAM HSCs. n = 6–12 pools of 100 cells. Student’s t test; **, P ≤ 0.01; ****, P ≤ 0.0005. Three independent experiments. (B) qRT-PCR analyses for Gfi1 gene expression in HSC subsets isolated from 4-mo-old Ctrl, Ctrl::Gfi1Gfp/+, and db::Gfi1Gfp/+ mice. Results are expressed as fold change ± SD relative to total Ctrl SLAM HSCs. n = 6–12 pools of 100 cells. Two-way ANOVA with Tukey’s post hoc test; *, P ≤ 0.05; **, P ≤ 0.005; ****, P ≤ 0.0001. Two independent experiments. (C) Mean percentages ± SD of SLAM HSC/MPPs (left) and HSC subsets (right) in the BM of 4-mo-old Ctrl, db, Ctrl::Gfi1Gfp/+, and db::Gfi1Gfp+ mice. n = 8–18. (D) Representative FACS plots (left) and mean percentages ± SD (right) showing SLAM HSC distribution in cell cycle phases. n = 4–6 mice/group. One-way ANOVA with Tukey’s post hoc test; *, P ≤ 0.05; **, P ≤ 0.005; ***, P ≤ 0.001. Two independent experiments. (E) PB chimerism in primary (left) and secondary (right) competitive reconstitution assays using SLAM HSCs isolated from Gfi1Gfp/+ and db compound mice. Results are expressed as means ± SEM. n = 4–8/group. Student’s t test; Ctrl vs. db: *, P ≤ 0.05; **, P ≤ 0.005; Ctrl vs. Ctrl::Gfi1Gfp/+: °, P ≤ 0.05; °°, P ≤ 0.05; db vs. db::Gfi1Gfp/+: #, P ≤ 0.05; ##, P ≤ 0.005; ###, P ≤ 0.0005. Two independent experiments.
Figure 8.
Figure 8.
Oxidative stress is a key driver of HSC dysregulation in obesity. (A) Representative FACS plots (left) and mean fluorescence intensity (MFI) ± SD (right) showing ROS level detected by 2’,7’–dichlorofluorescin diacetate (DCFDA) staining in SLAM HSCs isolated from 4-mo-old Ctrl and db mice. n = 3/group. Student’s t test; *, P ≤ 0.05. Two independent experiments. (B) Representative FACS plots (left) and mean fluorescence intensity ± SD (right) showing ROS level in SLAM HSCs isolated from NAC-treated Ctrl and db mice. n = 4–7/group. (C) Mean percentages ± SD of SLAM HSC/MPPs (left) and CD34 SLAM HSCs (right) in the BM isolated from NAC-treated Ctrl and db mice. n = 5/group. (D) qRT-PCR analyses for Gfi1 gene expression in SLAM HSCs isolated from NAC-treated Ctrl and db mice. Results are expressed as fold change ± SD relative to vehicle-treated Ctrl SLAM HSCs. n = 6–12 pools of 100 cells. One-way ANOVA with Tukey's post hoc test; *, P ≤ 0.05; **, P ≤ 0.005. Two independent experiments. (E) Representative FACS plots (left) and qRT-PCR analyses (right) showing ROS level and Gfi1 gene expression in SLAM HSCs isolated from BSO-treated WT mice. Results are expressed as fold change ± SD relative to vehicle-treated mice. n = 6–12 pools of 100 cells. Student’s t test; *, P ≤ 0.05. Two independent experiments. (F) Representative FACS plots (left) and qRT-PCR analyses (right) showing ROS level and Gfi1 gene expression in SLAM HSCs cultured for 48 h in presence of BSO. Results are expressed as fold change ± SD relative to vehicle-treated mice. n = 5–9 pools of 100 cells. One-way ANOVA with Dunnett’s post hoc test; *, P ≤ 0.05; ***, P = 0.0005. Three independent experiments. (G) PB chimerism in competitive reconstitution assays using SLAM HSCs isolated from vehicle- or NAC-treated Ctrl and db mice. The right graph shows myeloid and lymphoid PB chimerism 20 wk after transplantation. Results are expressed as means ± SEM. n = 7/group. Student’s t test; Ctrl + Veh. vs. db + Veh.: **, P ≤ 0.005; ***, P ≤ 0.0005; ****, P ≤ 0.00005; db + Veh. vs. db + NAC: #, P ≤ 0.01; ##, P ≤ 0.005. Two independent experiments.

References

    1. Adler B.J., Green D.E., Pagnotti G.M., Chan M.E., and Rubin C.T.. 2014a High fat diet rapidly suppresses B lymphopoiesis by disrupting the supportive capacity of the bone marrow niche. PLoS One. 9:e90639 10.1371/journal.pone.0090639 - DOI - PMC - PubMed
    1. Adler B.J., Kaushansky K., and Rubin C.T.. 2014b Obesity-driven disruption of haematopoiesis and the bone marrow niche. Nat. Rev. Endocrinol. 10:737–748. 10.1038/nrendo.2014.169 - DOI - PubMed
    1. Akunuru S., and Geiger H.. 2016. Aging, Clonality, and Rejuvenation of Hematopoietic Stem Cells. Trends Mol. Med. 22:701–712. 10.1016/j.molmed.2016.06.003 - DOI - PMC - PubMed
    1. Ambrosi T.H., Scialdone A., Graja A., Gohlke S., Jank A.M., Bocian C., Woelk L., Fan H., Logan D.W., Schürmann A., et al. . 2017. Adipocyte Accumulation in the Bone Marrow during Obesity and Aging Impairs Stem Cell-Based Hematopoietic and Bone Regeneration. Cell Stem Cell. 20:771–784. 10.1016/j.stem.2017.02.009 - DOI - PMC - PubMed
    1. Arai F., Hirao A., Ohmura M., Sato H., Matsuoka S., Takubo K., Ito K., Koh G.Y., and Suda T.. 2004. Tie2/angiopoietin-1 signaling regulates hematopoietic stem cell quiescence in the bone marrow niche. Cell. 118:149–161. 10.1016/j.cell.2004.07.004 - DOI - PubMed

Publication types

MeSH terms