. 2018 Feb 15;29(4):419-434.
doi: 10.1091/mbc.E17-05-0294. Epub 2017 Dec 27.

Moesin is involved in polarity maintenance and cortical remodeling during asymmetric cell division

Affiliations

Moesin is involved in polarity maintenance and cortical remodeling during asymmetric cell division

Namal Abeysundara et al. Mol Biol Cell. .

Abstract

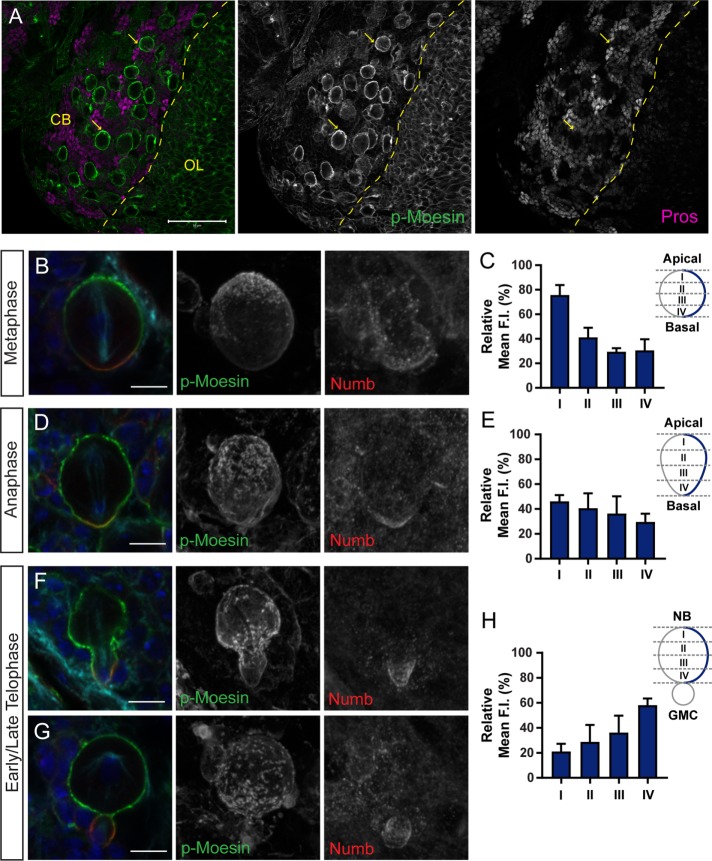
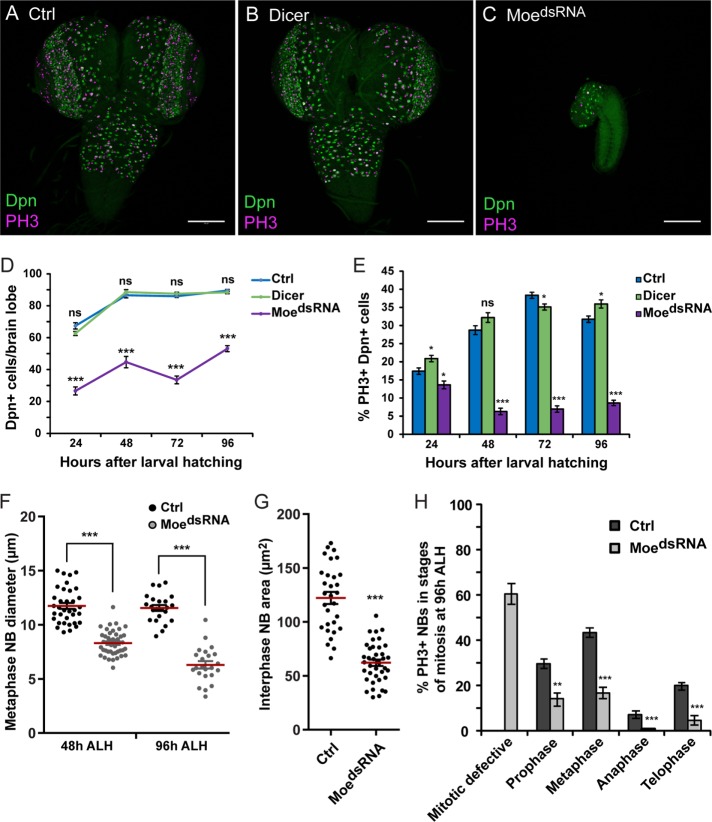
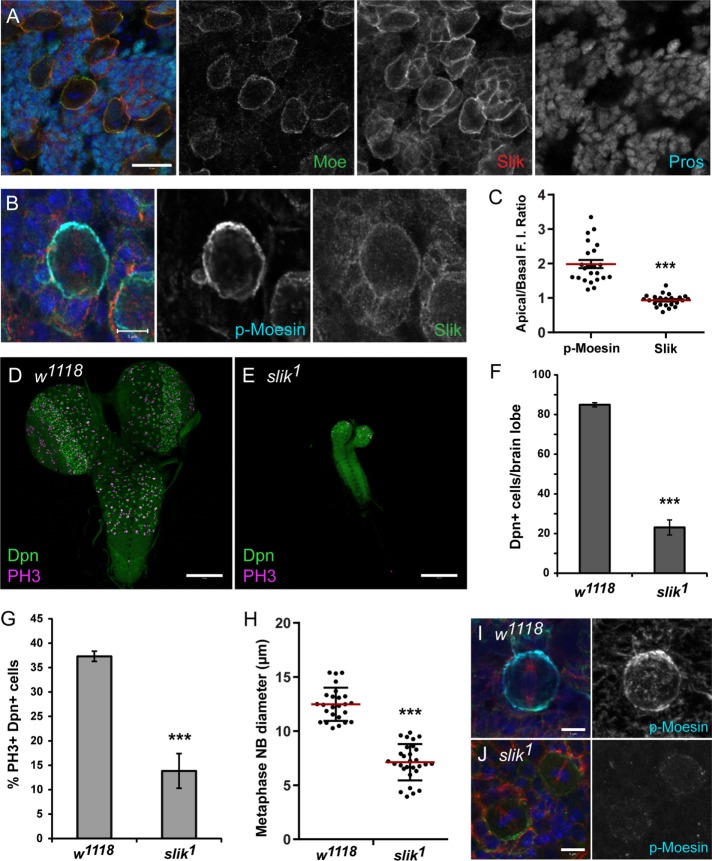
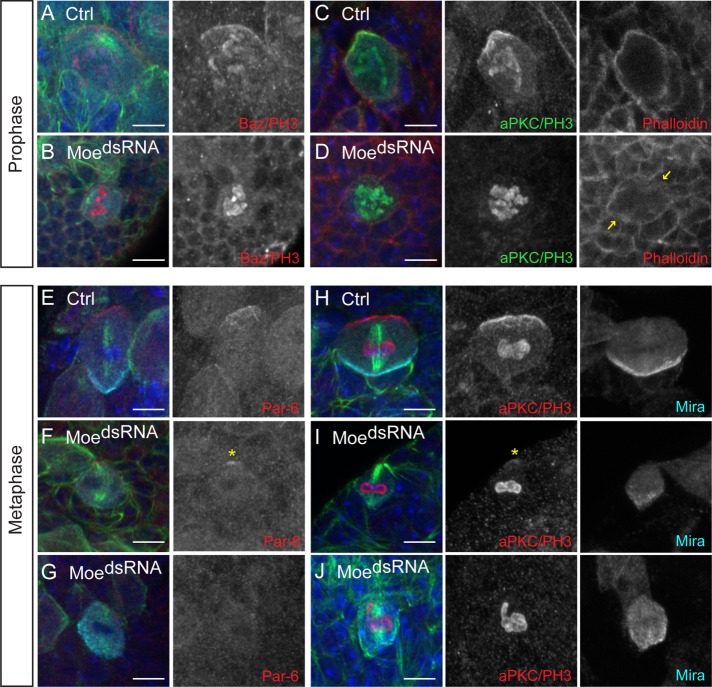
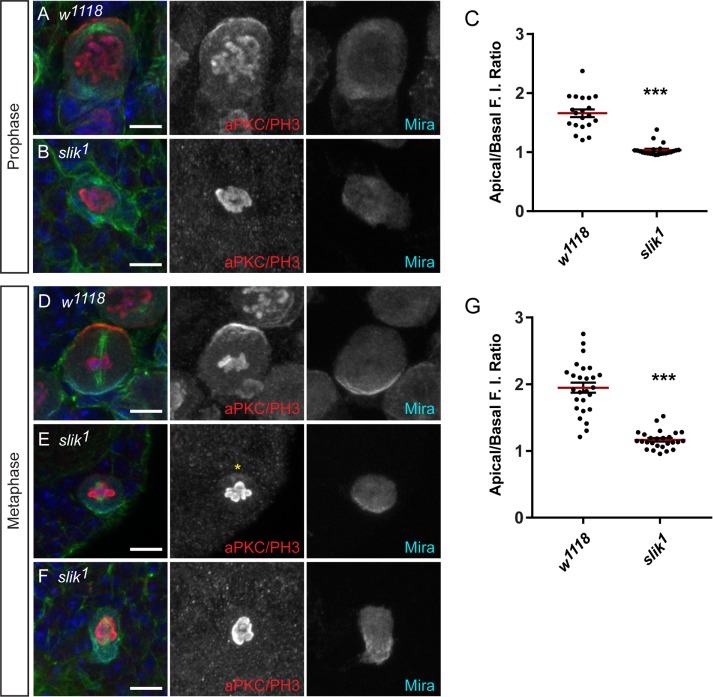
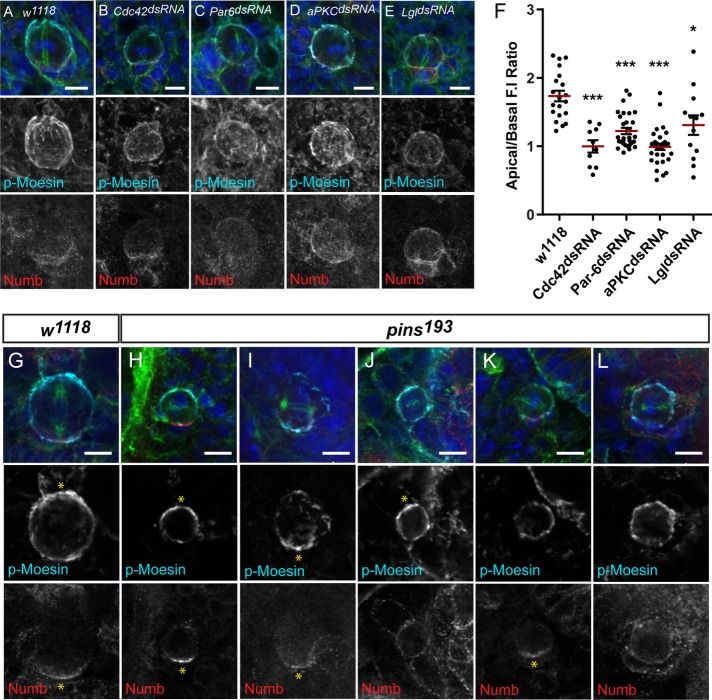
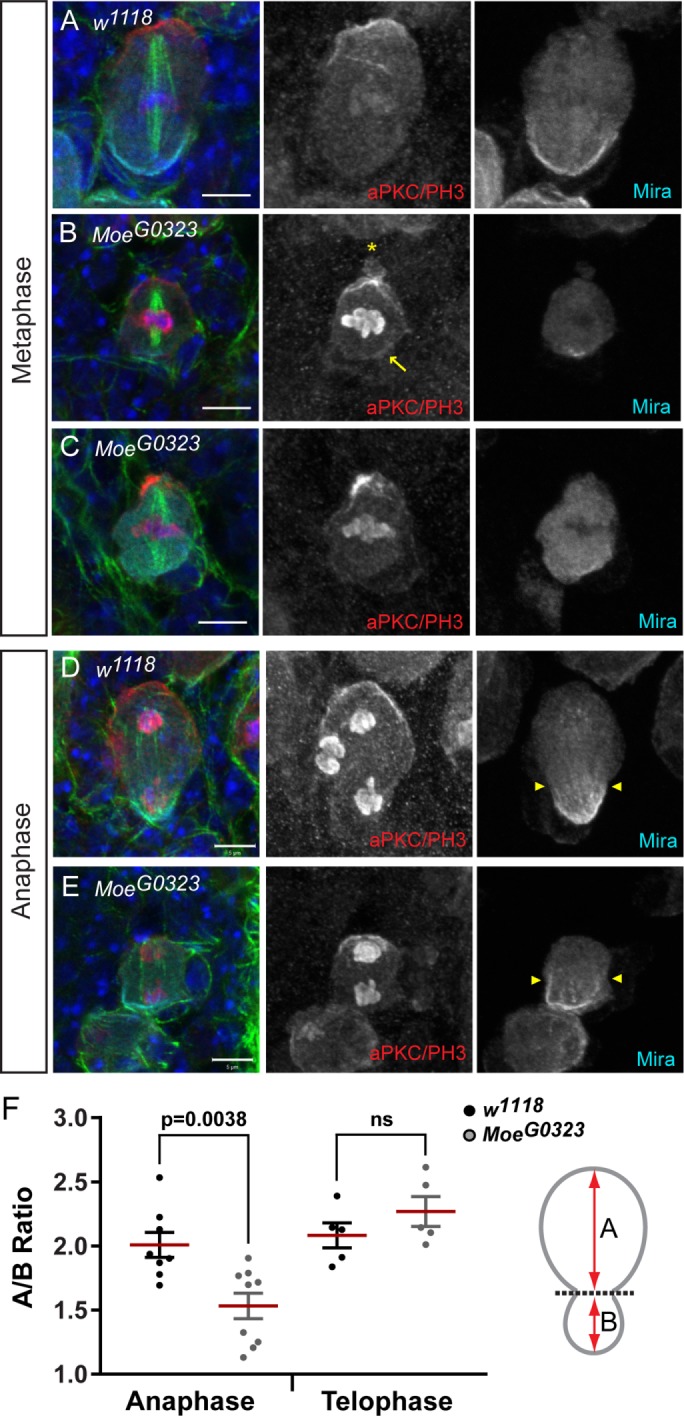
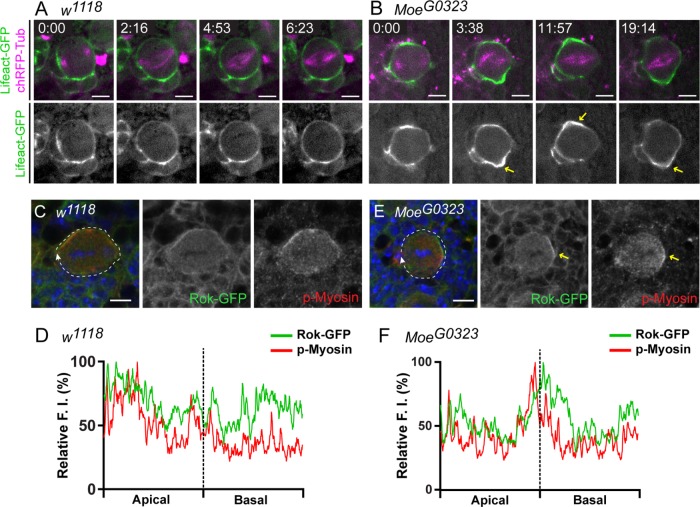
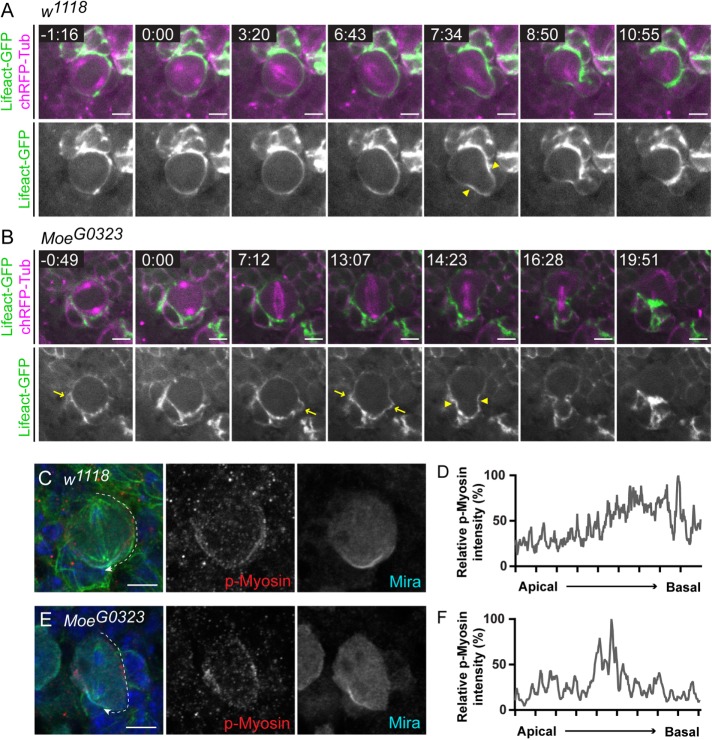
An intact actomyosin network is essential for anchoring polarity proteins to the cell cortex and maintaining cell size asymmetry during asymmetric cell division of Drosophila neuroblasts (NBs). However, the mechanisms that control changes in actomyosin dynamics during asymmetric cell division remain unclear. We find that the actin-binding protein, Moesin, is essential for NB proliferation and mitotic progression in the developing brain. During metaphase, phosphorylated Moesin (p-Moesin) is enriched at the apical cortex, and loss of Moesin leads to defects in apical polarity maintenance and cortical stability. This asymmetric distribution of p-Moesin is determined by components of the apical polarity complex and Slik kinase. During later stages of mitosis, p-Moesin localization shifts more basally, contributing to asymmetric cortical extension and myosin basal furrow positioning. Our findings reveal Moesin as a novel apical polarity protein that drives cortical remodeling of dividing NBs, which is essential for polarity maintenance and initial establishment of cell size asymmetry.


Figures

FIGURE 1:
FIGURE 1:
Phosphorylated Moesin localizes asymmetrically in mitotic NBs. (A) w1118 third instar larval central brain (CB) and optic lobe (OL) was fluorescently labeled with anti–p-Moesin (green) and anti-Prospero (Pros; magenta). P-Moesin localizes to the cortex of NBs with an asymmetric p-Moesin enrichment indicated by yellow arrows. (B, C) P-Moesin and the basal polarity protein (Numb) are enriched at opposite cortical poles during metaphase. (C) The relative mean FI of p-Moesin along the lateral cortex (indicated by the blue line in the schematic diagram) shows that p-Moesin is enriched at the apical cortex (compartment I) during metaphase (n = 5). (D, E) P-Moesin is reduced at the apical cortex during anaphase, with the relative mean FI of p-Moesin along the lateral cortex shown (n = 5). (F–H) P-Moesin is enriched at the basal cortex of the dividing NB and accumulates at the cleavage furrow site during telophase. (H) The relative mean FI of p-Moesin along the lateral cortex shows that p-Moesin is enriched at the basal NB cortex where the cleavage furrow forms (compartment IV; n = 5). (B, D, F, G) Merged panels are single focal plane images and show DAPI (blue), p-Moesin (green), Numb (red), and β-tubulin (cyan). Grayscale images are maximum intensity projections. Error bars represent SD. Scale bars represent (A) 50 μm and (B, D, F, G) 5 μm.
FIGURE 2:
FIGURE 2:
Moesin is essential for NB proliferation and mitotic progression. UAS-Dicer;;UAS-MoedsRNA was crossed to w1118 (Ctrl) and Insc-GAL4 (MoedsRNA). UAS-Dicer alone was crossed to Insc-GAL4 (Dicer). (A–C) The larval CNS of Control, Dicer, and MoedsRNA labeled with anti-Deadpan (Dpn; green) and anti–phospho-histone H3 (PH3; magenta) at 96 h after larval hatching (ALH) are shown. (D) The mean number of Dpn-positive cells and (E) mean proportion of PH3-positive, Dpn-positive cells per central brain lobes of Control, Dicer, and MoedsRNA at ∼24, 48, 72, and 96 h ALH (n = minimum of 28 brain lobes; see Materials and Methods for exact sample sizes). (F) The diameter of Control and MoedsRNA metaphase NBs at 48 h (n = 35 and 44 NBs, respectively) and 96 h (n = 23 NBs each) ALH. The red line marks the mean diameter. (G) The area of Control and MoedsRNA interphase NBs at 48 h ALH (n = 30 and 39 NBs, respectively). The red line marks the mean area. (H) The mean proportion of PH3-positive, Dpn-positive cells undergoing the specific stages of mitosis per central brain lobe of Control (n = 28) and MoedsRNA (n = 55) at 96 h ALH. In control brain lobes, the mean proportions (± SE) of mitotic NBs in the specific stages are 29.6 ± 2.0% (prophase), 43.4 ± 2.0% (metaphase), 7.2 ± 1.6% (anaphase), and 19.7 ± 1.6% (telophase). In MoedsRNA brain lobes, the mean proportions (± SE) of mitotic NBs are 60 ± 4.6% (mitotic defective), 13.9 ± 2.8% (prophase), 16.7 ± 2.6% (metaphase), 0.7 ± 0.3% (anaphase), and 4.6 ± 2.1% (telophase). Scale bars represent (A–C) 100 μm. Error bars represent SE. *p < 0.05, **p < 0.001, ***p < 0.0001, and ns = not significant using an unpaired t test.
FIGURE 3:
FIGURE 3:
Slik is essential for NB proliferation and Moesin phosphorylation. (A) w1118 larval NBs labeled with DAPI (blue), anti-Moesin (green), anti-Slik (red), and anti-Prospero (cyan). Slik partially colocalizes with Moesin at the NB cortex and localizes to the GMC cortex. (B) w1118 larval NB undergoing metaphase labeled with DAPI (blue), anti–p-Moesin (cyan), anti-Slik (green), and anti–α-tubulin (red) as shown in merged panel. (C) The apical/basal FI ratios of p-Moesin and Slik in metaphase NBs (n = 23) show that p-Moesin is apically enriched (1.99 ± 0.12; mean ± SE) and Slik is uniformly distributed at the apical and basal cortices (0.93 ± 0.04, p < 0.0001). The red line marks the mean ratio. (D, E) w1118 and slik1 larval CNS labeled with anti-Deadpan (Dpn; green) and anti–phospho-histone H3 (PH3; magenta) at 96 h ALH. (F) The mean number of Dpn-positive cells and (G) the mean proportion of PH3-positive, Dpn-positive cells per central brain lobes of w1118 (n = 35) and slik1 (n = 26) at 96 h ALH. (H) The diameter of metaphase NBs in w1118 (n = 25) and slik1 (n = 29) ∼5–6 d AEL. The red line marks the mean diameter. (I, J) w1118 and slik1 larval metaphase NBs labeled with DAPI (blue), anti–p-Moesin (cyan), anti-Numb (green), and anti–β-tubulin (red) at ∼5–6 d AEL. (J) The p-Moesin signal is reduced in slik1 mutant NBs during metaphase, compared with w1118 controls. Scale bars represent (A) 10 μm, (B, I, J) 5 μm, and (D, E) 100 μm. Error bars represent SE. ***p < 0.0001 using an unpaired t test.
FIGURE 4:
FIGURE 4:
Moesin is involved in apical polarity maintenance in NBs undergoing prophase and metaphase. UAS-Dicer;;UAS-MoesindsRNA was crossed to w1118 (Ctrl) and Insc-GAL4 (MoedsRNA) and larval NBs undergoing (A–D) prophase and (E–J) metaphase were analyzed ∼96 h ALH. (A) Bazooka (Baz) and (C) aPKC crescents form in control NBs during prophase. (B) Baz and (D) aPKC crescents are not observed in a proportion of MoedsRNA NBs during prophase. (C, D) Filamentous actin (Phalloidin; red) appears discontinuous in Moesin knockdown NBs undergoing prophase (yellow arrows) compared with controls. (E) Par-6 crescents form in control NBs during metaphase. (F) A weak polar Par-6 signal (yellow asterisk) and (G) an absent polar Par-6 signal is observed in MoedsRNA NBs during metaphase. (H) aPKC crescents form in control NBs during metaphase. (I) A weak polar aPKC signal (yellow asterisk) and polar Miranda is observed in MoedsRNA NBs during metaphase. (J) An absent polar aPKC and polar Miranda is observed in MoedsRNA NBs. Refer to Table 1 for summary of phenotypic proportions observed. Merged panels are single focal plane images and show DAPI (blue), Miranda (cyan), α-tubulin or aPKC/PH3 (green), and specified apical polarity protein or Phalloidin (red). Grayscale images are maximum intensity projections, with the exception of Phalloidin panels, which are single focal plane images. Scale bars represent 5 μm.
FIGURE 5:
FIGURE 5:
Slik is important for aPKC polarity maintenance in NBs. w1118 and slik1 larval NBs labeled with DAPI (blue), anti–α-tubulin (green), anti-aPKC/anti–phospho-histone H3 (aPKC/PH3; red), and anti-Miranda (Mira; cyan), ∼5–6 d AEL. (A) An aPKC crescent forms in w1118 NBs undergoing prophase. (B) An aPKC crescent is not observed in 87% of slik1 mutant NBs undergoing prophase (n = 23). (C) The apical/basal FI ratios of aPKC in w1118 (n = 20) and slik1 (n = 23) prophase NBs are shown. The red line marks the mean ratio. (D) An aPKC crescent is observed in w1118 metaphase NBs. (E) A weak polar aPKC signal is observed in 65% of slik1 NBs, indicated by the yellow asterisk, and (F) a polar aPKC signal is absent in 27% slik1 NBs during metaphase (n = 26). (G) The apical/basal FI ratios of aPKC in w1118 (n = 26) and slik1 (n = 26) metaphase NBs are shown. The red line marks the mean ratio. Merged panels are single focal plane images, and grayscale images are maximum intensity projections. Scale bars represent 5 μm. ***p < 0.0001 using an unpaired t test.
FIGURE 6:
FIGURE 6:
Apical polarity proteins are important for the asymmetric distribution of p-Moesin during metaphase. Third instar larval NBs of (A) w1118, (B) UAS-Cdc42dsRNA, (C) UAS-Par6dsRNA, (D) UAS-aPKCdsRNA, and (E) UAS-LgldsRNA crossed to Insc-GAL4. The p-Moesin immunofluorescence signal appears reduced at the apical cortex of metaphase NBs in the respective knockdowns, when compared with controls. (F) The apical/basal FI ratios of p-Moesin in metaphase NBs of controls (n = 20), Cdc42dsRNA (n = 10), Par-6dsRNA (n = 30), aPKCdsRNA (n = 33), and LgldsRNA (n = 13). The red line marks the mean ratio. (G–L) w1118 and pins193 larval NBs undergoing metaphase ∼5–6 AEL. (H–L) Multiple phenotypes are observed in pins193 mutant NBs during metaphase (n = 138), compared with (G) w1118 metaphase NBs, which display polar p-Moesin and polar Numb at opposite poles (100%, n = 57). Polar p-Moesin and Numb are enriched at (H) opposite poles (17%, n = 138) and (I) the same pole (19%, n = 138) in pins193 mutant NBs. (J) Polar p-Moesin and uniform Numb (17%, n = 138), (K) uniform/discontinuous p-Moesin and polar Numb (16%, n = 138), and (L) uniform/discontinuous p-Moesin and uniform Numb (20%, n = 138) distributions are observed in pins193 mutant NBs during metaphase. Polar enrichment is indicated by yellow asterisk. Merged panels are single focal plane images and show DAPI (blue), p-Moesin (cyan), Numb (red), and β-tubulin (green). Grayscale images in A–E are maximum intensity projections and in G–L are single focal plane images. Scale bars represent 5 μm. *p < 0.05 and ***p < 0.0001 using an unpaired t test.
FIGURE 7:
FIGURE 7:
Moesin is important for apical integrity and cortical asymmetric divisions. NBs from w1118 and MoeG0323 third instar larvae were labeled with DAPI (blue), anti–α-tubulin (green), anti-aPKC/anti–phospho-histone H3 (aPKC/PH3; red) and anti-Miranda (Mira; cyan). (A) A polar aPKC crescent forms in w1118 metaphase NBs. (B) A polar aPKC crescent, similar to controls, forms in 65% of MoeG0323 metaphase NBs (n = 116); however, aPKC localizes to ectopic cortical sites in 35% of these MoeG0323 NBs (yellow arrow; n = 75). Cortical blebbing is present in MoeG0323 NBs (yellow asterisk). (C) The polar aPKC domain appears disorganized in 21% of MoeG0323 NBs during metaphase (n = 116). (B, C) Miranda localizes to the opposite cortical pole of aPKC in 74% of MoeG0323 NBs (n = 116), although polar Miranda crescents appear reduced in size or diffuse compared with control NBs. (D) An asymmetric basal furrow is observed in w1118 NBs undergoing anaphase (yellow arrowheads). (E) Initial constriction at the presumptive cleavage furrow site (yellow arrowheads) appears symmetric in MoeG0323 NBs undergoing anaphase. (F) The quantification of A/B ratios in w1118 and MoeG0323 NBs undergoing anaphase (n = 8 and 9, respectively) and telophase (n = 5). The red line marks the mean ratio. Merged panels are single focal plane images, and grayscale images are maximum intensity projections. Scale bars represent 5 μm. ns = not significant using an unpaired t test.
FIGURE 8:
FIGURE 8:
Moesin is essential for maintaining a stable actomyosin cortex during metaphase. (A, B) Live imaging of Insc-GAL4; UAS-ChRFP-Tub, UAS-Lifeact-GFP crossed to w1118 and MoeG0323 to visualize filamentous actin (green) and the mitotic spindle (magenta) in NBs. Single focal plane images were selected from Supplemental Videos 1 and 2 to further demonstrate cortical dynamics during metaphase. The time value in the top left corner of the merged panels is shown in minutes:seconds. NEB occurs at 0:00. (A) A round and stable metaphase cortex is observed in w1118 NBs. (B) The NB cortex appears unstable and nonuniform cortical actin dynamics (yellow arrows) are observed in MoeG0323 mutant NBs during metaphase. (C–F) Metaphase NBs observed in larval brains isolated from Ubi-Rok-GFP crossed to (C, D) w1118 and (E, F) MoeG0323. (C, D) Rok-GFP and p-Myosin appear cortical with a slight apical enrichment, as shown in D where the relative FI was measured around the entire metaphase cortex (white dashed line in merged panel). (E, F) Rok-GFP and p-Myosin displayed a nonuniform distribution at the MoeG0323 metaphase cortex and was enriched at the lateral cortex (yellow arrows), as shown in F, where the relative FI was measured around the entire cortex (white dashed line in merge). Merged panels show DAPI (blue), anti–p-Myosin (red), and anti-GFP (green). Scale bars represent 5 μm.
FIGURE 9:
FIGURE 9:
Moesin regulates Myosin-induced furrow positioning during early anaphase. (A, B) Live imaging of Insc-GAL4; UAS-ChRFP-Tub, UAS-Lifeact-GFP crossed to w1118 and MoeG0323 to visualize filamentous actin (green) and the mitotic spindle (magenta) in the NBs. The time value in the top left corner of the merged panels is shown in minutes:seconds. NEB occurs at 0:00. (A) Furrow induction (yellow arrowheads) shows restricted cortical actin at this site in the w1118 control NB. (B) Cortical actin does not appear to be as restricted to the furrow site (yellow arrowheads) in the MoeG0323, as in the w1118 NB. Cortical blebbing (yellow arrows) is also observed throughout ACD of MoeG0323 NB. (C–F) w1118 and MoeG0323 larval NBs undergoing early anaphase were labeled with DAPI (blue), anti–α-tubulin (green), anti–p-Myosin (red), and anti-Miranda (Mira; cyan). (C, D) P-Myosin localizes to the basal furrow in 80% of w1118 NBs undergoing early anaphase (n = 5). The white dashed line from the apical to basal pole in the merged panel indicates the region of the cortex that was measured in D. (D) The relative p-Myosin FI along the w1118 lateral cortex from the apical to basal cortical pole shows that p-Myosin is enriched at the basal cortex. (E, F) P-Myosin localizes to the cell equator in the MoeG0323 NB shown and the p-Myosin basal furrow was not observed during early anaphase (100%; n = 5). The white dashed line from the apical to basal pole in the merge panel indicates the region of the cortex that was measured in F. (F) The relative p-Myosin FI along the MoeG0323 lateral cortex from the apical to basal cortical pole shows that p-Myosin peaks near the cell equator. All panels shown are a single focal plane images. Scale bars represent 5 μm.

References

    1. Albertson R, Chabu C, Sheehan A, Doe CQ. Scribble protein domain mapping reveals a multistep localization mechanism and domains necessary for establishing cortical polarity. J Cell Sci. 2004:6061–6070. - PubMed
    1. Albertson R, Doe CQ. Dlg, Scrib and Lgl regulate neuroblast cell size and mitotic spindle asymmetry. Nat Cell Biol. 2003:166–170. - PubMed
    1. Algrain M, Turunen O, Vaheri A, Louvard D, Arpin M. Ezrin contains cytoskeleton and membrane binding domains accounting for its proposed role as a membrane-cytoskeletal linker. J Cell Biol. 1993:129–139. - PMC - PubMed
    1. Atwood SX, Chabu C, Penkert RR, Doe CQ, Prehoda KE. Cdc42 acts downstream of Bazooka to regulate neuroblast polarity through Par-6 aPKC. J Cell Sci. 2007:3200–3206. - PMC - PubMed
    1. Bardet PL, Guirao B, Paoletti C, Serman F, Leopold V, Bosveld F, Goya Y, Mirouse V, Graner F, Bellaiche Y. PTEN controls junction lengthening and stability during cell rearrangement in epithelial tissue. Dev Cell. 2013:534–546. - PubMed

Publication types

MeSH terms

LinkOut - more resources