. 2018 Feb;59(2):312-329.
doi: 10.1194/jlr.M080374. Epub 2017 Dec 27.

Acid sphingomyelinase promotes mitochondrial dysfunction due to glutamate-induced regulated necrosis

Affiliations

Acid sphingomyelinase promotes mitochondrial dysfunction due to glutamate-induced regulated necrosis

Sergei A Novgorodov et al. J Lipid Res. 2018 Feb.

Abstract

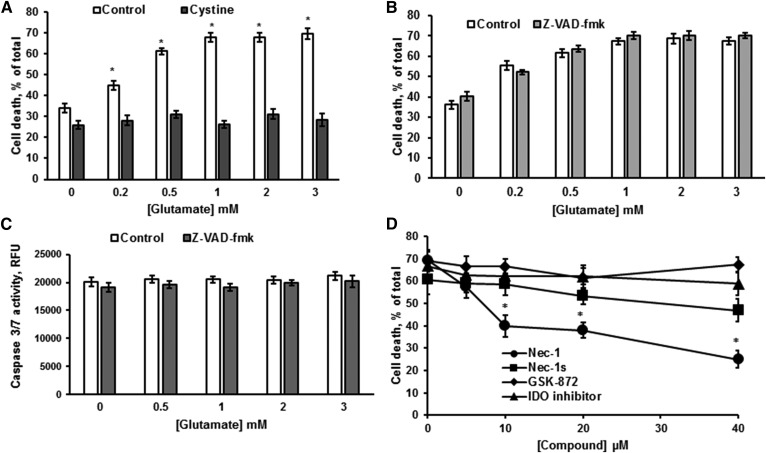
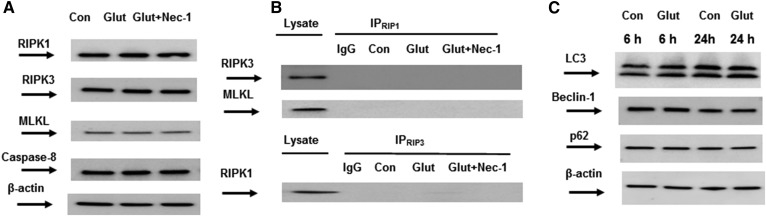
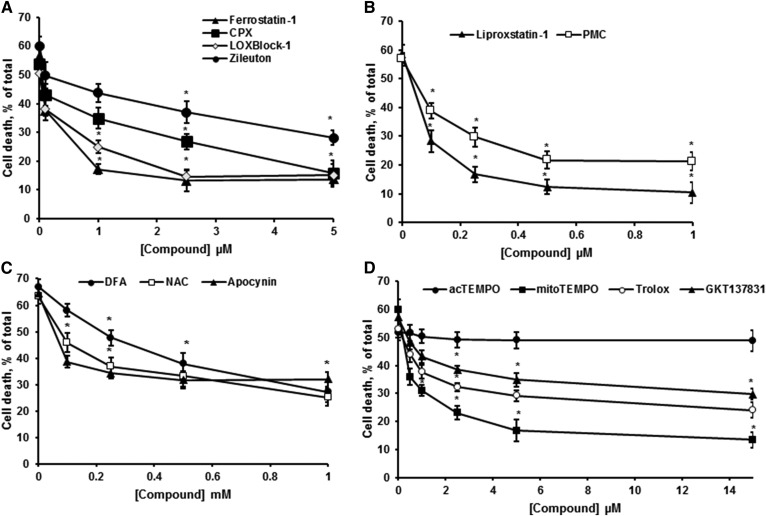
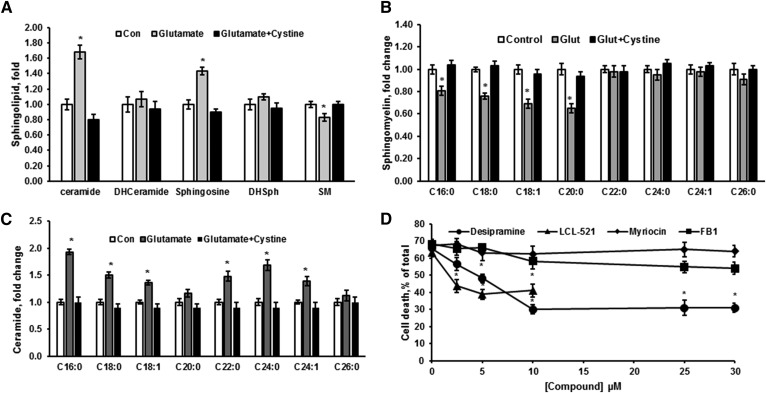
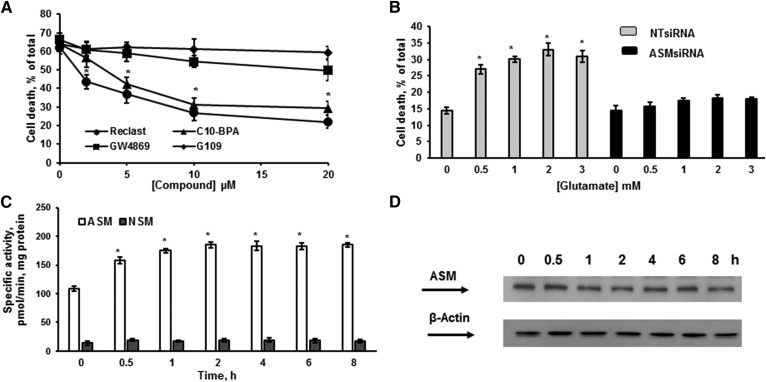
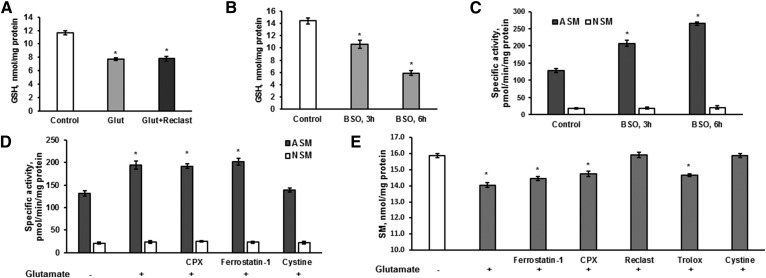
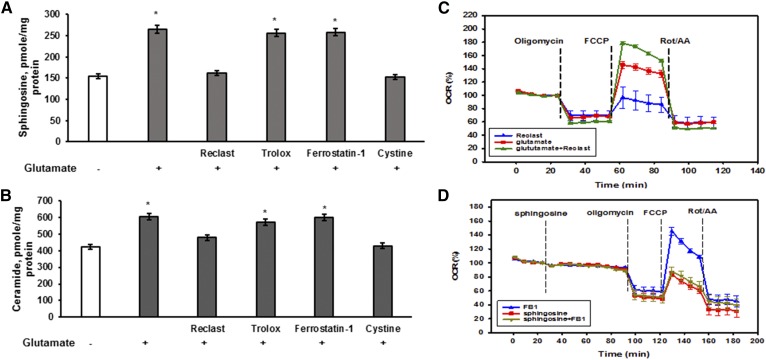
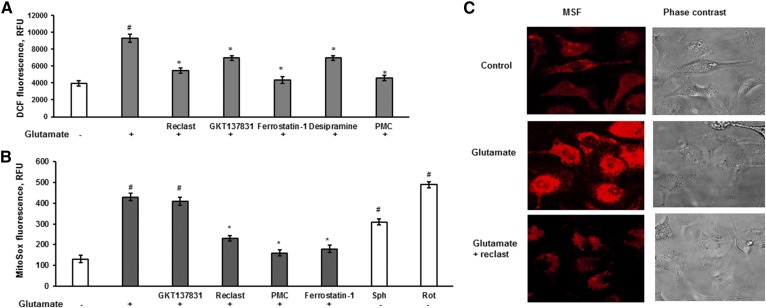
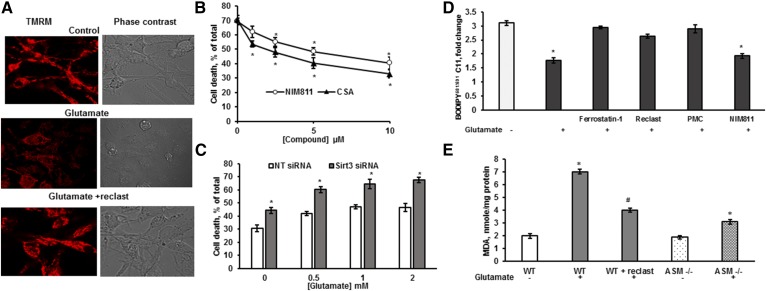
Inhibiting the glutamate/cystine antiporter system xc-, a key antioxidant defense machinery in the CNS, could trigger a novel form of regulated necrotic cell death, ferroptosis. The underlying mechanisms of system xc--dependent cell demise were elucidated using primary oligodendrocytes (OLs) treated with glutamate to block system xc- function. Pharmacological analysis revealed ferroptosis as a major contributing factor to glutamate-initiated OL death. A sphingolipid profile showed elevations of ceramide species and sphingosine that were preventable by inhibiting of an acid sphingomyelinase (ASM) activity. OL survival was enhanced by both downregulating ASM expression and blocking ASM activity. Glutamate-induced ASM activation seems to involve posttranscriptional mechanisms and was associated with a decreased GSH level. Further investigation of the mechanisms of OL response to glutamate revealed enhanced reactive oxygen species production, augmented lipid peroxidation, and opening of the mitochondrial permeability transition pore that were attenuated by hindering ASM. Of note, knocking down sirtuin 3, a deacetylase governing the mitochondrial antioxidant system, reduced OL survival. The data highlight the importance of the mitochondrial compartment in regulated necrotic cell death and accentuate the novel role of ASM in disturbing mitochondrial functions during OL response to glutamate toxicity, which is essential for pathobiology in stroke and traumatic brain injury.

Keywords: brain lipids; ferroptosis; glutamate/cystine antiporter; lipids/peroxidation; mitochondria; oligodendrocytes; sirtuin; sphingolipids.


Figures

Fig. 1.
Fig. 1.
Glutamate-elicited OL death does not involve apoptotic signaling mechanisms. OLs were treated with glutamate alone and in the presence of 1 mM cystine (A) or 30 μM ZVAD-fmk (B) for 24 h and cell survival was determined. Data are mean ± SE, *P < 0.05, n = 9. C: OLs were treated with glutamate with/without 30 μM Z-VAD-fmk for 24 h and caspase 3/7 activity was measured. Data are mean ± SE, n = 6. D: Cells were exposed to 1 mM glutamate in the presence of the necroptosis inhibitors, necrostatin-1 (Nec-1) and necrostatin-1s (Nec-1s), GSK-872, a RIP3 kinase inhibitor, and an IDO inhibitor. Cell survival was determined 24 h later. Data are mean ± SE, *P < 0.05, n = 9.
Fig. 2.
Fig. 2.
OL demise in response to glutamate is not mediated by necroptotic or autophagic signaling machinery. A: OLs were exposed to 1 mM glutamate (Glut) with/without 40 μM necrostatin-1 (Nec-1) for 24 h and cell lysates were analyzed by Western blotting using anti-RIPK1 (Cell Signaling Technology), anti-RIPK3 (Cell Signaling Technology), anti-MLKL (Thermo Fisher), and anti-caspase-8 (Cell Signaling Technology) antibodies. To confirm equal loading of samples, the membranes were stripped and probed with anti-β-actin (Sigma-Aldrich) antibody. Data are representative of three independent experiments. Con, control. B: Necrosome complex formation was probed in immunoprecipitation experiments. OLs were treated with 1 mM glutamate (Glut) with/without 40 μM necrostatin-1 (Nec-1) for 24 h. Cell lysates were immunoprecipitated with anti-RIPK1 antibodies (R&D Systems) and probed using anti-RIPK3 (Cell Signaling Technology) or anti-MLKL (Thermo Fisher) antibodies. In reciprocal experiments, cell lysates were immunoprecipitated with anti-RIPK3 antibodies (Cell Signaling Technology) and probed using anti-RIPK1 antibodies (R&D Systems). Input load: 20 μg/lane. As a control, the same immunoprecipitation procedure was performed except for primary antibody application (IgG). C: OLs were exposed to 1 mM glutamate (Glut) for 6 h or 24 h and the cell lysates’ (20 μg/lane) expression of autophagy markers was assessed by Western blotting using anti-LC3A (Cell Signaling Technology), anti-beclin-1 (Cell Signaling Technology), and anti-p62(Cell Signaling Technology) antibodies. To confirm equal loading of samples, the membranes were stripped and probed with anti-β-actin (Sigma-Aldrich) antibody. Data are representative of three independent experiments.
Fig. 3.
Fig. 3.
OL survival in response to glutamate was augmented by ferroptosis inhibitors. A–D: OLs were treated with 1 mM glutamate in the presence of inhibitors for 24 h and relative cell survival was determined. Data are mean ± SE, *P < 0.05, n = 12.
Fig. 4.
Fig. 4.
Sphingolipid changes in glutamate-treated OLs indicate activation of SM hydrolysis. Sphingolipids were analyzed in OLs treated with 1 mM glutamate alone and in the presence of 1 mM cystine for 24 h. Total ceramide, sphingosine, SM, dihydroceramide (DHCeramide), and dihydrosphingosine (DHSph) (A), SM species (B), and ceramide species (C) were quantified. Data are mean ± SE, *P < 0.05, n = 8. Each sample was normalized to its respective total protein levels. D: OLs were exposed to 1 mM glutamate with/without inhibitors of de novo sphingolipid synthesis, including myriocin and FB1 or SM hydrolysis pathway (desipramine and LCL-521) for 24 h and relative cell survival was determined. Data are mean ± SE, *P < 0.05, n = 12.
Fig. 5.
Fig. 5.
ASM activation is critical for OL survival after glutamate treatment. A: OLs were treated with 1 mM glutamate with/without ASM (Reclast and C10-BPA) and NSM (GW4869 and epoxyquinone G109) inhibitors and relative cell survival was determined. Data are mean ± SE, *P < 0.05, n = 12. B: OLs were transfected with 20 nM of nontargeting siRNA pool (NT siRNA) or 20 nM of specific siRNA pool targeting different regions of the ASM gene (ASMsiRNA). Cells were plated and cultured for 24 h, then treated with 1 mM glutamate and relative cell survival was measured 24 h following glutamate treatment. Data are mean ± SE, *P < 0.05, n = 12. C. Time-course of specific ASM and NSM activity changes was determined following OL treatment with 1 mM glutamate. The enzyme activity is expressed as picomoles of C15-SM per minute per milligram protein. Data are mean ± SE, *P < 0.05, n = 12. D: The time-course of ASM protein expression changes was assessed following OL exposure to 1 mM glutamate. Cell lysates (30 μg/lane) were analyzed using anti-ASM antibody. To confirm equal loading of samples, the membranes were stripped and probed with anti-β-actin (Sigma-Aldrich) antibody. Data are representative of three independent experiments.
Fig. 6.
Fig. 6.
ASM activation in response to glutamate is controlled by intracellular GSH in OLs. A: OLs were treated with 1 mM glutamate with/without the ASM inhibitor, Reclast (25 μM), for 6 h and GSH content was quantified. Data are mean ± SE, *P < 0.05, n = 8. B: OLs were exposed to 500 μM BSO and GSH content was determined. Data are mean ± SE, *P < 0.05, n = 8. C: OLs were treated with 500 μM BSO and specific ASM and NSM activity changes were determined. The enzyme activity is expressed as picomoles of C15-SM per minute per milligram protein. Data are mean ± SE, *P < 0.05, n = 12. D: OLs were exposed to 1 mM glutamate with/without the ferroptosis inhibitor, ferrostatin-1 (5 μM), the iron chelator, CPX (5 μM), or 1 mM cystine for 6 h. ASM and NSM specific activity was measured. The enzyme activity is expressed as picomoles of C15-SM per minute per milligram protein. Data are mean ± SE, *P < 0.05, n = 12. E: OLs were exposed to 1 mM glutamate with/without the ferroptosis inhibitor, ferrostatin-1 (5 μM), the iron chelator, CPX (5 μM), the radical scavenger, trolox (15 μM), the ASM inhibitor, Reclast (25 μM), or 1 mM cystine for 24 h. SM content changes were measured. Data are mean ± SE, *P < 0.05, n = 12. Each sample was normalized to its respective total protein levels.
Fig. 7.
Fig. 7.
ASM-dependent sphingosine accumulation mediates the inhibition of mitochondrial respiratory chain activity in OL response to glutamate. OLs were exposed to 1 mM glutamate with/without the ferroptosis inhibitor, ferrostatin-1 (5 μM), the iron chelator, CPX (5 μM), the radical scavenger, trolox (15 μM), the ASM inhibitor, Reclast (25 μM), or 1 mM cystine for 24 h. Sphingosine (A) and total ceramide (B) were measured. Data are mean ± SE, *P < 0.05, n = 12. Each sample was normalized to its respective total protein levels. C: OLs were treated with 1 mM glutamate for 6 h with/without 50 μM Reclast and the OCR was monitored. Data are representative of four independent experiments. D: OLs were treated with sphingosine or sphingosine with 50 μM FB1, a specific inhibitor of CerS activity, and the OCR was monitored. Data are representative of three independent experiments.
Fig. 8.
Fig. 8.
ASM activation is necessary for glutamate-dependent cellular and mitochondrial ROS generation. A. OLs were treated with 1 mM glutamate with/without 25 μM Reclast, 25 μM desipramine, 5 μM ferrostatin-1, 1 μM PMC, or 15 μM GKT137831 for 3 h and DCF fluorescence was measured. Data are mean ± SE, *P < 0.05 compared with nontreated cells, #P < 0.05 compared with glutamate-treated cells, n = 12. B: Cells were exposed to 1 mM glutamate with/without 25 μM Reclast, 25 μM desipramine, 5 μM ferrostatin-1, 1 μM PMC, or 15 μM GKT137831 for 3 h and MitoSox fluorescence was measured. Control cells were treated with either 25 μM sphingosine or 1 μM Rot as a positive control. #P < 0.05 compared with nontreated cells, *P < 0.05 compared with glutamate-treated cells, n = 12. C: OLs were treated with 1 mM glutamate with/without 25 μM Reclast for 3 h and MitoSox fluorescence (MSF) as well as phase contrast images were captured using confocal microscopy.
Fig. 9.
Fig. 9.
ASM is essential for glutamate-induced MPTP opening and activation of lipid peroxidation. A: Cells were exposed to 1 mM glutamate with/without 25 μM Reclast for 18 h, then loaded with TMRM, and the TMRM fluorescence as well as phase contrast images were captured using confocal microscopy. B: Cells were exposed to 1 mM glutamate with/without CSA or NIM811 and cell survival was quantified 24 h later. Data are mean ± SE, *P < 0.05, n = 12. C: OLs were transfected with 20 nM of nontargeting siRNA pool (NT siRNA) or 20 nM of specific siRNA pool targeting the Sirt3 gene (Sirt3 siRNA). Cells were cultured for 24 h, then treated with glutamate, and relative cell survival was measured 24 h later. Data are mean ± SE, *P < 0.05, n = 12. D: OLs were exposed to 1 mM glutamate with/without 5 μM ferrostatin-1, 25 μM Reclast, 1 μM PMC, or 10 μM NIM811 for 24 h and the ratio of BODIPY581/591 C11 fluorescence shift was quantified. Data are mean ± SE, *P < 0.05, n = 8. E: OLs were isolated from WT mice (WT) or from ASM-deficient mice (ASM−/−) were treated with 1 mM glutamate for 24 h. WT cells were treated with 1 mM glutamate with 25 μM Reclast. MDA content was measured. Data are mean ± SE, *P < 0.05 compared with nontreated cells, # P < 0.05 compared with glutamate-treated cells, n = 12.

Similar articles

Cited by

References

    1. Conrad M., Angeli J. P., Vandenabeele P., and Stockwell B. R.. 2016. Regulated necrosis: disease relevance and therapeutic opportunities. Nat. Rev. Drug Discov. 15: 348–366. - PMC - PubMed
    1. Degterev A., Huang Z., Boyce M., Li Y., Jagtap P., Mizushima N., Cuny G. D., Mitchison T. J., Moskowitz M. A., and Yuan J.. 2005. Chemical inhibitor of nonapoptotic cell death with therapeutic potential for ischemic brain injury. Nat. Chem. Biol. 1: 112–119. - PubMed
    1. Friedmann Angeli J. P., Schneider M., Proneth B., Tyurina Y. Y., Tyurin V. A., Hammond V. J., Herbach N., Aichler M., Walch A., Eggenhofer E., et al. . 2014. Inactivation of the ferroptosis regulator Gpx4 triggers acute renal failure in mice. Nat. Cell Biol. 16: 1180–1191. - PMC - PubMed
    1. Benveniste H., Drejer J., Schousboe A., and Diemer N.. 1984. Elevation of extracellular concentrations of glutamate and aspartate in rat hippocampus during transient cerebral ischemia monitored by intracerebral microdialysis. J. Neurochem. 43: 1369–1374. - PubMed
    1. Guerriero R. M., Giza C. C., and Rotenberg A.. 2015. Glutamate and GABA imbalance following traumatic brain injury. Curr. Neurol. Neurosci. Rep. 15: 27. - PMC - PubMed

Publication types

Substances

LinkOut - more resources