Clinical Trial
. 2018 Jan 23;90(4):e273-e281.
doi: 10.1212/WNL.0000000000004859. Epub 2017 Dec 27.

CSF neurofilament light chain and phosphorylated tau 181 predict disease progression in PSP

Collaborators, Affiliations
Clinical Trial

CSF neurofilament light chain and phosphorylated tau 181 predict disease progression in PSP

Julio C Rojas et al. Neurology. .

Abstract

Objective: To determine the ability of CSF biomarkers to predict disease progression in progressive supranuclear palsy (PSP).

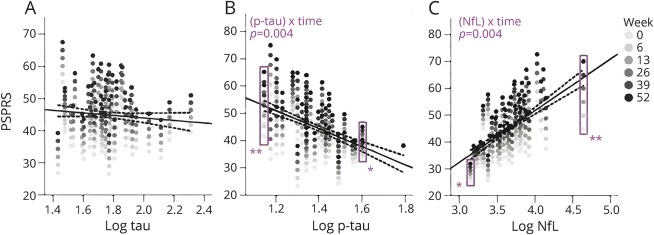
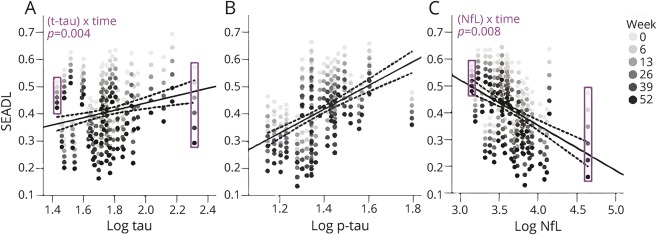
Methods: We compared the ability of baseline CSF β-amyloid1-42, tau, phosphorylated tau 181 (p-tau), and neurofilament light chain (NfL) concentrations, measured by INNO-BIA AlzBio3 or ELISA, to predict 52-week changes in clinical (PSP Rating Scale [PSPRS] and Schwab and England Activities of Daily Living [SEADL]), neuropsychological, and regional brain volumes on MRI using linear mixed effects models controlled for age, sex, and baseline disease severity, and Fisher F density curves to compare effect sizes in 50 patients with PSP. Similar analyses were done using plasma NfL measured by single molecule arrays in 141 patients.

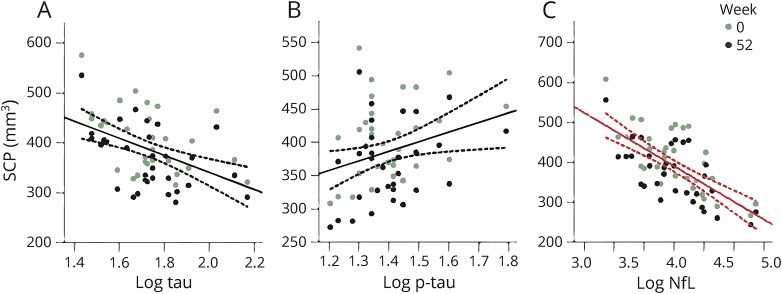
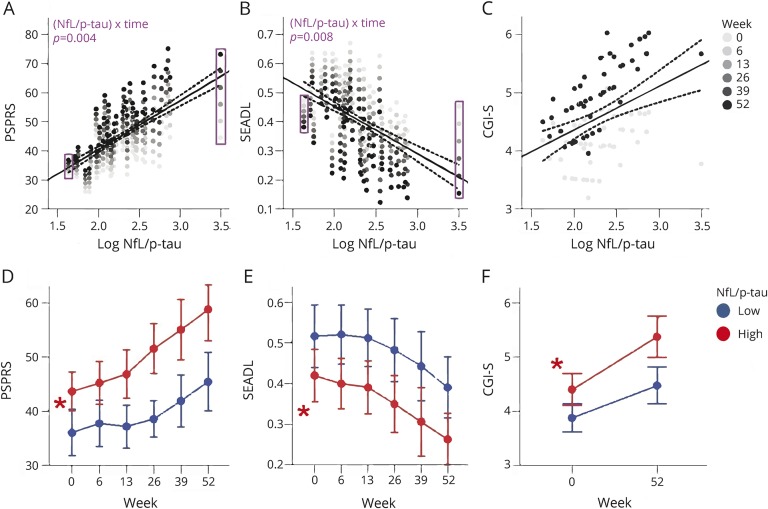
Results: Higher CSF NfL concentration predicted more rapid decline (biomarker × time interaction) over 52 weeks in PSPRS (p = 0.004, false discovery rate-corrected) and SEADL (p = 0.008), whereas lower baseline CSF p-tau predicted faster decline on PSPRS (p = 0.004). Higher CSF tau concentrations predicted faster decline by SEADL (p = 0.004). The CSF NfL/p-tau ratio was superior for predicting change in PSPRS, compared to p-tau (p = 0.003) or NfL (p = 0.001) alone. Higher NfL concentrations in CSF or blood were associated with greater superior cerebellar peduncle atrophy (fixed effect, p ≤ 0.029 and 0.008, respectively).

Conclusions: Both CSF p-tau and NfL correlate with disease severity and rate of disease progression in PSP. The inverse correlation of p-tau with disease severity suggests a potentially different mechanism of tau pathology in PSP as compared to Alzheimer disease.


Figures

Figure 1
Figure 1. Progressive Supranuclear Palsy Rating Scale (PSPRS) change predicted by baseline CSF biomarker concentration
(A–C) PSPRS as a function of baseline biomarker concentration (log transformed, ng/mL) from linear mixed effects models. Each patient's longitudinal PSPRS scores appear as a vertical array of dots of increasing saturation (lightest at baseline to darkest at 52 weeks). Each individual's rate of change in PSPRS scores is depicted by the vertical distance between dots. In the examples within the purple rectangles in B and C, the rate of change is small at either high CSF phosphorylated tau 181 (p-tau) (≈log 1.8 or 63 ng/mL) or low neurofilament light chain (NfL) (≈log 3.2 or 1,600 ng/mL) concentrations (*), whereas it is relatively higher at low p-tau (≈log 1.2 or 16 ng/mL) and high NfL (≈log 4.5 or 31,600 ng/mL) (**), reflecting a time by biomarker interaction. There was no relationship between baseline CSF tau and rate of PSPRS change (A). p Values adjusted for false discovery rate (FDR) are shown for the interactions. The regression lines represent fixed effects of biomarkers on PSPRS scores and dotted lines represent 95% confidence intervals fit to the mean value of all time points for each individual. Fixed effects were present only for NfL, but did not survive FDR correction. FDR-adjusted p values are shown for (biomarker) × time interactions. Models are corrected for age, sex, and baseline Mini-Mental State Examination.
Figure 2
Figure 2. Schwab and England Activities of Daily Living (SEADL) scale change predicted by baseline CSF biomarker concentration
(A–C) SEADL as a function of baseline biomarker concentration (log-transformed) from linear mixed effects models. Predicted scores are represented by arrays of dots of increasing intensity, and are associated with a particular baseline biomarker level. As revealed when comparing the purple rectangles at the extremes of the x axis, for tau (A) and neurofilament light chain (NfL) (C), there is higher variability in SEADL scores (i.e., rate of progression depicted by the vertical distance between dots) with higher values on the x axis, which reflects significant time by biomarker interactions. p Values (false discovery rate [FDR]–corrected) are shown for (biomarker) × time interactions. The regression lines represent fixed effects of biomarker concentrations on SEADL scores. Fixed effects were observed for tau and phosphorylated tau 181 (p-tau) (B), but these did not survive false discovery rate adjustment. Dotted lines represent 95% confidence intervals. Models are corrected for age, sex, and baseline Mini-Mental State Examination.
Figure 3
Figure 3. CSF neurofilament light chain (NfL) is correlated with superior cerebellar peduncle (SCP) volume
(A) Tau, (B) phosphorylated tau 181 (p-tau), (C) NfL. SCP volume presented as a function of baseline biomarker concentration (log-transformed), from linear mixed effects model. A fixed effect of CSF NfL on SCP volume (p = 0.008, false discovery rate–corrected) is represented by a red regression line. Dotted lines represent 95% confidence intervals. No biomarker concentration by time interactions were observed. Models are corrected for age, sex, magnet strength, and total intracranial volume.
Figure 4
Figure 4. CSF neurofilament light chain (NfL)/phosphorylated tau 181 (p-tau) predicts clinical decline and stratifies patients by disease severity
(A–C) Clinical assessments as a function of baseline biomarker concentration, from linear mixed effects models corrected for age, sex, and baseline Mini-Mental State Examination. Significant biomarker by time interactions (i.e., differences in the rate of change in clinical scores over time as function of NfL/p-tau concentrations) are observed for Progressive Supranuclear Palsy Rating Scale (PSPRS) and Schwab and England Activities of Daily Living (SEADL) scores. False discovery rate (FDR)–adjusted p values are shown for the interactions. The regression lines represent fixed effects of biomarker concentrations on clinical scores. Fixed effects were present in PSPRS, but did not survive FDR adjustment. Dotted lines represent 95% confidence intervals. (D–F) Median values are displayed for NfL/p-tau ≤198.9 in blue and >198.9 in red. Bars represent 95% confidence intervals. Asterisks represent fixed effects of NfL/p-tau group as a categorical variable. CGI-S = Clinical Global Impression of Severity.

References

    1. Rojas JC, Boxer AL. Neurodegenerative disease in 2015: targeting tauopathies for therapeutic translation. Nat Rev Neurol 2016;12:74–76. - PMC - PubMed
    1. Dickson DW, Rademakers R, Hutton ML. Progressive supranuclear palsy: pathology and genetics. Brain Pathol 2007;17:74–82. - PMC - PubMed
    1. Hoglinger GU, Respondek G, Stamelou M, et al. . Clinical diagnosis of progressive supranuclear palsy: the Movement Disorder Society criteria. Mov Disord 2017;32:853–864. - PMC - PubMed
    1. Boxer AL, Yu JT, Golbe LI, Litvan I, Lang AE, Hoglinger GU. Advances in progressive supranuclear palsy: new diagnostic criteria, biomarkers, and therapeutic approaches. Lancet Neurol 2017;16:552–563. - PMC - PubMed
    1. Mattsson N, Lonneborg A, Boccardi M, Blennow K, Hansson O, Geneva Task Force for the Roadmap of Alzheimer's Biomarkers. Clinical validity of cerebrospinal fluid Abeta42, tau, and phospho-tau as biomarkers for Alzheimer's disease in the context of a structured 5-phase development framework. Neurobiol Aging 2017;52:196–213. - PubMed

Publication types

MeSH terms