. 2018 Apr;38(4):669-686.
doi: 10.1177/0271678X17749689. Epub 2017 Dec 28.

Molecular characterization of perivascular drainage pathways in the murine brain

Affiliations

Molecular characterization of perivascular drainage pathways in the murine brain

Melanie-Jane Hannocks et al. J Cereb Blood Flow Metab. 2018 Apr.

Erratum in

  • Erratum.
    [No authors listed] [No authors listed] J Cereb Blood Flow Metab. 2018 Aug;38(8):1384. doi: 10.1177/0271678X18775331. J Cereb Blood Flow Metab. 2018. PMID: 30066612 Free PMC article.

Abstract

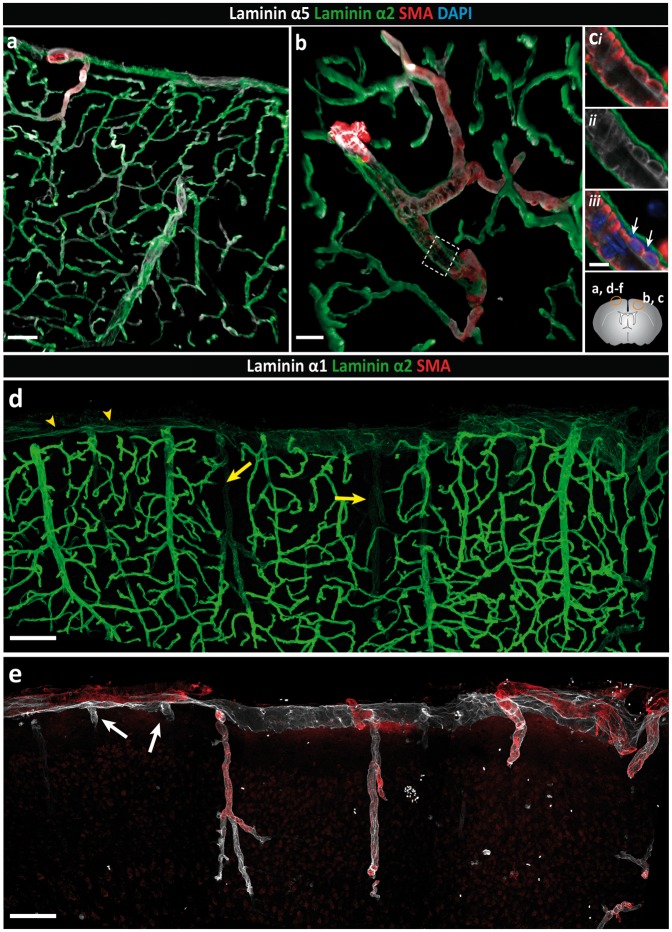
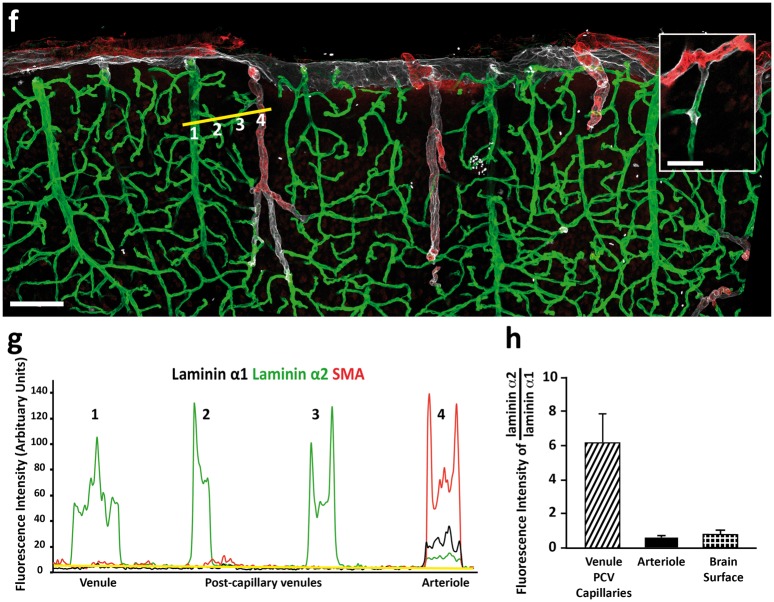
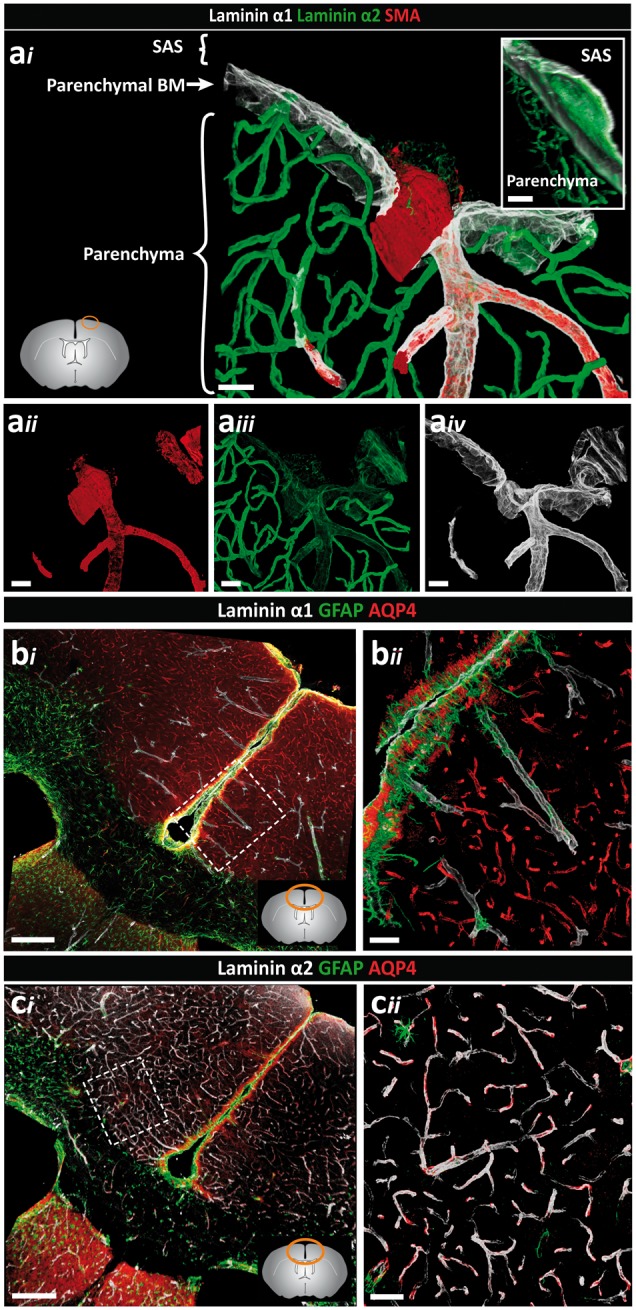
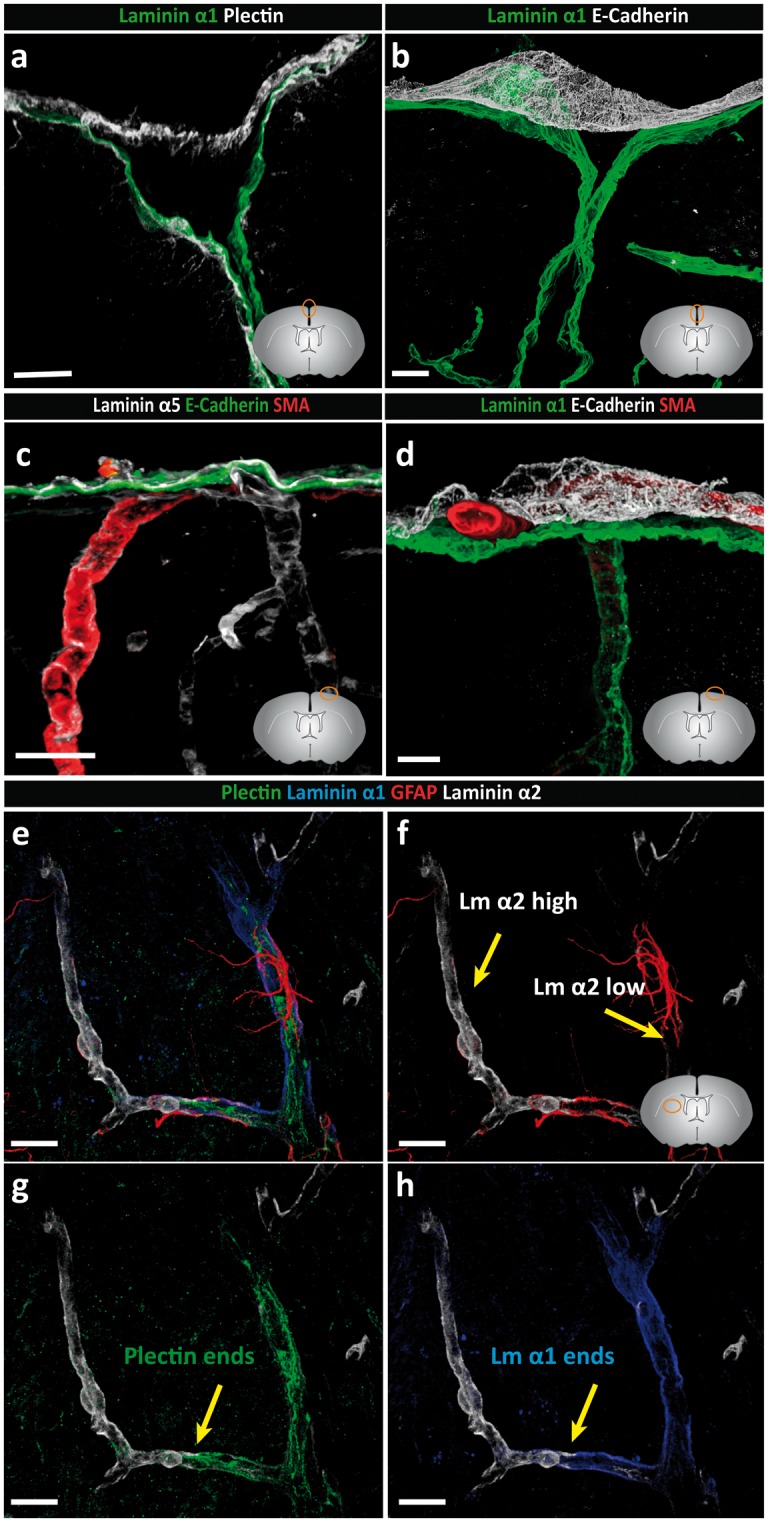
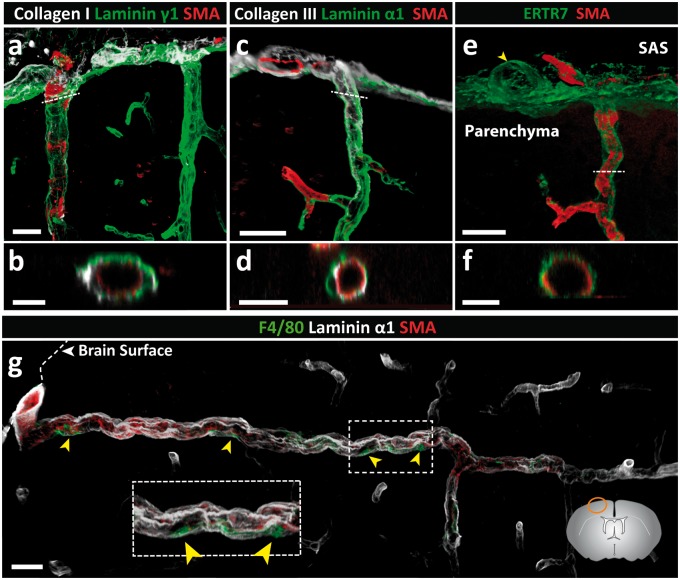
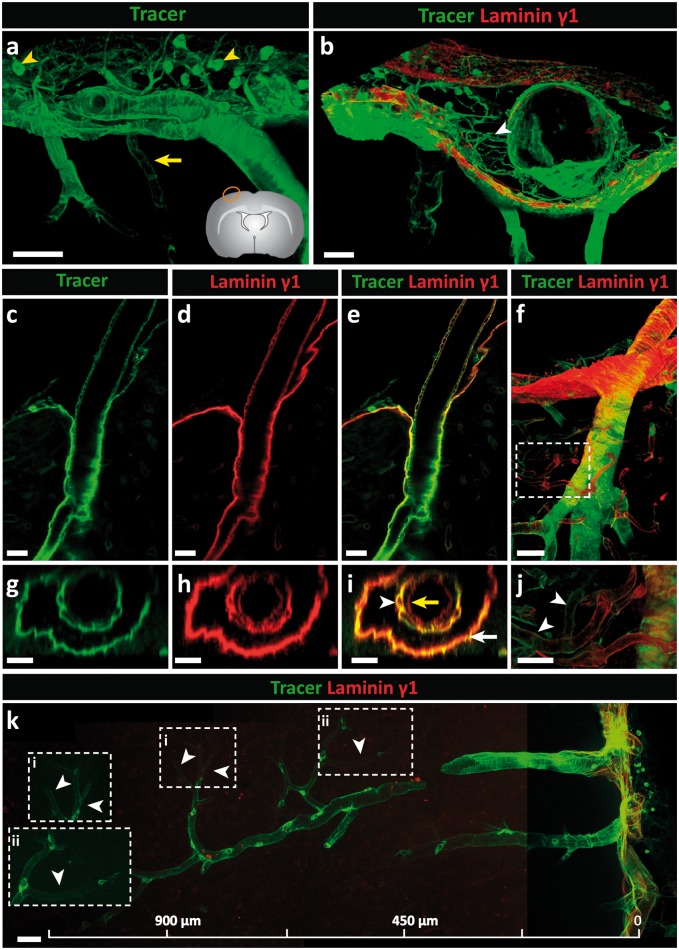
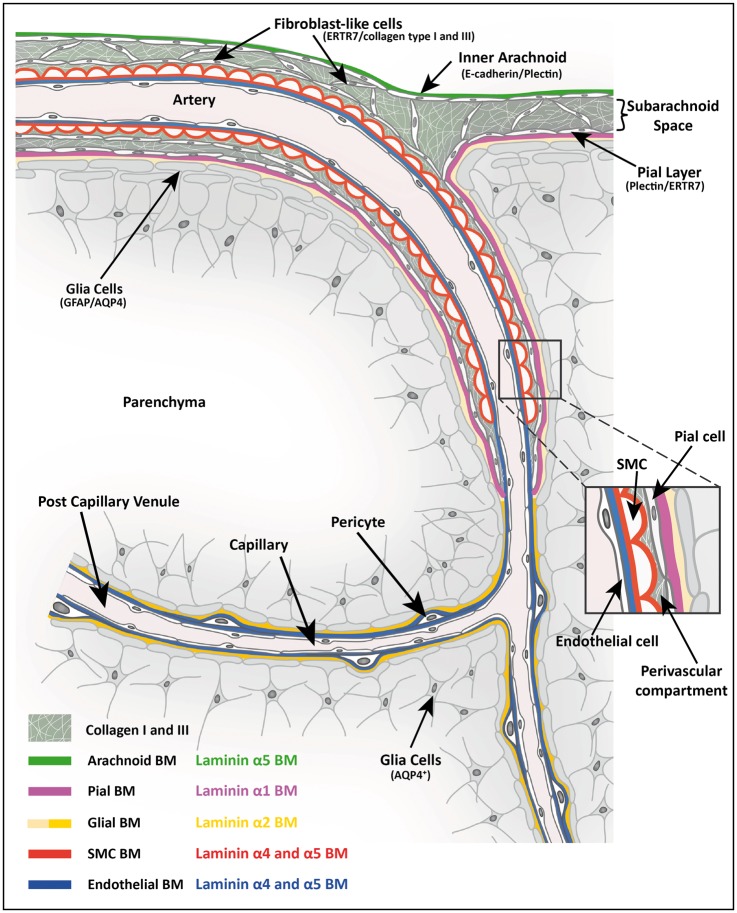
Perivascular compartments surrounding central nervous system (CNS) vessels have been proposed to serve key roles in facilitating cerebrospinal fluid flow into the brain, CNS waste transfer, and immune cell trafficking. Traditionally, these compartments were identified by electron microscopy with limited molecular characterization. Using cellular markers and knowledge on cellular sources of basement membrane laminins, we here describe molecularly distinct compartments surrounding different vessel types and provide a comprehensive characterization of the arachnoid and pial compartments and their connection to CNS vessels and perivascular pathways. We show that differential expression of plectin, E-cadherin and laminins α1, α2, and α5 distinguishes pial and arachnoid layers at the brain surface, while endothelial and smooth muscle laminins α4 and α5 and smooth muscle actin differentiate between arterioles and venules. Tracer studies reveal that interconnected perivascular compartments exist from arterioles through to veins, potentially providing a route for fluid flow as well as the transport of large and small molecules.

Keywords: Basement membranes; cerebrospinal fluid; fluid flow; laminin; perivascular pathways.


Figures

Figure 1.
Figure 1.
Differential distribution of basement membrane laminin α chains. Adult mouse brain tissue sections (100 µm) were immunofluorescently stained for the BM proteins laminin α1, α2 and α5, and smooth muscle actin (SMA) to identify smooth muscle cells. The diagram on the right side shows the locations where images were taken. (a) Low-magnification image showing broad distribution of both laminin α2 and laminin α5 along blood vessels and at the surface of the brain. (b) The laminin α2 positive BM, which marks the border to the brain parenchyma, is distinct from the laminin α5 positive BM of the endothelial and smooth muscle cells. (c) High magnification images of the boxed area in (b) reveal a perivascular compartment between the outer laminin α2 positive BM and the laminin α5-positive BM of the smooth muscle cells in which different cell layers (adventitial layer of the arteriole, pial cells and perivascular macrophages) are present (white arrows indicate DAPI stained nuclei). Images shown are representative of five independent experiments performed on five mice. (d) Intense laminin α2 staining occurs around blood vessels within the CNS and weaker staining at the surface of the brain (yellow arrowheads) and along penetrating SMA+ arterioles (yellow arrows). (e) Laminin α1 staining is restricted, occurring mainly at the brain surface and surrounding SMA+ penetrating arterioles. In contrast to arterioles, laminin α1 staining around SMA venules (white arrows) extends only a short distance into the parenchyma. (f) Merge of image (d) and (e) showing clear distinction between arterioles and venules/veins. Inset shows the abrupt ending of the laminin α1 BM. (g) Plot profile showing the differential fluorescence intensities (arbitrary units) for laminin α1, α2 and SMA across vessels as indicated by the yellow bar in (f). Images shown are representative of seven independent experiments performed on seven mice. (h) Fluorescence intensity ratios of laminin α2 to laminin α1 highlight the low expression of laminin α2 along arterioles and at the brain surface, and high expression along venules, post-capillary venules (PCV) and capillaries. Data are means ± S.E.M of three mice and three images/mouse. Scale bars: (a) 50 µm, (b) 25 µm, (c) 10 µm, (d, e, f) 100 µm, (inset) 30 µm.
Figure 1.
Figure 1.
Differential distribution of basement membrane laminin α chains. Adult mouse brain tissue sections (100 µm) were immunofluorescently stained for the BM proteins laminin α1, α2 and α5, and smooth muscle actin (SMA) to identify smooth muscle cells. The diagram on the right side shows the locations where images were taken. (a) Low-magnification image showing broad distribution of both laminin α2 and laminin α5 along blood vessels and at the surface of the brain. (b) The laminin α2 positive BM, which marks the border to the brain parenchyma, is distinct from the laminin α5 positive BM of the endothelial and smooth muscle cells. (c) High magnification images of the boxed area in (b) reveal a perivascular compartment between the outer laminin α2 positive BM and the laminin α5-positive BM of the smooth muscle cells in which different cell layers (adventitial layer of the arteriole, pial cells and perivascular macrophages) are present (white arrows indicate DAPI stained nuclei). Images shown are representative of five independent experiments performed on five mice. (d) Intense laminin α2 staining occurs around blood vessels within the CNS and weaker staining at the surface of the brain (yellow arrowheads) and along penetrating SMA+ arterioles (yellow arrows). (e) Laminin α1 staining is restricted, occurring mainly at the brain surface and surrounding SMA+ penetrating arterioles. In contrast to arterioles, laminin α1 staining around SMA venules (white arrows) extends only a short distance into the parenchyma. (f) Merge of image (d) and (e) showing clear distinction between arterioles and venules/veins. Inset shows the abrupt ending of the laminin α1 BM. (g) Plot profile showing the differential fluorescence intensities (arbitrary units) for laminin α1, α2 and SMA across vessels as indicated by the yellow bar in (f). Images shown are representative of seven independent experiments performed on seven mice. (h) Fluorescence intensity ratios of laminin α2 to laminin α1 highlight the low expression of laminin α2 along arterioles and at the brain surface, and high expression along venules, post-capillary venules (PCV) and capillaries. Data are means ± S.E.M of three mice and three images/mouse. Scale bars: (a) 50 µm, (b) 25 µm, (c) 10 µm, (d, e, f) 100 µm, (inset) 30 µm.
Figure 2.
Figure 2.
Distinct orientation and differential expression of the parenchymal BM laminin α chains. Adult mouse brain tissue sections (100 µm) were immunofluorescently stained for the parenchymal BM proteins laminin α1 and laminin α2, smooth muscle actin (SMA) and glial fibrillar acidic protein (GFAP) or aquaporin-4 (AQP4) to identify astroglia. (ai) Penetrating arterioles, identified by the presence of SMA positive smooth muscle cells (aii) are surrounded by low laminin α2 (aiii) and high laminin α1 staining (aiv). Note low laminin α2 staining at the surface of the brain. Inset shows the orientation of the laminin α1 BM towards the CSF and the laminin α2 BM towards the parenchyma. Images shown are representative of seven independent experiments performed on seven mice. (bi) Intense laminin α1 staining occurs at the surface of the brain and along penetrating arterioles at sites where astroglia endfeet show strong GFAP staining. (bii) High magnification image of the boxed area in (bi). Images shown are representative of three independent experiments performed on three mice. (ci) By contrast, intense laminin α2 staining occurs around vessels associated with astroglia expressing AQP4 but no GFAP. (cii) High-magnification image of the boxed area in (ci). Lower left diagram in (ai), and lower right in (bi) and (ci) shows where images were taken. Images shown are representative of three independent experiments performed on three mice. Scale bars: (ai–iv) 30 µm, (bi, ci) 130 µm, (bii, cii, inset) 50 µm; SAS: subarachnoid space.
Figure 3.
Figure 3.
Basement membranes of the pial and arachnoid layer are molecularly distinct. Adult mouse brain tissue sections (100 µm) were immunofluorescently stained for E-cadherin, plectin and laminins α1 and α5. (a) Arachnoid and pial layers are positive for plectin. The laminin α1 BM occurs in close association with the plectin+ pial cells which is distinct from the E-cadherin+ arachnoid layer (b). (c) Laminin α5-positive BMs underlie the inner arachnoid layer, surround each smooth muscle cell and underlie endothelial cells. (d) Staining for SMA showing the presence of arterioles between the laminin α1+ pial BM and the E-cadherin+ arachnoid layer, confirming that the arachnoid layer does not produce laminin α1. (e–h) Quadruple staining for plectin, GFAP, laminin α1 and laminin α2 demonstrating close association of GFAP+ astrocytes with the laminin α2 low astroglial BM, which correlate with the laminin α1+ plectin+ pial layer. Abrupt loss of laminin α1 staining is coincident with loss of plectin+ pial epithelial cells. Diagrams in the lower right of panels (a–d, f) show the location of images. Scale bars: (a) 20 µm, (b) 50 µm, (c) 30 µm, (d–h) 20 µm. Images shown are representative of eight independent experiments performed on eight mice.
Figure 4.
Figure 4.
Identification of the adventitial layer. Adult mouse brain tissue sections (100 µm) were immunofluorescently stained for fibrillar type I and III collagens and reticular fibroblast (ERTR7) or macrophage (F4/80) markers. Both collagen types I (a, b) and III (c, d) are detected in the meninges and surrounding penetrating arterioles. Cross-sectional views (position indicated by dotted white line) demonstrate the localisation of collagen types I (b) and III (d) between the SMA+ smooth muscle layer and the laminin+ pial BM. (e) ERTR7+ fibroblasts are abundantly present in the meninges and around vessels, both penetrating into the parenchyma and in the subarachnoid space (SAS) (yellow arrowhead). (f) Cross-sectional views (position indicated by dotted white line in (e)) demonstrating that ERTR7 staining occurs outside of the SMA+ smooth muscle layer. Images shown (a–f) are representative of seven independent experiments performed on seven mice. (g) Perivascular macrophages (F4/80) (yellow arrowheads) occur between the smooth muscle actin layer of the arterioles and the laminin α1+ pial BM. Boxed area is enlarged. The diagram in (g) showing the location of the different images. Scale bar: (a, b) 30 µm, (c,) 25 µm, (e) 40 µm, (d, f, g) 20 µm. Images shown are representative of three independent experiments performed on three mice.
Figure 5.
Figure 5.
Intracisternally infused immunoglobulin G (IgG) tracer studies in the rat. Tracer (goat anti-rabbit IgG-Alexa Fluor 488) was infused into the CSF of adult rats via the cisterna magna at a rate of 1.6 µl/min for 50 min; 100 µm thick sections were stained with the mouse anti-human laminin γ1 antibody. (a) At the surface of the brain, tracer associated with the arachnoid and pial layers and the smooth muscle cells of arteries. A limited amount of tracer associated with venules close to the surface of the brain (yellow arrow). Macrophages (yellow arrowhead) in the subarachnoid space phagocytise the tracer. (b) Laminin γ1 staining showing that tracer associates with both the arachnoid and the pial BMs, and laminin γ1-negative trabeculae composed of fibrillar collagens (white arrowhead). (c–e) A longitudinal optical slice (taken from f) showing the accumulation of tracer around the smooth muscle cells of a penetrating arteriole; (g, h, i) corresponding cross-section images show tracer accumulation in smooth muscle BMs (white arrowhead) and parenchymal BMs (white arrow) but not in endothelial BMs (yellow arrow). (j) Highlighted area in (f) shows tracer around capillaries (white arrowheads). (k) Tracer is detectable around a penetrating cortical artery down to the level of capillaries (white arrowheads). Boxed areas in k (i, ii) are shown at higher magnifications to the left. Scale bars: (a) 50 µm, (b, f) 30 µm, (c–e, g–j) 20 µm, (k) 45 µm. Images shown are representative of three independent experiments performed on three rats.
Figure 6.
Figure 6.
Schematic diagram showing the cellular and extracellular matrix markers of cerebral vessels and potential perivascular compartments. Depicted is a leptomeningeal artery in the subarachnoid space as it penetrates the brain parenchyma and gives rise to an arteriole, capillary and finally a post-capillary venule. The subarachnoid space is bordered by the inner E-cadherin+, plectin+, laminin α5+ arachnoid epithelial layer and the E-cadherin, plectin+ laminin α1+ pial epithelial layer, the latter lying subjacent to the GFAP+ glial limitans and its associated laminin α2low BM. ERTR7+, collagen types I and III positive fibroblasts exist in the subarachnoid space and surround arteries in the leptomeninges. The ERTR7+, SMA+ penetrating arteries are ensheathed by the pial layer and glial limitans, and their respective BMs, as they penetrate the CNS allowing for a perivascular compartment to form between the outer smooth muscle cell layer of the arteriole and the pial border to the CNS parenchyma. The pial layer and its laminin α1+ BM end abruptly at the transition from arteriole to capillary as defined by the loss of smooth muscle actin staining. However, the laminin α2high parenchymal BM produced by the GFAP, AQP4+ astroglial layer continues to the level of capillaries, postcapillary venules and venules and is subjacent to the laminin α4/α5 positive endothelial BM, thereby, providing a potential route for passage of solutes from the subarachnoid space to the capillaries, postcapillary venules and venules.

References

    1. Hutchings M, Weller RO. Anatomical relationships of the pia mater to cerebral blood vessels in man. J Neurosurg 1986; 65: 316–325. - PubMed
    1. Ichimura T, Fraser PA, Cserr HF. Distribution of extracellular tracers in perivascular spaces of the rat brain. Brain Res 1991; 545: 103–113. - PubMed
    1. Krisch BL, H.; Oksche, A. The meningea compartments of ME and cortex. Comparative analysis in rat. Cell Tissue Res 1983; 228: 597–640. - PubMed
    1. Krisch BL, Leonhardt H, Oksche A. Compartments and perivascular arrangement of the meninges covering the cerebral cortex of the rat. Cell Tissue Res 1984; 238: 459–474. - PubMed
    1. Rennels ML, Gregory TF, Blaumanis OR, et al. Evidence for a ‘paravascular' fluid circulation in the mammalian central nervous system, provided by the rapid distribution of tracer protein throughout the brain from the subarachnoid space. Brain Res 1985; 326: 47–63. - PubMed

Publication types

LinkOut - more resources