. 2018 Feb 6;57(5):701-710.
doi: 10.1021/acs.biochem.7b01142. Epub 2018 Jan 17.

Mechanism of N2 Reduction Catalyzed by Fe-Nitrogenase Involves Reductive Elimination of H2

Affiliations

Mechanism of N2 Reduction Catalyzed by Fe-Nitrogenase Involves Reductive Elimination of H2

Derek F Harris et al. Biochemistry. .

Abstract

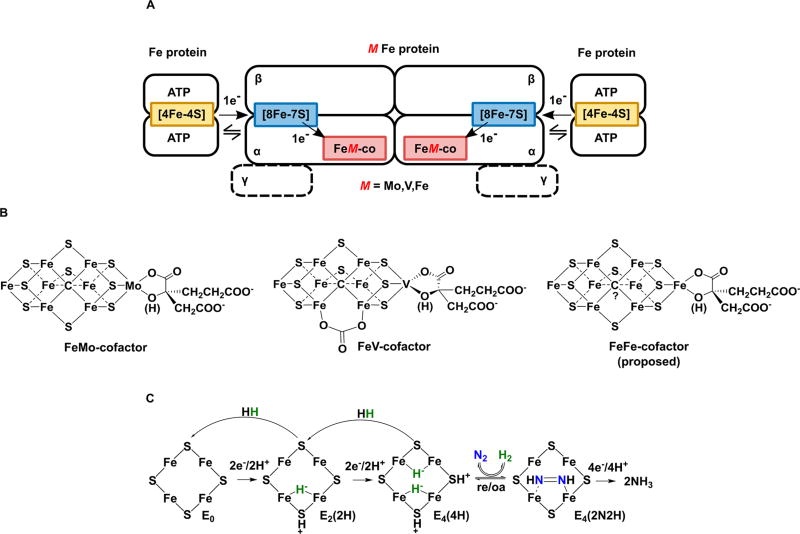
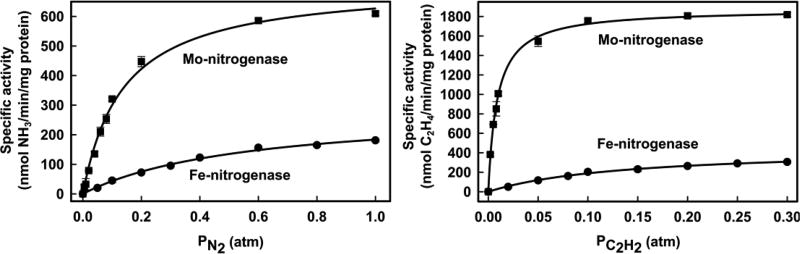
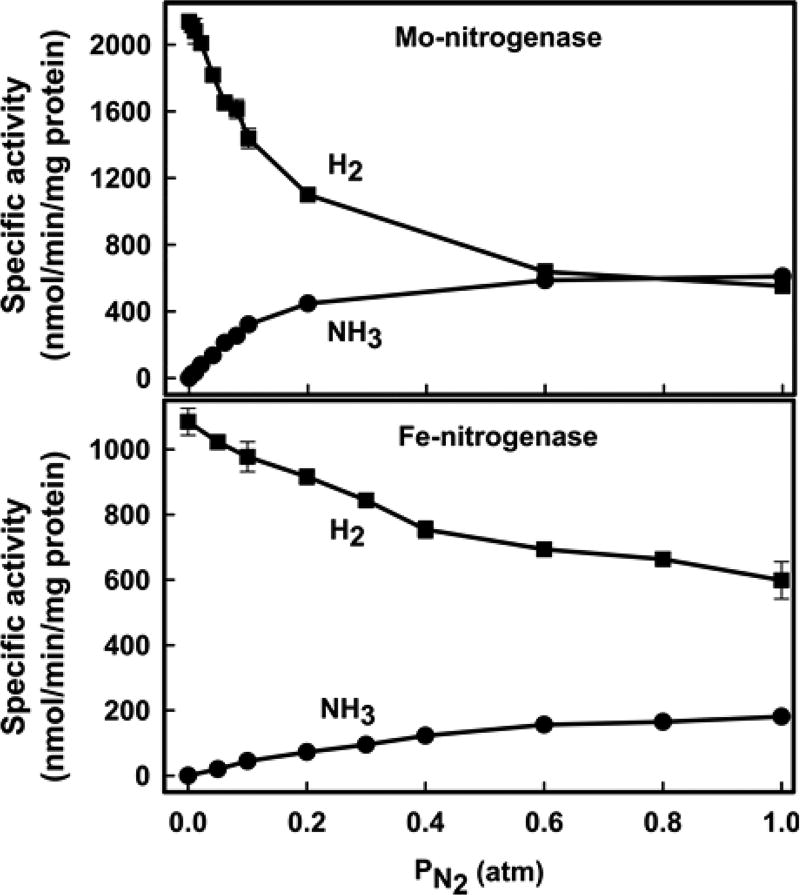
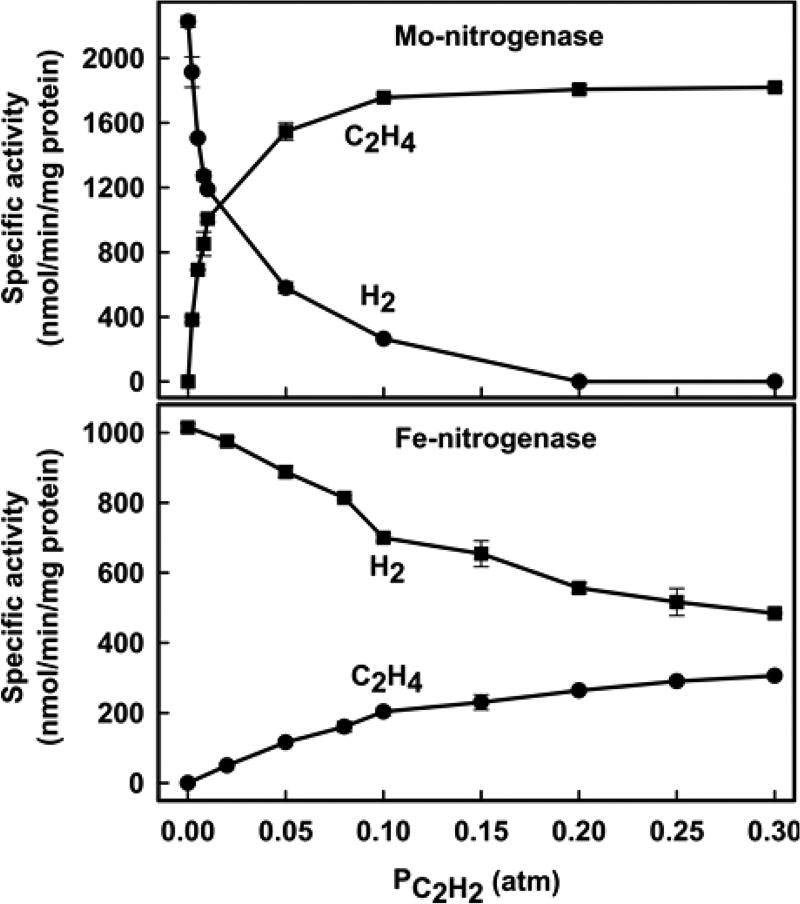
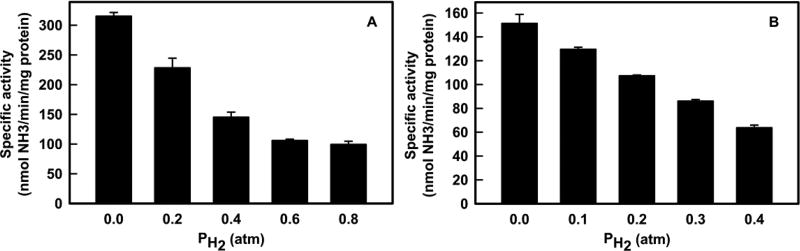
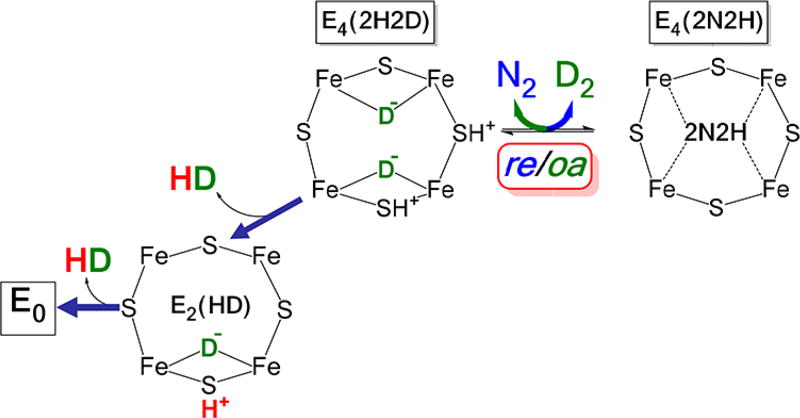
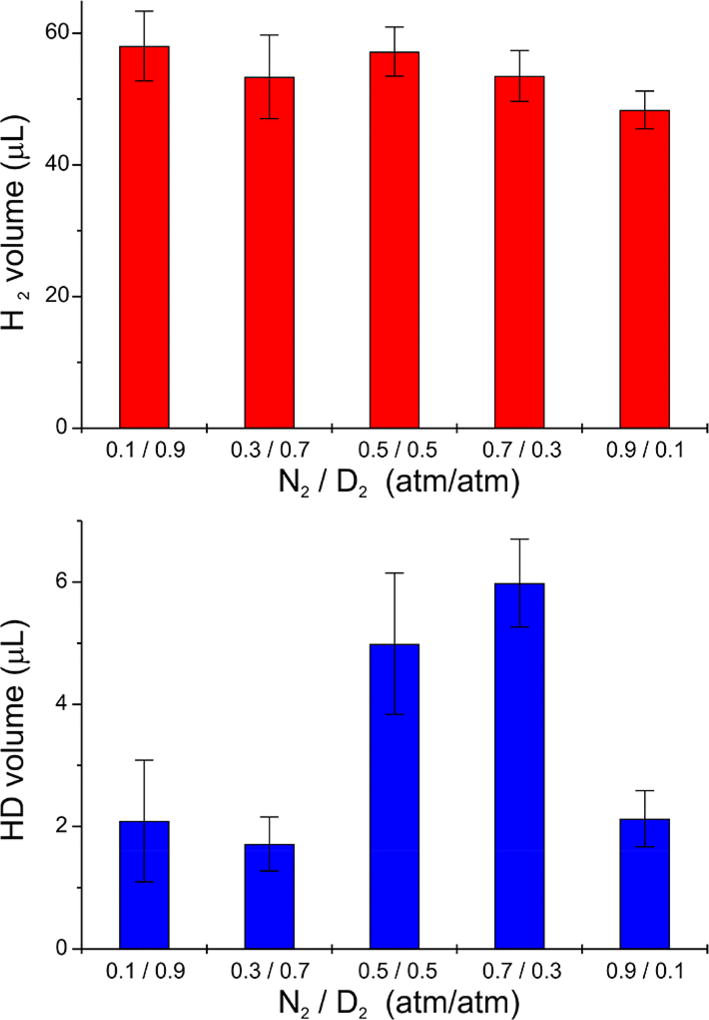
Of the three forms of nitrogenase (Mo-nitrogenase, V-nitrogenase, and Fe-nitrogenase), Fe-nitrogenase has the poorest ratio of N2 reduction relative to H2 evolution. Recent work on the Mo-nitrogenase has revealed that reductive elimination of two bridging Fe-H-Fe hydrides on the active site FeMo-cofactor to yield H2 is a key feature in the N2 reduction mechanism. The N2 reduction mechanism for the Fe-nitrogenase active site FeFe-cofactor was unknown. Here, we have purified both component proteins of the Fe-nitrogenase system, the electron-delivery Fe protein (AnfH) plus the catalytic FeFe protein (AnfDGK), and established its mechanism of N2 reduction. Inductively coupled plasma optical emission spectroscopy and mass spectrometry show that the FeFe protein component does not contain significant amounts of Mo or V, thus ruling out a requirement of these metals for N2 reduction. The fully functioning Fe-nitrogenase system was found to have specific activities for N2 reduction (1 atm) of 181 ± 5 nmol NH3 min-1 mg-1 FeFe protein, for proton reduction (in the absence of N2) of 1085 ± 41 nmol H2 min-1 mg-1 FeFe protein, and for acetylene reduction (0.3 atm) of 306 ± 3 nmol C2H4 min-1 mg-1 FeFe protein. Under turnover conditions, N2 reduction is inhibited by H2 and the enzyme catalyzes the formation of HD when presented with N2 and D2. These observations are explained by the accumulation of four reducing equivalents as two metal-bound hydrides and two protons at the FeFe-cofactor, with activation for N2 reduction occurring by reductive elimination of H2.


Conflict of interest statement

The authors declare no competing financial interest.

Figures

Figure 1
Figure 1
General nitrogenase architecture, nitrogenase cofactors, and N2 activation mechanism. (A) Schematic of nitrogenases showing the electron delivery component (Fe protein), catalytic component (MoFe, VFe, or FeFe protein), metal clusters, and electron delivery pathway. The differing metal atom (M in red) is Mo, V, or Fe. MoFe protein is an α2β2 heterotetramer, while VFe and FeFe proteins are α2β2γ2 heterohexamers. (B) Structural models of nitrogenase cofactors with homocitrate on the right based on crystal structures for MoFe and VFe proteins. The carbonate in the FeV-cofactor has not been unambiguously assigned. No structure for the FeFe-cofactor is available, so a model is proposed based on available data. (C) Simplified form of the N2 activation mechanism, with cartoons of the Fe 2, 3, 6, 7 face of FeMo-cofactor in the E0, E2, and E4 states (designation from the Lowe–Thorneley kinetic model) showing hydrides and protons and showing both the re/oa equilibrium with loss of H2 and binding/reduction of N2 (going right) and the two steps of H2 generation by hydride protonation that occur in the absence of N2 (going left). The exact location of the bound hydrides and protons is proposed.
Figure 2
Figure 2
Specific activities for substrate reduction by Mo- and Fe-nitrogenases. Shown are the N2 partial pressure dependence of NH3 formation (left) and C2H2 on C2H4 formation (right) in Fe-nitrogenase (●) and Mo-nitrogenase (■). N2 and C2H2 apparent Km and Vmax values were determined by a fit of the data to the Michaelis–Menten equation (lines). Mo-nitrogenase: apparent Km N2 = 0.13 ± 0.03 atm, Vmax = 713 ± 19 nmol NH3 min−1 mg−1 MoFe protein, and apparent Km C2H2 = 0.009 ± 0.0005 atm, Vmax = 1876 ± 20 nmol C2H4 min−1 mg−1 MoFe protein. Fe-nitrogenase: apparent Km N2 = 0.56 ± 0.06 atm, Vmax = 286 ± 15 nmol NH3 min−1 mg−1 FeFe protein, and apparent Km C2H2 = 0.14 ± 0.01 atm, Vmax = 450 ± 18 nmol C2H4 min−1 mg−1 FeFe protein. Data are the average of two independent experiments with error bars. Assays were performed as described in Materials and Methods.
Figure 3
Figure 3
Effect of increasing partial pressure of N2 (PN2) on N2 (●) and H+ (■) reduction in Mo-nitrogenase (top) and Fe-nitrogenase (bottom). Data points are connected with a solid line as a guide. Data are the average of two independent experiments with error bars. Assays were performed as described in Materials and Methods.
Figure 4
Figure 4
Effect of increasing partial pressure of acetylene (PC2H2) on acetylene (●) and H+ (■) reduction in Mo-nitrogenase (top) and Fe-nitrogenase (bottom). Data points are connected with a solid line as a guide. Data are the average of two independent experiments with error bars. Assays were performed as described in Materials and Methods.
Figure 5
Figure 5
H2 inhibition of N2 reduction. Shown is the specific activity for N2 reduction as a function of the partial pressure of H2 for Mo-nitrogenase (A) and Fe-nitrogenase (B). Data are the average of two independent experiments with error bars. Assays were performed as described in Materials in Methods. For Mo-nitrogenase, N2 was held at 0.2 atm and H2 was varied. For Fe-nitrogenase, N2 was held at 0.6 atm and H2 was varied.
Figure 6
Figure 6
HD formation by nitrogenase. Shown is one FeS face of FeMo-cofactor with a reversible re/oa equilibrium for N2 or D2 binding. The pathway to the left leads to the formation of 2 equiv of HD. The deutrides (green) are not solvent exchangeable, whereas the protons (red) are solvent exchangeable.
Figure 7
Figure 7
HD formation by Fe-nitrogenase. Volumes of produced H2 (upper) and HD (lower) (1 atm, 295 K) in the headspace of turnover sample vials as a function of the ratio of N2 and D2 partial pressures (see Materials and Methods); error bars represent standard deviations.

Similar articles

Cited by

References

    1. Raymond J, Siefert JL, Staples CR, Blankenship RE. The natural history of nitrogen fixation. Mol. Biol. Evol. 2004;21:541–554. - PubMed
    1. Burris RH, Roberts GP. Biological nitrogen fixation. Annu. Rev. Nutr. 1993;13:317–35. - PubMed
    1. Gruber N, Galloway JN. An Earth-system perspective of the global nitrogen cycle. Nature. 2008;451:293–296. - PubMed
    1. Eady RR. Structure-function relationships of alternative nitrogenases. Chem. Rev. 1996;96:3013–3030. - PubMed
    1. Burgess BK, Lowe DJ. Mechanism of molybdenum nitrogenase. Chem. Rev. 1996;96:2983–3012. - PubMed

Publication types