. 2017 Dec 28;9(12):2666-2694.
doi: 10.18632/aging.101355.

Exosomal microRNAs derived from colorectal cancer-associated fibroblasts: role in driving cancer progression

Affiliations

Exosomal microRNAs derived from colorectal cancer-associated fibroblasts: role in driving cancer progression

Rahul Bhome et al. Aging (Albany NY). .

Abstract

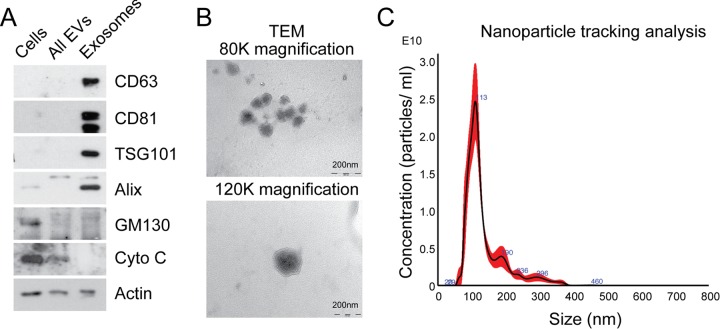
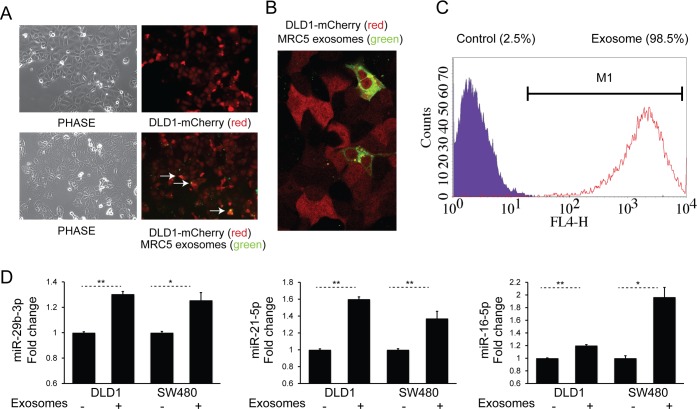
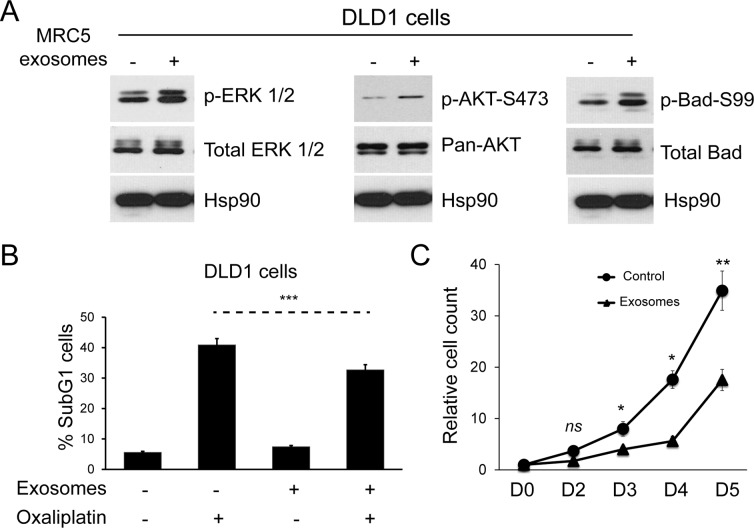
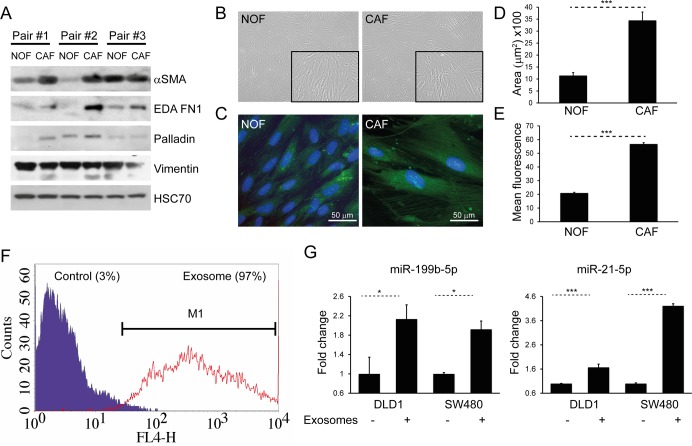
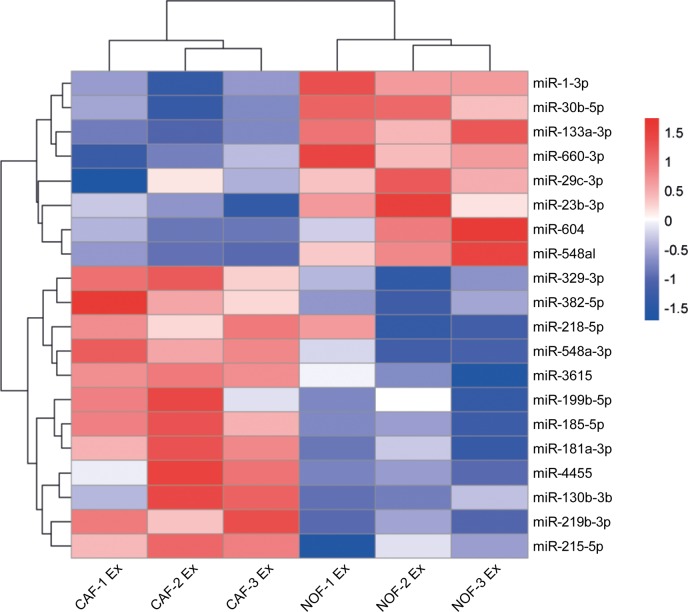
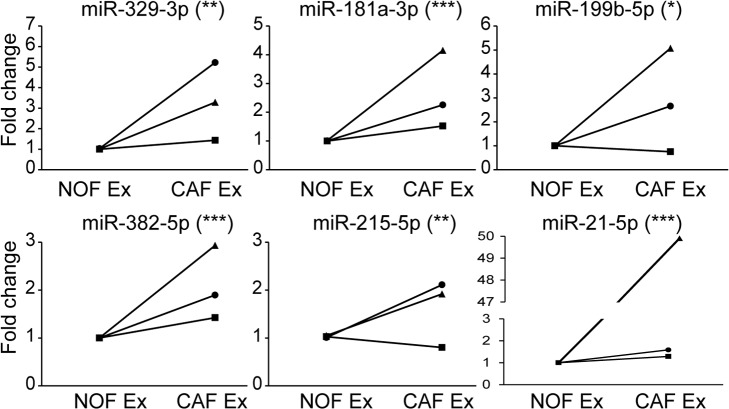
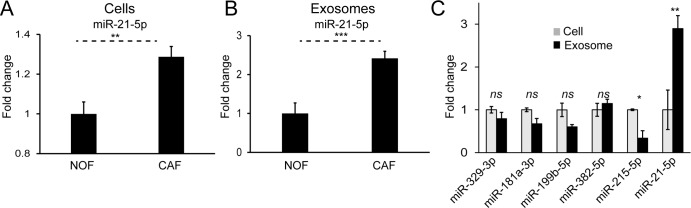
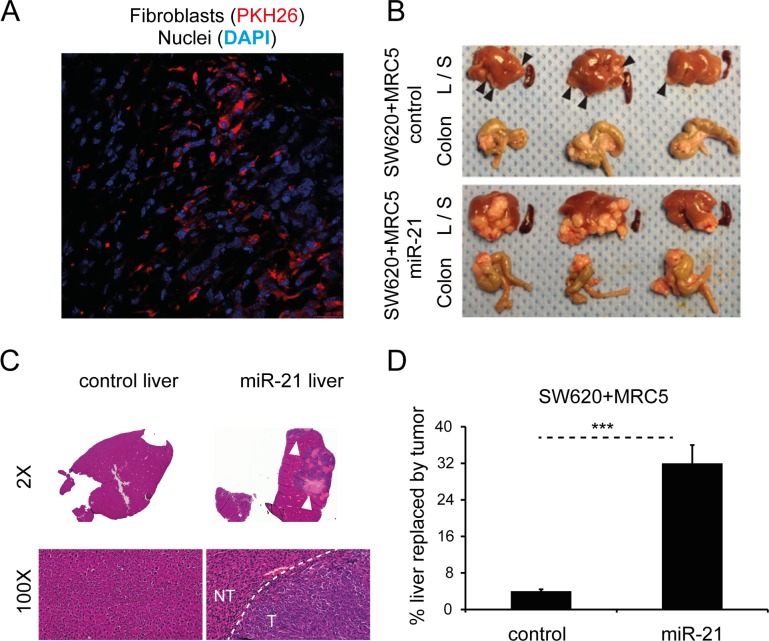
Colorectal cancer is a global disease with increasing incidence. Mortality is largely attributed to metastatic spread and therefore, a mechanistic dissection of the signals which influence tumor progression is needed. Cancer stroma plays a critical role in tumor proliferation, invasion and chemoresistance. Here, we sought to identify and characterize exosomal microRNAs as mediators of stromal-tumor signaling. In vitro, we demonstrated that fibroblast exosomes are transferred to colorectal cancer cells, with a resultant increase in cellular microRNA levels, impacting proliferation and chemoresistance. To probe this further, exosomal microRNAs were profiled from paired patient-derived normal and cancer-associated fibroblasts, from an ongoing prospective biomarker study. An exosomal cancer-associated fibroblast signature consisting of microRNAs 329, 181a, 199b, 382, 215 and 21 was identified. Of these, miR-21 had highest abundance and was enriched in exosomes. Orthotopic xenografts established with miR-21-overexpressing fibroblasts and CRC cells led to increased liver metastases compared to those established with control fibroblasts. Our data provide a novel stromal exosome signature in colorectal cancer, which has potential for biomarker validation. Furthermore, we confirmed the importance of stromal miR-21 in colorectal cancer progression using an orthotopic model, and propose that exosomes are a vehicle for miR-21 transfer between stromal fibroblasts and cancer cells.

Keywords: cancer-associated fibroblasts; colorectal cancer; exosomes; microRNA; stroma.


Conflict of interest statement

CONFLICTS OF INTEREST

The authors report no conflicts of interest.

Figures

Figure 1
Figure 1. Characterization of exosomes isolated by differential ultracentrifugation
(A) Western blot analysis to assess expression of exosomal markers in MRC5 exosomes. “Cells” refers to total cellular protein, “all EVs” refers to the total vesicular fraction isolated by a single ultracentrifugation of conditioned medium at 100 000 g, and “exosomes” refers to small extracellular vesicles isolated by filtration and serial centrifugation. The exosomal fraction is enriched in tetraspanins (CD63 and CD81), endosomal markers (Alix and TSG101) and does not contain Golgi (GM130) or mitochondrial (cytochrome C) markers. Actin was used as an equal loading control. (B) TEM of MRC5 fibroblast exosomes at 80 000x and 120 000x demonstrating homogenous, cup-shaped vesicles with size in the order of 100 nm. Scale bar represents 200 nm in both panels. (C) Nanoparticle tracking analysis of MRC5 fibroblast exosomes represented as size vs. concentration.
Figure 2
Figure 2. Fibroblast exosomes are taken up by CRC cells resulting in increased miRNA levels
(A) Culture of mCherry-tagged DLD1 cells (red) in the absence (top) or presence (bottom) of DiO-labelled MRC5 exosomes (green), visualized by fluorescence microscopy (10x). Co-localization of exosomes with cells is demonstrated by arrows. (B) Culture of mCherry-DLD1 cells with DiO-labelled MRC5 exosomes visualized by confocal microscopy (60x), demonstrating the presence of exosomes within cells. (C) Flow cytometry of DLD1 cells (control) and DLD1 cells co-cultured with MRC5 exosomes (exosome). The proportion of cells under the M1 region is given as a percentage. (D) Co-culture of MRC5 exosomes with DLD1 and SW480 cells with resultant increase in miR-29b-3p, miR-21-5p and miR-16-5p. Data is presented as mean +/− SEM. Paired t-test: * p<0.05, ** p<0.01, *** p<0.001.
Figure 3
Figure 3. Fibroblast exosomes influence cellular signaling in CRC cells resulting in resistance to chemotherapy and altered proliferation
(A) Western blot demonstrating ERK (left), AKT (middle) and Bad activity (right) in DLD1 cells in the absence and presence of MRC5 exosomes. MRC5 exosomes induced ERK, AKT and Bad (serine 99) phosphorylation but total ERK, AKT and Bad expression was unchanged. HSP90 was used as an equal loading control. (B) Apoptosis of DLD1 cells induced by oxaliplatin in the absence and presence of MRC5 fibroblast exosomes. Fisher's exact test: *** p<0.001. (C) Proliferation of DLD1 CRC cells in the absence and presence of MRC5 fibroblast exosomes. A significant proliferation defect occurs from day 3 onwards in exosome-exposed CRC cells. Cell counts are relative to day 0, which was given the value 1. Data is presented as mean +/− SEM. Paired t-test: ns – not significant, * p<0.05, ** p<0.01, *** p<0.001.
Figure 4
Figure 4. CAFs and NOFs are biochemically and morphologically different and CAF exosomes can also be transferred to CRC cells
(A) Western blot of paired primary NOFs and CAFs for myofibroblastic markers alpha-smooth muscle actin (α-SMA), fibronectin ED-A (ED-A FN1), palladin and vimentin. HSC-70 was used as an equal loading control. (B) Light microscopy of representative primary NOF and CAF cells (10x). (C) Fluorescence microscopy demonstrating phalloidin staining of F-actin filaments (green), counterstained with DAPI (blue; 40x). (D) Mean surface area and (E) intensity of phalloidin staining in a representative NOF-CAF pair. (F) Flow cytometry of DLD1 cells (control) and DLD1 cells co-cultured with CAF exosomes (exosome). The proportion of cells under the M1 region is given as a percentage. (G) Co-culture of CAF exosomes with DLD1 and SW480 cells with resultant increase in miR-199b and miR-21-5p. Data is presented as mean +/− SEM. Student's t-test (D, E) or paired t-test (F, G): * p<0.05, ** p<0.01, *** p<0.001.
Figure 5
Figure 5. Differential expression of miRNAs in NOF and CAF exosomes
Hierarchical cluster analysis of miRNAs in NOF and CAF exosomes. The top 20 most changing miRNAs are shown. Blue-red color scale corresponds with fold changes between −1.5 and +1.5. NOF Ex, normal fibroblast exosome; CAF Ex, cancer-associated fibroblast exosome.
Figure 6
Figure 6. qPCR validation confirms signature of 6 miRNAs more abundant in CAF than NOF exosomes
Taqman qPCR results presented as relative fold changes between NOF and CAF exosomal miRNA for each NOF-CAF exosome pair. NOF exosome miRNA level was assigned the value 1 for each NOF-CAF exosome pair (n=3), each of which were analyzed in triplicate. Data is presented as mean +/− SEM. Student's t-test: * p<0.05, ** p<0.01, *** p<0.001.
Figure 7
Figure 7. MiR-21 is more abundant in CAF cells and exosomes and enriched in the exosomal compartment
(A) On a whole-cell level, CAFs express significantly more miR-21 than NOFs. (B) CAF exosomes contain significantly more miR-21 than NOF exosomes. Results obtained by Taqman qPCR and presented as mean relative fold changes for each NOF-CAF pair (n=3), analyzed in triplicate. (C) NanoString counts normalized by global mean expression for CAF cells and exosomes. Exosomal counts are expressed relative to cellular counts which were assigned the value 1. Data is presented as mean +/− SEM. Student's t-test: ns – not significant, * p<0.05, ** p<0.01, *** p<0.001.
Figure 8
Figure 8. Stromal miR-21 leads to tumor progression in an in vivo orthotopic CRC model
(A) Confocal microscopy of tumor section generated by subcutaneous co-injection of PKH26-labeled MRC5 fibroblasts (red) and CRC cells, counterstained with DAPI (blue; 60x). (B) Liver (L), spleen (S) and colon from mice orthotopically injected with SW620 CRC cells and MRC5 control or miR-21-overexpressing fibroblasts. Arrowheads highlight liver metastases. The effect of miR-21-overexpressing cells was to increase the size and number of liver metastases. No splenic metastases were seen in either group. (C) Representative liver sections at 2x and 100x magnification. Bulky hepatic metastases are evident in the SW620/MRC5-miR-21 liver (arrowheads; 2x) with a clear histological demarcation between normal liver and metastatic tumor (NT – normal tissue, T – tumor; 100x). (D) Percentage liver replacement by metastatic tumor in SW620/MRC5-control (control) and SW620/MRC5-miR-21 (miR-21) mice. Data is presented as mean +/− SEM. Student's t-test: *** p<0.001.

References

    1. Arnold M, Sierra MS, Laversanne M, Soerjomataram I, Jemal A, Bray F. Global patterns and trends in colorectal cancer incidence and mortality. Gut. 2017;66:683–91. https://doi.org/10.1136/gutjnl-2015-310912 - DOI - PubMed
    1. Luengo-Fernandez R, Leal J, Gray A, Sullivan R. Economic burden of cancer across the European Union: a population-based cost analysis. Lancet Oncol. 2013;14:1165–74. https://doi.org/10.1016/S1470-2045(13)70442-X - DOI - PubMed
    1. Simmonds PC, Colorectal Cancer Collaborative Group Palliative chemotherapy for advanced colorectal cancer: systematic review and meta-analysis. BMJ. 2000;321:531–35. https://doi.org/10.1136/bmj.321.7260.531 - DOI - PMC - PubMed
    1. Hanahan D, Weinberg RA. Hallmarks of cancer: the next generation. Cell. 2011;144:646–74. https://doi.org/10.1016/j.cell.2011.02.013 - DOI - PubMed
    1. Bhome R, Bullock MD, Al Saihati HA, Goh RW, Primrose JN, Sayan AE, Mirnezami AH. A top-down view of the tumor microenvironment: structure, cells and signaling. Front Cell Dev Biol. 2015;3:33. https://doi.org/10.3389/fcell.2015.00033 - DOI - PMC - PubMed

Publication types