

Genome-wide association study and genetic diversity analysis on nitrogen use efficiency in a Central European winter wheat (Triticum aestivum L.) collection
- PMID: 29283996
- PMCID: PMC5746223
- DOI: 10.1371/journal.pone.0189265
Genome-wide association study and genetic diversity analysis on nitrogen use efficiency in a Central European winter wheat (Triticum aestivum L.) collection
Abstract
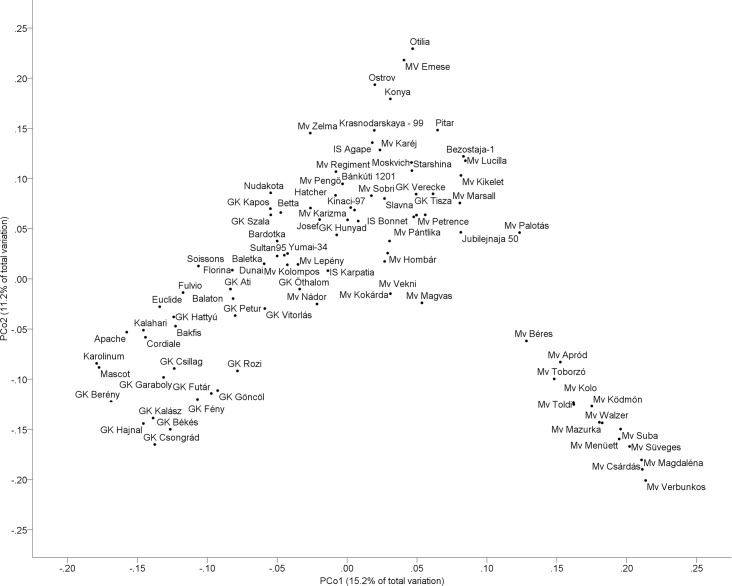
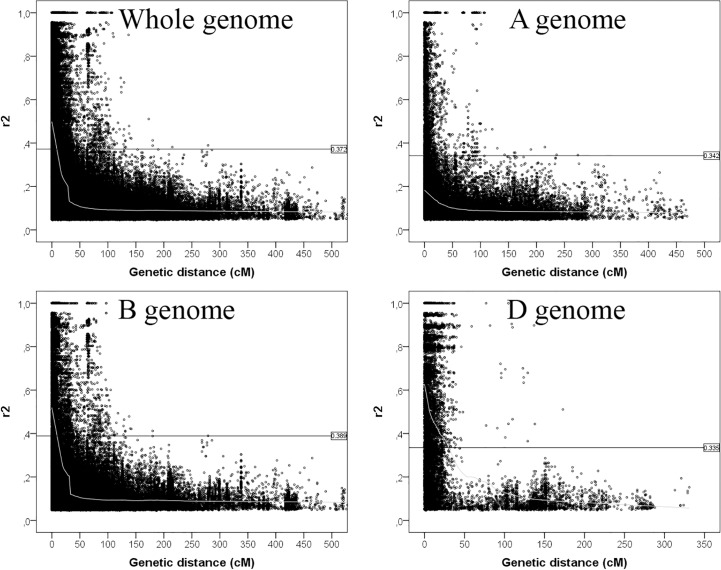
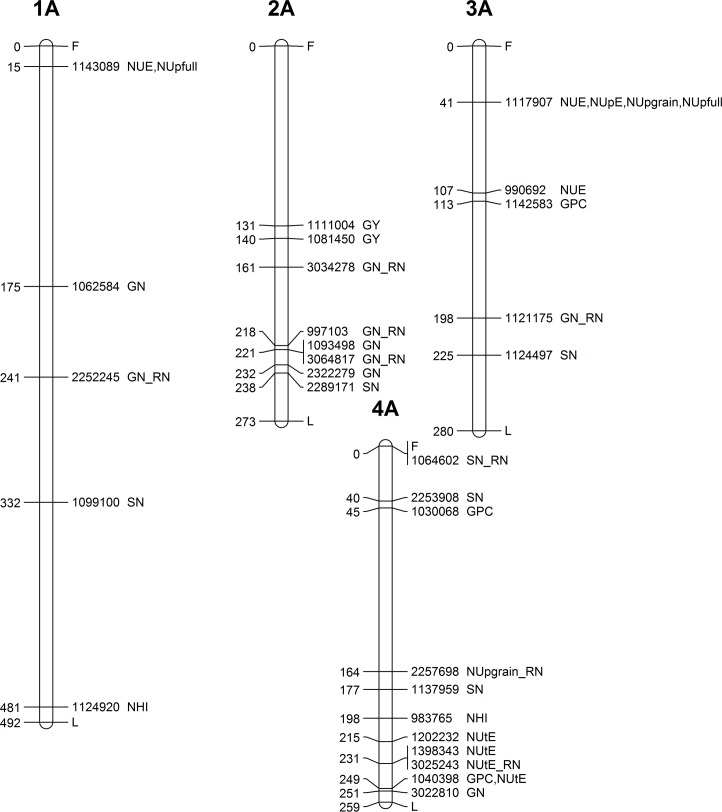
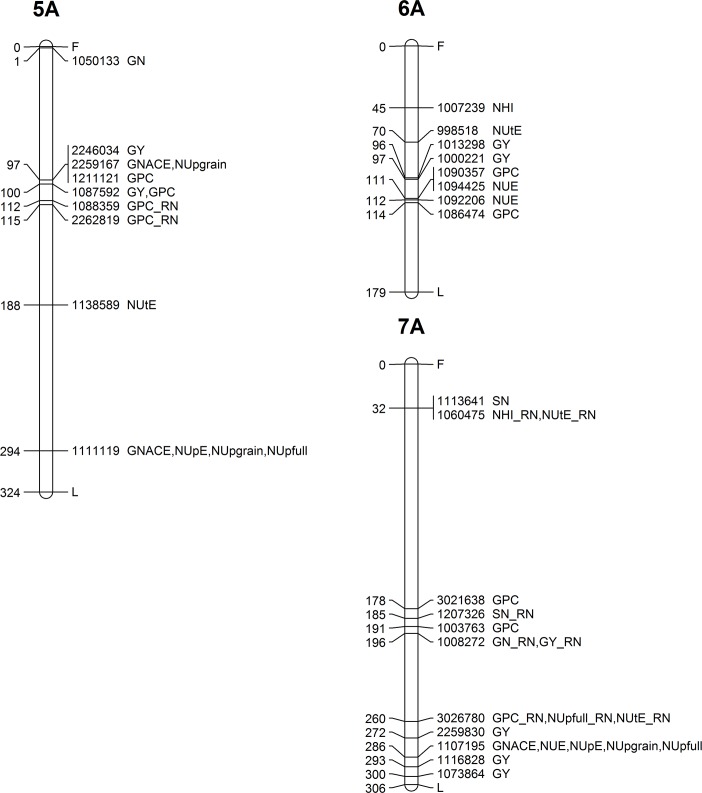
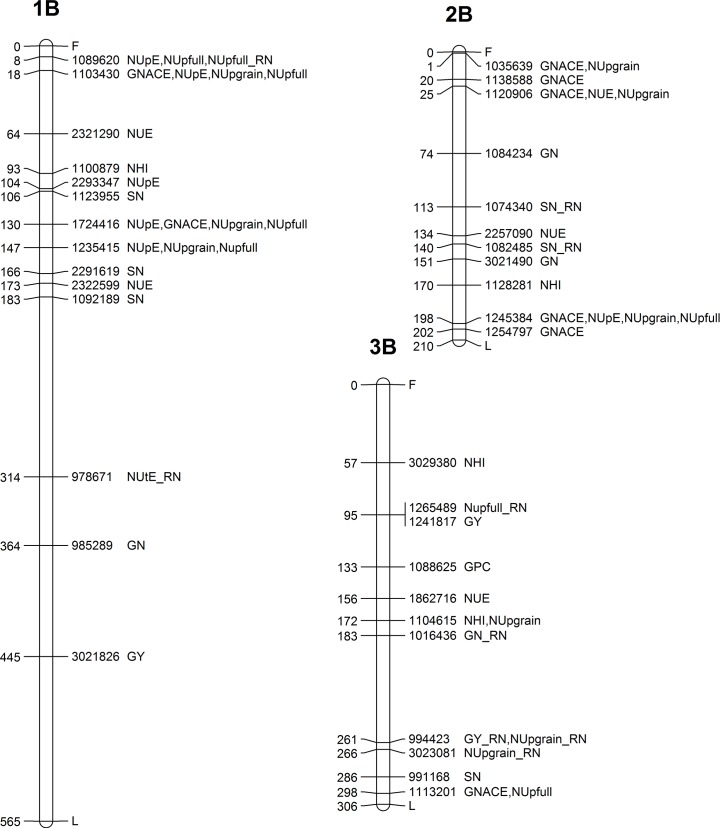
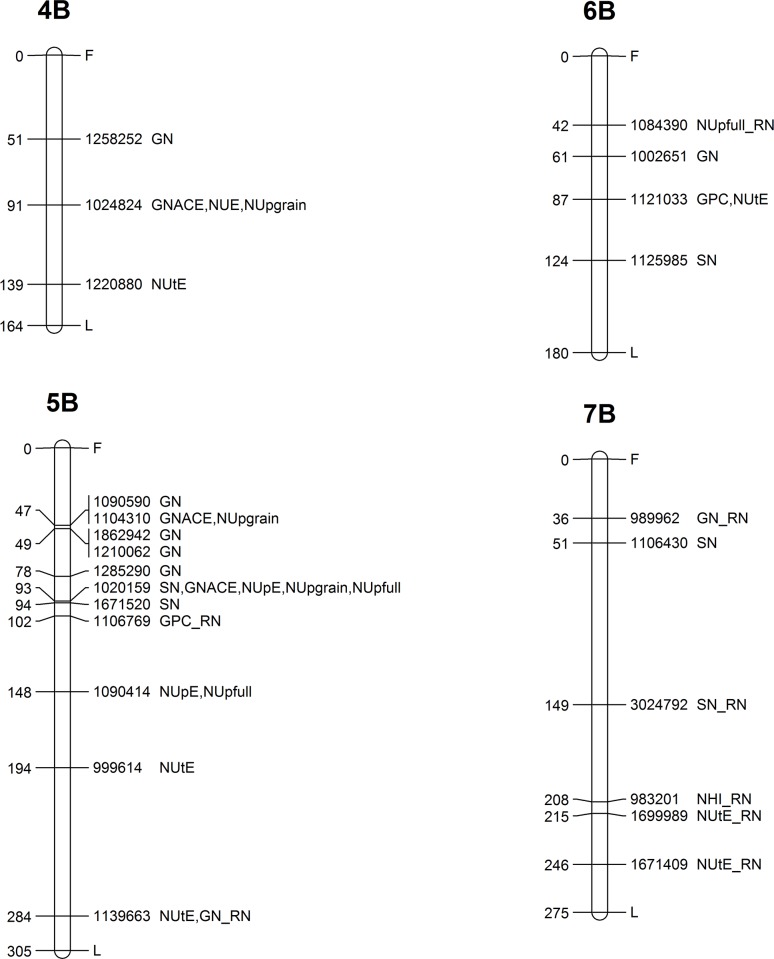
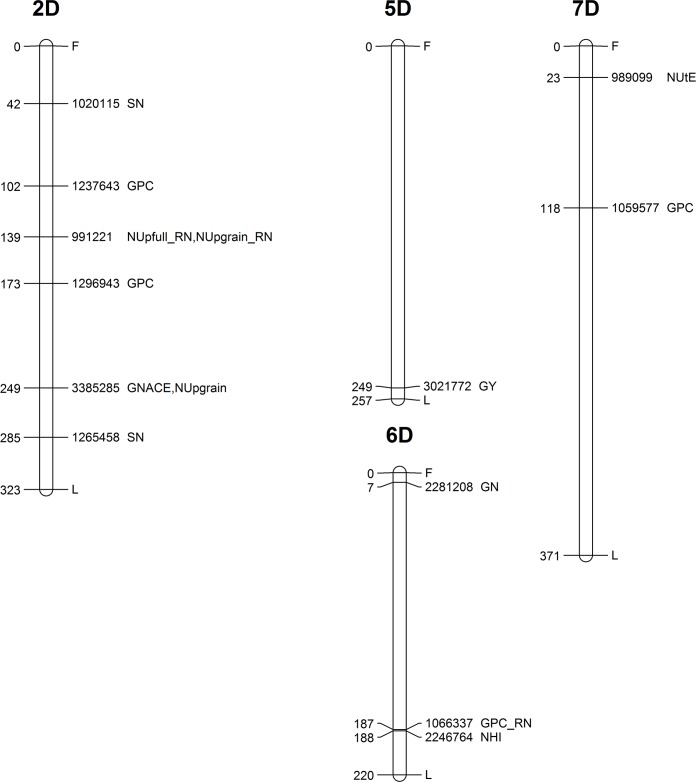
To satisfy future demands, the increase of wheat (Triticum aestivum L.) yield is inevitable. Simultaneously, maintaining high crop productivity and efficient use of nutrients, especially nitrogen use efficiency (NUE), are essential for sustainable agriculture. NUE and its components are inherently complex and highly influenced by environmental factors, nitrogen management practices and genotypic variation. Therefore, a better understanding of their genetic basis and regulation is fundamental. To investigate NUE-related traits and their genetic and environmental regulation, field trials were evaluated in a Central European wheat collection of 93 cultivars at two nitrogen input levels across three seasons. This elite germplasm collection was genotyped on DArTseq® genotypic platform to identify loci affecting N-related complex agronomic traits. To conduct robust genome-wide association mapping, the genetic diversity, population structure and linkage disequilibrium were examined. Population structure was investigated by various methods and two subpopulations were identified. Their separation is based on the breeding history of the cultivars, while analysis of linkage disequilibrium suggested that selective pressures had acted on genomic regions bearing loci with remarkable agronomic importance. Besides NUE, genetic basis for variation in agronomic traits indirectly affecting NUE and its components, moreover genetic loci underlying response to nitrogen fertilisation were also determined. Altogether, 183 marker-trait associations (MTA) were identified spreading over almost the entire genome. We found that most of the MTAs were environmental-dependent. The present study identified several associated markers in those genomic regions where previous reports had found genes or quantitative trait loci influencing the same traits, while most of the MTAs revealed new genomic regions. Our data provides an overview of the allele composition of bread wheat varieties anchored to DArTseq® markers, which will facilitate the understanding of the genetic basis of NUE and agronomically important traits.
Conflict of interest statement
Figures
Similar articles
-
A genome-wide identification of chromosomal regions determining nitrogen use efficiency components in wheat (Triticum aestivum L.).Theor Appl Genet. 2014 Dec;127(12):2679-93. doi: 10.1007/s00122-014-2407-7. Epub 2014 Oct 19. Theor Appl Genet. 2014. PMID: 25326179
-
Genome-wide association study of agronomic traits related to nitrogen use efficiency in wheat.Theor Appl Genet. 2022 Dec;135(12):4289-4302. doi: 10.1007/s00122-022-04218-5. Epub 2022 Sep 22. Theor Appl Genet. 2022. PMID: 36136127
-
Identification of genetic loci associated with major agronomic traits of wheat (Triticum aestivum L.) based on genome-wide association analysis.BMC Plant Biol. 2021 Sep 13;21(1):418. doi: 10.1186/s12870-021-03180-6. BMC Plant Biol. 2021. PMID: 34517837 Free PMC article.
-
Genetic regulation of the traits contributing to wheat nitrogen use efficiency.Plant Sci. 2021 Feb;303:110759. doi: 10.1016/j.plantsci.2020.110759. Epub 2020 Nov 15. Plant Sci. 2021. PMID: 33487345 Review.
-
Genetic variation in traits for nitrogen use efficiency in wheat.J Exp Bot. 2017 May 1;68(10):2627-2632. doi: 10.1093/jxb/erx079. J Exp Bot. 2017. PMID: 28338945 Review.
Cited by
-
Influence of new sulfur-containing fertilizers on performance of wheat yield.Saudi J Biol Sci. 2021 Aug;28(8):4644-4655. doi: 10.1016/j.sjbs.2021.04.073. Epub 2021 Apr 30. Saudi J Biol Sci. 2021. PMID: 34354451 Free PMC article.
-
Using chlorate as an analogue to nitrate to identify candidate genes for nitrogen use efficiency in barley.Mol Breed. 2021 Aug 2;41(7):47. doi: 10.1007/s11032-021-01239-8. eCollection 2021 Jul. Mol Breed. 2021. PMID: 37309383 Free PMC article.
-
Genome-wide association study of agronomic traits related to nitrogen use efficiency in Henan wheat.BMC Genomics. 2024 Jan 2;25(1):7. doi: 10.1186/s12864-023-09922-0. BMC Genomics. 2024. PMID: 38166525 Free PMC article.
-
Whole Genome Diversity, Population Structure, and Linkage Disequilibrium Analysis of Chickpea (Cicer arietinum L.) Genotypes Using Genome-Wide DArTseq-Based SNP Markers.Genes (Basel). 2019 Sep 4;10(9):676. doi: 10.3390/genes10090676. Genes (Basel). 2019. PMID: 31487948 Free PMC article.
-
Genetic Diversity and Genome-Wide Association Study for the Phenology Response of Winter Wheats of North America, Western Asia, and Europe.Plants (Basel). 2023 Dec 1;12(23):4053. doi: 10.3390/plants12234053. Plants (Basel). 2023. PMID: 38068688 Free PMC article.
References
-
- FAO. FAOSTAT statistics database. Rome; 2016. Available from: http://www.fao.org/worldfoodsituation/csdb/en/
-
- Alexandratos N, Bruinsma J. World agriculture towards 2030/2050: the 2012 revision. ESA Work Pap FAO. 2012;
-
- Tilman D, Fargione J, Wolff B, Antonio CD, Dobson A, Howarth R, et al. Forecasting agriculturally driven environmental change. Science. 2001; 292: 281–284. doi: 10.1126/science.1057544 - DOI - PubMed
-
- FAO. Current world fertilizer trends and outlooks to 2015. 2011; 41. Available from: http://www.fao.org/3/a-av252e.pdf
-
- Good AG, Shrawat AK, Muench DG. Can less yield more? Is reducing nutrient input into the environment compatible with maintaining crop production? Trends Plant Sci. 2004; 9: 597–605. doi: 10.1016/j.tplants.2004.10.008 - DOI - PubMed
Publication types
MeSH terms
Substances
LinkOut - more resources
Full Text Sources
Other Literature Sources
