

Identifying cholera "hotspots" in Uganda: An analysis of cholera surveillance data from 2011 to 2016
- PMID: 29284003
- PMCID: PMC5746206
- DOI: 10.1371/journal.pntd.0006118
Identifying cholera "hotspots" in Uganda: An analysis of cholera surveillance data from 2011 to 2016
Abstract
Background: Despite advance in science and technology for prevention, detection and treatment of cholera, this infectious disease remains a major public health problem in many countries in sub-Saharan Africa, Uganda inclusive. The aim of this study was to identify cholera hotspots in Uganda to guide the development of a roadmap for prevention, control and elimination of cholera in the country.
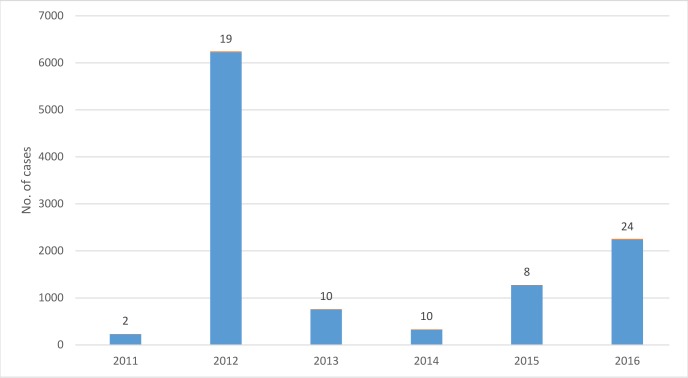
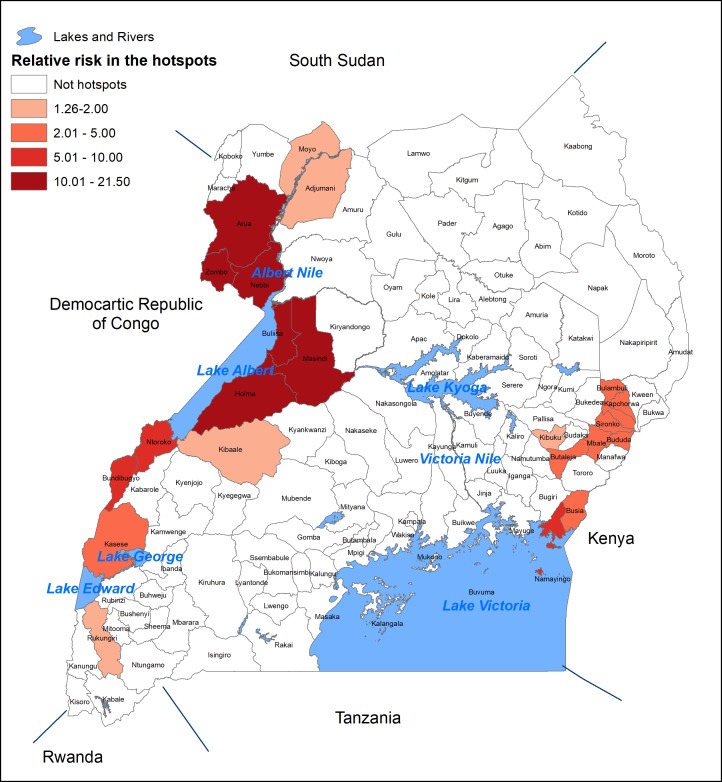
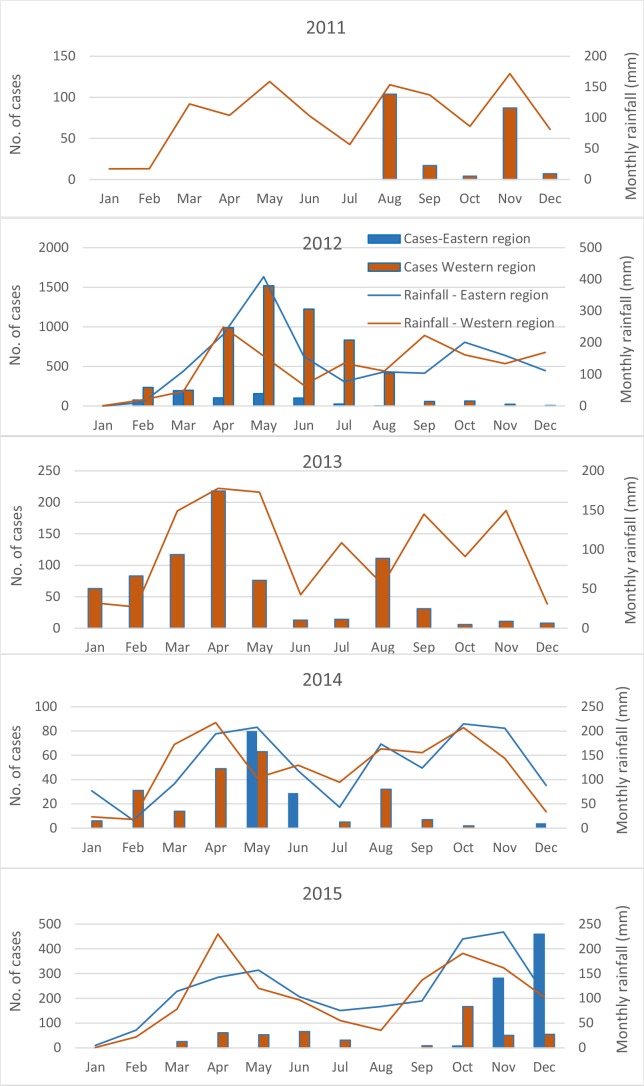
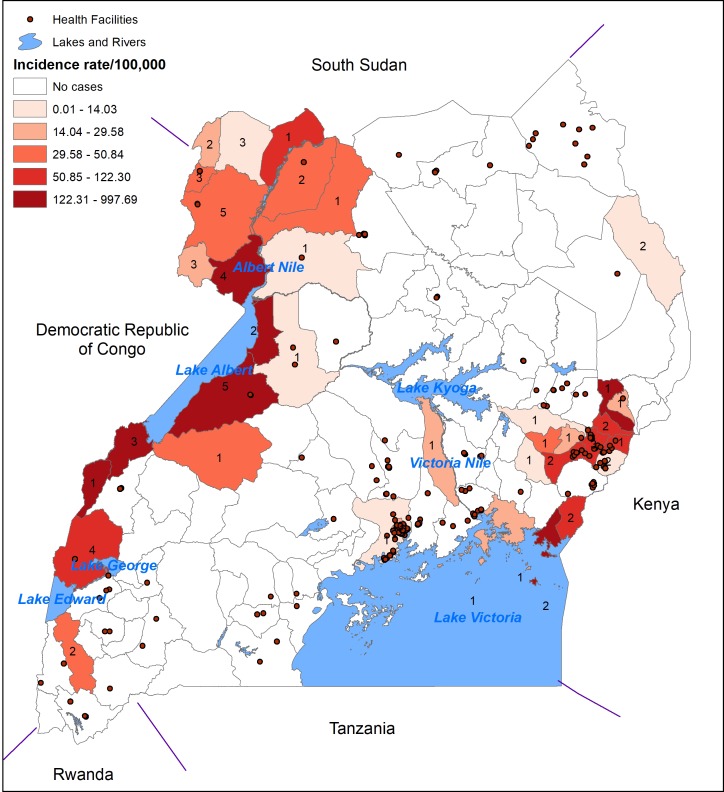
Methodology/principle findings: We obtained district level confirmed cholera outbreak data from 2011 to 2016 from the Ministry of Health, Uganda. Population and rainfall data were obtained from the Uganda Bureau of Statistics, and water, sanitation and hygiene data from the Ministry of Water and Environment. A spatial scan test was performed to identify the significantly high risk clusters. Cholera hotspots were defined as districts whose center fell within a significantly high risk cluster or where a significantly high risk cluster was completely superimposed onto a district. A zero-inflated negative binomial regression model was employed to identify the district level risk factors for cholera. In total 11,030 cases of cholera were reported during the 6-year period. 37(33%) of 112 districts reported cholera outbreaks in one of the six years, and 20 (18%) districts experienced cholera at least twice in those years. We identified 22 districts as high risk for cholera, of which 13 were near a border of Democratic Republic of Congo (DRC), while 9 districts were near a border of Kenya. The relative risk of having cholera inside the high-risk districts (hotspots) were 2 to 22 times higher than elsewhere in the country. In total, 7 million people were within cholera hotspots. The negative binomial component of the ZINB model shows people living near a lake or the Nile river were at increased risk for cholera (incidence rate ratio, IRR = 0.98, 95% CI: 0.97 to 0.99, p < .01); people living near the border of DRC/Kenya or higher incidence rate in the neighboring districts were increased risk for cholera in a district (IRR = 0.99, 95% CI: 0.98 to 1.00, p = .02 and IRR = 1.02, 95% CI: 1.01 to 1.03, p < .01, respectively). The zero inflated component of the ZINB model yielded shorter distance to Kenya or DRC border, higher incidence rate in the neighboring districts, and higher annual rainfall in the district were associated with the risk of having cholera in the district.
Conclusions/significance: The study identified cholera hotspots during the period 2011-2016. The people located near the international borders, internationally shared lakes and river Nile were at higher risk for cholera outbreaks than elsewhere in the country. Targeting cholera interventions to these locations could prevent and ultimately eliminate cholera in Uganda.
Conflict of interest statement
The authors have declared that no competing interests exist.
Figures
References
-
- Mintz ED, Tauxe RV. Cholera in Africa: A Closer Look and a Time for Action. The Journal of Infectious Diseases 2013; 208(S1):S4–7 - PubMed
-
- WHO. Cholera, 2007.Weekly Epidemiologic Record 2008; 83:269–84.
-
- WHO. Cholera, 2008.Weekly Epidemiologic Record 2009; 84:309–24.
-
- WHO. Cholera, 2009. Weekly Epidemiologic Record 2010; 85:293–308.
-
- WHO. Cholera, 2010.Weekly Epidemiologic Record 2011; 86:325–40.
Publication types
MeSH terms
LinkOut - more resources
Full Text Sources
Other Literature Sources
Medical
