HIV-1 envelope sequence-based diversity measures for identifying recent infections
- PMID: 29284009
- PMCID: PMC5746209
- DOI: 10.1371/journal.pone.0189999
HIV-1 envelope sequence-based diversity measures for identifying recent infections
Abstract
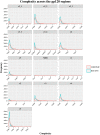
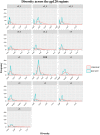
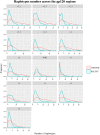
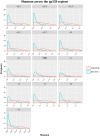
Identifying recent HIV-1 infections is crucial for monitoring HIV-1 incidence and optimizing public health prevention efforts. To identify recent HIV-1 infections, we evaluated and compared the performance of 4 sequence-based diversity measures including percent diversity, percent complexity, Shannon entropy and number of haplotypes targeting 13 genetic segments within the env gene of HIV-1. A total of 597 diagnostic samples obtained in 2013 and 2015 from recently and chronically HIV-1 infected individuals were selected. From the selected samples, 249 (134 from recent versus 115 from chronic infections) env coding regions, including V1-C5 of gp120 and the gp41 ectodomain of HIV-1, were successfully amplified and sequenced by next generation sequencing (NGS) using the Illumina MiSeq platform. The ability of the four sequence-based diversity measures to correctly identify recent HIV infections was evaluated using the frequency distribution curves, median and interquartile range and area under the curve (AUC) of the receiver operating characteristic (ROC). Comparing the median and interquartile range and evaluating the frequency distribution curves associated with the 4 sequence-based diversity measures, we observed that the percent diversity, number of haplotypes and Shannon entropy demonstrated significant potential to discriminate recent from chronic infections (p<0.0001). Using the AUC of ROC analysis, only the Shannon entropy measure within three HIV-1 env segments could accurately identify recent infections at a satisfactory level. The env segments were gp120 C2_1 (AUC = 0.806), gp120 C2_3 (AUC = 0.805) and gp120 V3 (AUC = 0.812). Our results clearly indicate that the Shannon entropy measure represents a useful tool for predicting HIV-1 infection recency.
Conflict of interest statement
Figures


Similar articles
-
A Generalized Entropy Measure of Within-Host Viral Diversity for Identifying Recent HIV-1 Infections.Medicine (Baltimore). 2015 Oct;94(42):e1865. doi: 10.1097/MD.0000000000001865. Medicine (Baltimore). 2015. PMID: 26496342 Free PMC article.
-
Deep Sequencing of the HIV-1 env Gene Reveals Discrete X4 Lineages and Linkage Disequilibrium between X4 and R5 Viruses in the V1/V2 and V3 Variable Regions.J Virol. 2016 Jul 27;90(16):7142-58. doi: 10.1128/JVI.00441-16. Print 2016 Aug 15. J Virol. 2016. PMID: 27226378 Free PMC article.
-
Using Primer-ID Deep Sequencing to Detect Recent Human Immunodeficiency Virus Type 1 Infection.J Infect Dis. 2018 Oct 20;218(11):1777-1782. doi: 10.1093/infdis/jiy426. J Infect Dis. 2018. PMID: 30010965 Free PMC article.
-
Envelope sequence variability and serologic characterization of HIV type 1 group O isolates from equatorial guinea.AIDS Res Hum Retroviruses. 1997 Aug 10;13(12):995-1005. doi: 10.1089/aid.1997.13.995. AIDS Res Hum Retroviruses. 1997. PMID: 9264286
-
Presence of multiple genetic subtypes of human immunodeficiency virus type 1 proviruses in Uganda.AIDS Res Hum Retroviruses. 1994 Nov;10(11):1543-50. doi: 10.1089/aid.1994.10.1543. AIDS Res Hum Retroviruses. 1994. PMID: 7888209
Cited by
-
Deep-sequencing of viral genomes from a large and diverse cohort of treatment-naive HIV-infected persons shows associations between intrahost genetic diversity and viral load.PLoS Comput Biol. 2023 Jan 3;19(1):e1010756. doi: 10.1371/journal.pcbi.1010756. eCollection 2023 Jan. PLoS Comput Biol. 2023. PMID: 36595537 Free PMC article.
-
Near Real-Time Identification of Recent Human Immunodeficiency Virus Transmissions, Transmitted Drug Resistance Mutations, and Transmission Networks by Multiplexed Primer ID-Next-Generation Sequencing in North Carolina.J Infect Dis. 2021 Mar 3;223(5):876-884. doi: 10.1093/infdis/jiaa417. J Infect Dis. 2021. PMID: 32663847 Free PMC article.
-
Human Immunodeficiency Virus (HIV) Genetic Diversity Informs Stage of HIV-1 Infection Among Patients Receiving Antiretroviral Therapy in Botswana.J Infect Dis. 2022 Apr 19;225(8):1330-1338. doi: 10.1093/infdis/jiab293. J Infect Dis. 2022. PMID: 34077517 Free PMC article.
-
Use of Next-Generation Sequencing in a State-Wide Strategy of HIV-1 Surveillance: Impact of the SARS-COV-2 Pandemic on HIV-1 Diagnosis and Transmission.J Infect Dis. 2023 Dec 20;228(12):1758-1765. doi: 10.1093/infdis/jiad211. J Infect Dis. 2023. PMID: 37283544 Free PMC article.
-
Validation of Variant Assembly Using HAPHPIPE with Next-Generation Sequence Data from Viruses.Viruses. 2020 Jul 14;12(7):758. doi: 10.3390/v12070758. Viruses. 2020. PMID: 32674515 Free PMC article.
References
-
- Public Health agency of Canada. HIV and AIDS in Canada, surveillance report to December 31, 2014. http://healthycanadians.gc.ca/publications/diseases-conditions-maladies-....
-
- Hollingsworth TD, Anderson RM, Fraser C. HIV-1 transmission, by stage of infection. Journal of Infectious Diseases. 2008;198(5):687–93. doi: 10.1086/590501 - DOI - PubMed
-
- van Sighem A, Nakagawa F, De Angelis D, Quinten C, Bezemer D, de Coul EO, et al. Estimating HIV Incidence, Time to Diagnosis, and the Undiagnosed HIV Epidemic Using Routine Surveillance Data. Epidemiology. 2015;26(5):653–60. doi: 10.1097/EDE.0000000000000324 - DOI - PMC - PubMed
-
- Mastro TD. Determining HIV Incidence in Populations: Moving in the Right Direction. Journal of Infectious Diseases. 2013;207(2):204–6. doi: 10.1093/infdis/jis661 - DOI - PubMed
Publication types
MeSH terms
LinkOut - more resources
Full Text Sources
Other Literature Sources
Medical
Molecular Biology Databases
Miscellaneous

