. 2017 Dec 28;10(1):63.
doi: 10.1186/s13041-017-0344-5.

Accelerated super-resolution imaging with FRET-PAINT

Affiliations

Accelerated super-resolution imaging with FRET-PAINT

Jongjin Lee et al. Mol Brain. .

Abstract

Super-resolution fluorescence microscopy in the current form is hard to be used to image the neural connectivity of thick tissue samples due to problems such as slow imaging speed, severe photobleaching of fluorescent probes, and high background noise. Recently developed DNA-PAINT solved the photobleaching problem, but its imaging speed is extremely low. We report accelerated super-resolution fluorescence microscopy named FRET-PAINT. Compared to conventional DNA-PAINT, the imaging speed of the microscopy increases up to ~30-fold. As demonstrations, we show that 25-50 second imaging time is long enough to provide super-resolution reconstruction of microtubules and mitochondria of COS-7 cells.

Keywords: DNA-PAINT; FRET; FRET-PAINT; SMLM; fluorescence resonance energy transfer; single-molecule localization microscopy; super-resolution microscopy.


Conflict of interest statement

Ethics approval and consent to participate

Not applicable.

Consent for publication

Not applicable.

Competing interests

The authors declare that they have no competing interests

Publisher’s Note

Springer Nature remains neutral with regard to jurisdictional claims in published maps and institutional affiliations.

Figures
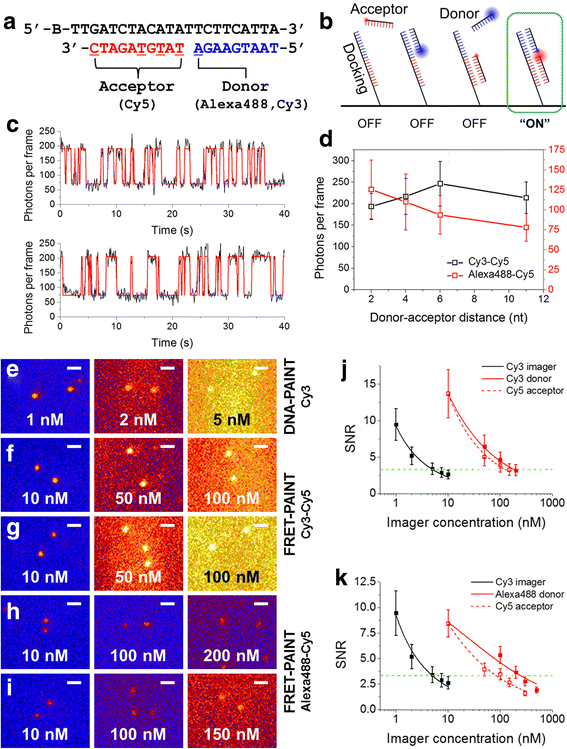
Fig. 1
Fig. 1
Principle and characterization of FRET-PAINT. a Docking (black), donor (blue), and acceptor (red) strands used to characterize FRET-PAINT. The docking strand contains biotin (B) at the 5’-end for surface immobilization. The donor strand is labeled with either Alexa488 or Cy3 at the 3’-end. The acceptor strand is labeled with Cy5 at one of the underlined sites. b Scheme of FRET-PAINT. Donor fluorophores are excited but only acceptor fluorophores excited via FRET are detected. c Representative Cy5 fluorescence intensity time traces with 1000 nM Donor_P1_Alexa488 and 100 nM Acceptor_P11_Cy5. d Normalized FRET efficiency as a function of the donor-acceptor distance for Cy3-Cy5 (black) and Alexa488-Cy5 (red) pairs. (e) DNA-PAINT images of surface immobilized docking strand (Docking_P0) at indicated concentrations of Acceptor_P11_Cy3. f FRET-PAINT images of Docking_P0 at indicated concentrations of Donor_P1_Cy3 with Acceptor_P6_Cy5 fixed at 10 nM. g FRET-PAINT images of Docking_P0 at indicated concentrations of Acceptor_P6_Cy5 with Donor_P1_Cy3 fixed at 10 nM. h FRET-PAINT images of Docking_P0 at the indicated concentration of Donor_P1_Alexa488 with Acceptor_P2_Cy5 fixed at 10 nM. i FRET-PAINT images of Docking_P0 at the indicated concentration of Acceptor_P2_Cy5 with Donor_P1_Alexa488 fixed at 10 nM. Scale bars: 1 μm. j Comparison of SNRs of DNA-PAINT at varying Cy3 imager strand concentration (black) and FRET-PAINT at varying Cy3 donor strand (red solid), and Cy5 acceptor strand (red open) concentration. k Comparison of SNRs of DNA-PAINT at varying Cy3 imager strand concentration (black) and FRET-PAINT at varying Alexa488 donor strand (red solid), and Cy5 acceptor strand (red open) concentrations. SNR was defined as the ratio of spot brightness (amplitude of two-dimensional Gaussian fit of spot) to the background fluctuation (FWHM of Gaussian fit of background signal). The data were fitted to an inverse square root of imager concentration. Green dashed lines are added to help find the data points with SNR = 3.3
Fig. 2
Fig. 2
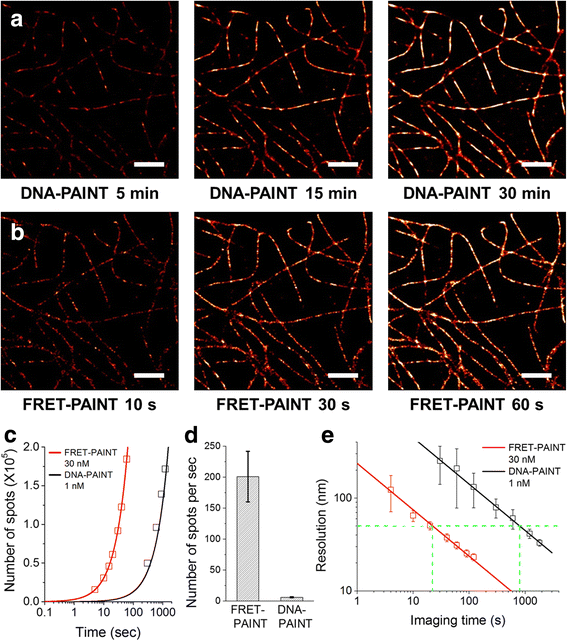
Comparison of the imaging speeds of DNA-PAINT and FRET-PAINT. a DNA-PAINT images reconstructed at specified acquisition time. b FRET-PAINT images of the same area as in (a) reconstructed at specified acquisition time. (c) The accumulated number of localized spots as a function of time for DNA-PAINT images of (a) (black boxes), and FRET-PAINT images of (b) (red boxes). The data are fitted to linear functions (solid lines). The slope of FRET-PAINT is 29-fold larger than that of DNA-PAINT. (d) Comparison of the number of localized single-molecule spots per second of FRET-PAINT and DNA-PAINT. Nine different areas were sequentially imaged using FRET-PAINT and DNA-PAINT, and analysed to get the graph. The error bars represent standard deviation. (e) Comparison of spatial resolution of DNA-PAINT and FRET-PAINT as a function of imaging time. Seven different imaging areas were analysed to calculate resolution for each image. The error bars represent standard deviation. To obtain 50-nm spatial resolution (horizontal dashed line), 800-s imaging time was required to obtain the same spatial resolution using DNA-PAINT. On the other hand, 22-s imaging time was required for FRET-PAINT when we used 30 nM donor strand, revealing 36-fold increase of imaging speed. Scale bars: 2 um
Fig. 3
Fig. 3
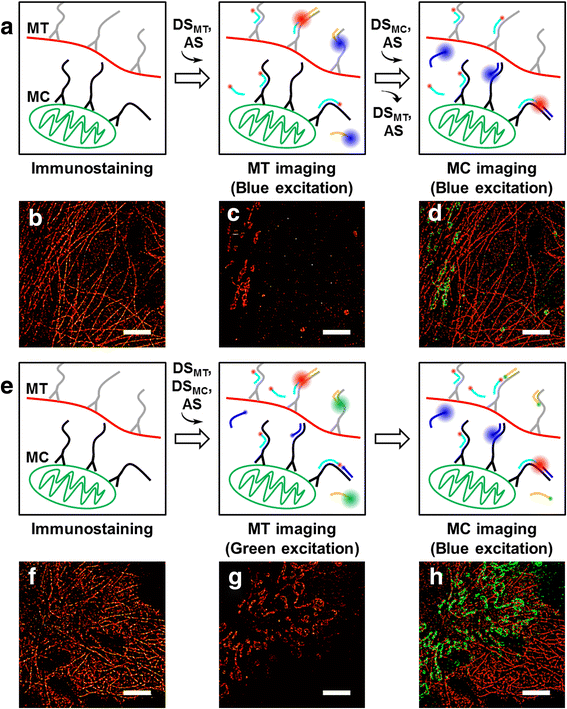
Multiplexing capability of FRET-PAINT. a Multiplexed imaging that uses a donor and acceptor strand exchange scheme. FRET-PAINT images of microtubule (b), and mitochondria (c) obtained using the scheme (a). The both images were obtained at excitation of the same donor (Alexa488) by a blue laser. (d) An overlaid image of b and c. (e) Multiplexed imaging without buffer exchange. All donor and acceptor strands are simultaneously introduced into the imaging chamber, but microtubules and mitochondria were imaged sequentially by using different excitation lasers. FRET-PAINT images of microtubule (f) and mitochondria (g) obtained using the scheme (e). Microtubule images were obtained with green laser excitation whereas mitochondria images were obtained with blue laser excitation. (h) An overlaid image of f and g. All FRET-PAINT images were reconstructed from 500 frames recorded at a frame rate of 10 Hz. MT, microtubule; MC, mitochondria; DS, donor strand; AS, acceptor strand. Scale bars: 5 um

Similar articles

Cited by

References

    1. Hell SW, Wichmann J. Breaking the diffraction resolution limit by stimulated emission: stimulated-emission-depletion fluorescence microscopy. J. Opt. Lett. 1994;19:780–782. doi: 10.1364/OL.19.000780. - DOI - PubMed
    1. Hell SW, Kroug M. Ground-state-depletion fluorscence microscopy: A concept for breaking the diffraction resolution limit. Appl. Phys. B. 1995;60:495–497. doi: 10.1007/BF01081333. - DOI
    1. Gustafsson MGL. Surpassing the lateral resolution limit by a factor of two using structured illumination microscopy. J. Microsc. 2000;198:82–87. doi: 10.1046/j.1365-2818.2000.00710.x. - DOI - PubMed
    1. Gustafsson MGL. Nonlinear structured-illumination microscopy: Wide-field fluorescence imaging with theoretically unlimited resolution. Proc. Natl. Acad. Sci. USA. 2005;102:13081–13086. doi: 10.1073/pnas.0406877102. - DOI - PMC - PubMed
    1. Betzig E, Patterson GH, Sougrat R, Lindwasser OW, Olenych S, Bonifacino JS, Davidson MW, Lippincott-Schwartz J, Hess HF. Imaging Intracellular Fluorescent Proteins at Nanometer Resolution. Science. 2006;313:1642–1645. doi: 10.1126/science.1127344. - DOI - PubMed

Publication types